Journal of Southern Medical University ›› 2024, Vol. 44 ›› Issue (7): 1361-1370.doi: 10.12122/j.issn.1673-4254.2024.07.16
Previous Articles Next Articles
Heping LI( ), Gaohua LI, Xuehua ZHANG, Yanan WANG()
Received:2024-03-28
Online:2024-07-20
Published:2024-07-25
Contact:
Yanan WANG
E-mail:peace_li1985@163.com;wyn8116@163.com
Heping LI, Gaohua LI, Xuehua ZHANG, Yanan WANG. Genetic drivers for inflammatory protein markers in colorectal cancer: a Mendelian randomization approach to clinical prognosis study[J]. Journal of Southern Medical University, 2024, 44(7): 1361-1370.
Add to citation manager EndNote|Ris|BibTeX
URL: https://www.j-smu.com/EN/10.12122/j.issn.1673-4254.2024.07.16
| Gene | Forward primer (5'-3') | Reverse primer (5'-3') |
|---|---|---|
| PD-L1 | 5'-TGGCATTTGCTGAACGCAT-3' | 5'-TGCTTGTCCAGATGACTTCG-3' |
| AXIN1 | 5'-AGCCTGCTGTACTGCTGCTA-3' | 5'-TGCAGAGTGAGCGTGTACTC-3' |
| β-NGF | 5'-GCTACATCGAGGAGGCTGTT-3' | 5'-CACAGTGTCCTCAGGTTTGG-3' |
| GAPDH | 5'-ACCACAGTCCATGCCATCAC-3' | 5'-TCCACCACCCTGTTGCTGTA-3' |
Tab.1 Primer sequences for RT-qPCR of PD-L1, AXIN1, and β-NGF genes (with GAPDH as the internal control)
| Gene | Forward primer (5'-3') | Reverse primer (5'-3') |
|---|---|---|
| PD-L1 | 5'-TGGCATTTGCTGAACGCAT-3' | 5'-TGCTTGTCCAGATGACTTCG-3' |
| AXIN1 | 5'-AGCCTGCTGTACTGCTGCTA-3' | 5'-TGCAGAGTGAGCGTGTACTC-3' |
| β-NGF | 5'-GCTACATCGAGGAGGCTGTT-3' | 5'-CACAGTGTCCTCAGGTTTGG-3' |
| GAPDH | 5'-ACCACAGTCCATGCCATCAC-3' | 5'-TCCACCACCCTGTTGCTGTA-3' |
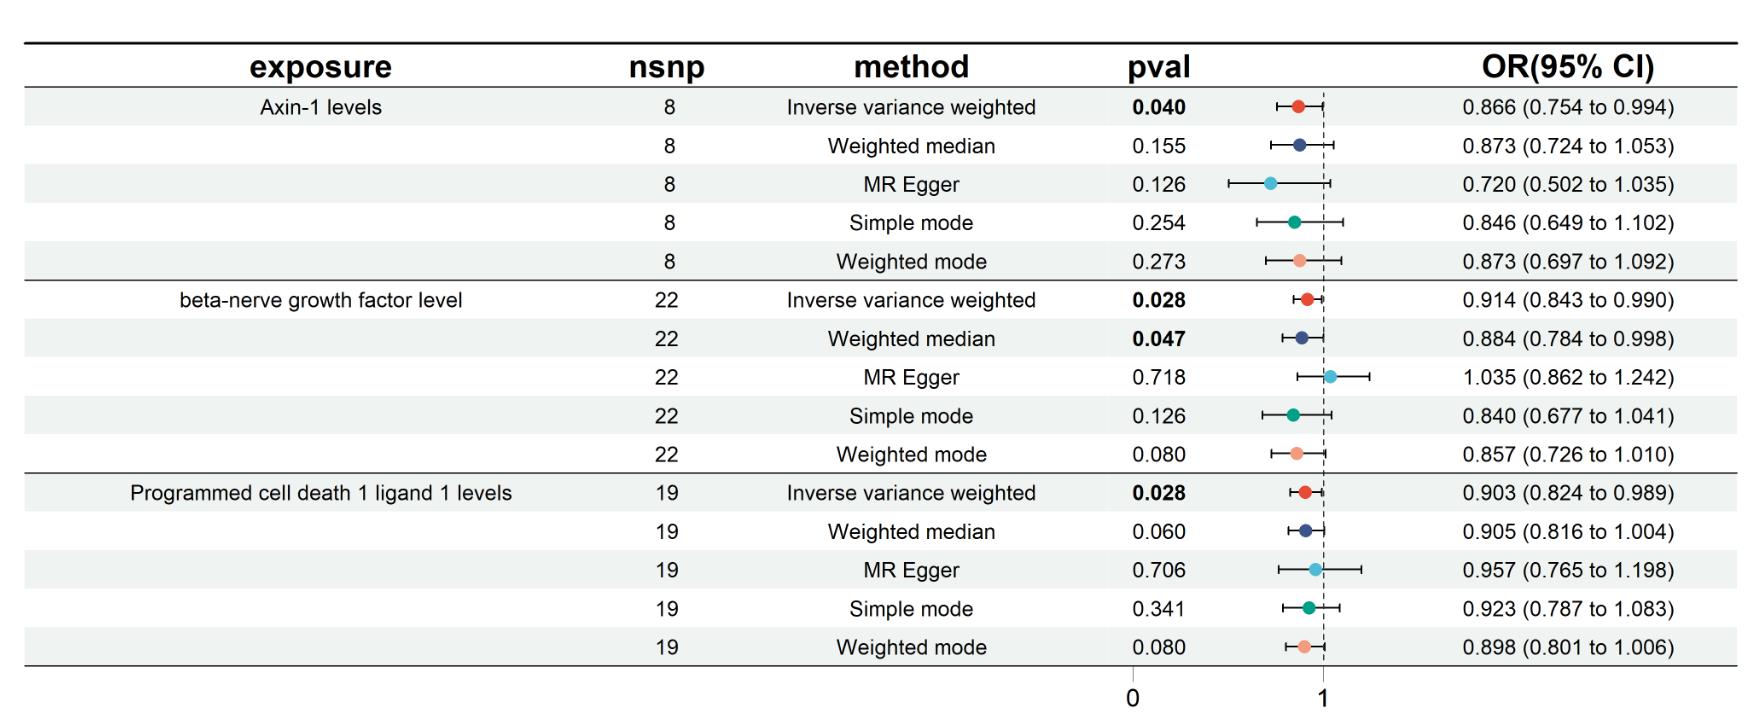
Fig.1 Forest plot visualizing the causal effects of inflammatory protein markers on colorectal cancer risk using 5 Mendelian randomization (MR) analysis models.
| 3 inflammatory protein factors | MR model | P | OR | 95% CI |
|---|---|---|---|---|
| AXIN1 | Inverse variance weighted | 0.040 | 0.866 | 0.754-0.994 |
| Weighted median | 0.155 | 0.873 | 0.724-1.053 | |
| MR Egger | 0.126 | 0.720 | 0.502-1.035 | |
| Simple mode | 0.254 | 0.846 | 0.649-1.102 | |
| Weighted mode | 0.273 | 0.873 | 0.697-1.092 | |
| β-NGF | Inverse variance weighted | 0.028 | 0.914 | 0.843-0.990 |
| Weighted median | 0.047 | 0.884 | 0.784-0.998 | |
| MR Egger | 0.718 | 1.035 | 0.862-1.242 | |
| Simple mode | 0.126 | 0.840 | 0.677-1.041 | |
| Weighted mode | 0.080 | 0.857 | 0.726-1.010 | |
| PD-L1 | Inverse variance weighted | 0.028 | 0.903 | 0.824-0.989 |
| Weighted median | 0.060 | 0.905 | 0.816-1.004 | |
| MR Egger | 0.706 | 0.957 | 0.765-1.198 | |
| Simple mode | 0.341 | 0.923 | 0.787-1.083 | |
| Weighted mode | 0.080 | 0.898 | 0.801-1.006 |
Tab.2 Two-sample MR analysis demonstrating the impact of 3 inflammatory protein markers on colorectal cancer
| 3 inflammatory protein factors | MR model | P | OR | 95% CI |
|---|---|---|---|---|
| AXIN1 | Inverse variance weighted | 0.040 | 0.866 | 0.754-0.994 |
| Weighted median | 0.155 | 0.873 | 0.724-1.053 | |
| MR Egger | 0.126 | 0.720 | 0.502-1.035 | |
| Simple mode | 0.254 | 0.846 | 0.649-1.102 | |
| Weighted mode | 0.273 | 0.873 | 0.697-1.092 | |
| β-NGF | Inverse variance weighted | 0.028 | 0.914 | 0.843-0.990 |
| Weighted median | 0.047 | 0.884 | 0.784-0.998 | |
| MR Egger | 0.718 | 1.035 | 0.862-1.242 | |
| Simple mode | 0.126 | 0.840 | 0.677-1.041 | |
| Weighted mode | 0.080 | 0.857 | 0.726-1.010 | |
| PD-L1 | Inverse variance weighted | 0.028 | 0.903 | 0.824-0.989 |
| Weighted median | 0.060 | 0.905 | 0.816-1.004 | |
| MR Egger | 0.706 | 0.957 | 0.765-1.198 | |
| Simple mode | 0.341 | 0.923 | 0.787-1.083 | |
| Weighted mode | 0.080 | 0.898 | 0.801-1.006 |
| 88 inflammatory protein factors | P | OR | 95% CI |
|---|---|---|---|
| Level of eukaryotic translation initiation factor 4e-binding protein 1 in blood plasma | 0.330693955 | 1.05701024 | 0.945~1.182 |
| Adenosine deaminase measurement | 0.400744522 | 0.971110383 | 0.907~1.040 |
| Artemin measurement | 0.577886958 | 1.028293723 | 0.932~1.134 |
| Caspase-8 measurement | 0.893225803 | 1.01109646 | 0.861~1.188 |
| Eotaxin measurement | 0.418629293 | 1.049686291 | 0.933~1.181 |
| C-c motif chemokine 19 measurement | 0.138858991 | 0.953521049 | 0.895~1.016 |
| C-c motif chemokine 20 measurement | 0.58707287 | 1.027424201 | 0.932~1.133 |
| C-c motif chemokine 23 measurement | 0.193446913 | 1.0380569 | 0.981~1.098 |
| C-c motif chemokine 25 measurement | 0.276211279 | 1.024595882 | 0.981~1.070 |
| C-c motif chemokine 28 measurement | 0.155521941 | 1.077788608 | 0.972~1.195 |
| C-c motif chemokine 4-like measurement | 0.104239836 | 0.949281216 | 0.892~1.011 |
| Natural killer cell receptor 2b4 measurement | 0.883114482 | 1.006982684 | 0.918~1.105 |
| Cd40 measurement | 0.228753652 | 1.032385457 | 0.980~1.087 |
| T-cell surface glycoprotein cd5 measurement | 0.365387247 | 0.943265519 | 0.831~1.070 |
| Level of t-cell differentiation antigen cd6 in blood plasma | 0.100531596 | 0.951163531 | 0.896~1.010 |
| Cub domain-containing protein 1 measurement | 0.832570494 | 0.988924375 | 0.892~1.096 |
| Macrophage colony-stimulating factor 1 measurement | 0.506667178 | 0.959861227 | 0.851~1.083 |
| Cystatin-d measurement | 0.72428164 | 1.008161078 | 0.964~1.055 |
| Fractalkine measurement | 0.462560826 | 1.040793854 | 0.935~1.158 |
| Cxcl1 measurement | 0.894677494 | 1.00525697 | 0.930~1.086 |
| C-x-c motif chemokine 10 measurement | 0.771709442 | 0.982307712 | 0.871~1.108 |
| C-x-c motif chemokine 11 measurement | 0.575284323 | 1.033187503 | 0.922~1.158 |
| C-x-c motif chemokine 5 measurement | 0.799499229 | 0.988392831 | 0.903~1.082 |
| C-x-c motif chemokine 6 measurement | 0.911547109 | 0.989014351 | 0.814~1.202 |
| C-x-c motif chemokine 9 measurement | 0.228872998 | 0.930704757 | 0.828~1.046 |
| Delta and notch-like epidermal growth factor-related receptor measurement | 0.940378359 | 0.996546078 | 0.910~1.091 |
| Protein s100-a12 measurement | 0.408502837 | 1.040250552 | 0.947~1.142 |
| Fibroblast growth factor 19 measurement | 0.188440681 | 0.917624127 | 0.807~1.043 |
| Fibroblast growth factor 21 measurement | 0.090121312 | 0.912044138 | 0.820~1.015 |
| Fibroblast growth factor 23 measurement | 0.100383968 | 1.100299985 | 0.982~1.233 |
| Fibroblast growth factor 5 measurement | 0.996902105 | 1.00008661 | 0.957~1.045 |
| Fms-related tyrosine kinase 3 ligand measurement | 0.533761185 | 1.029291159 | 0.940~1.127 |
| Glial cell line-derived neurotrophic factor measurement | 0.407072647 | 1.044508504 | 0.942~1.158 |
| Hepatocyte growth factor measurement | 0.262585949 | 0.944119121 | 0.854~1.044 |
| Interferon gamma measurement | 0.237368214 | 1.110258305 | 0.933~1.321 |
| Interleukin-10 measurement | 0.116811526 | 0.911618611 | 0.812~1.023 |
| Interleukin-10 receptor subunit alpha measurement | 0.748459744 | 1.014930285 | 0.927~1.111 |
| Interleukin-10 receptor subunit beta measurement | 0.636886216 | 1.017501244 | 0.947~1.094 |
| Interleukin-12 subunit b measurement | 0.985645686 | 0.999389385 | 0.935~1.068 |
| Interleukin-13 measurement | 0.459701443 | 1.057809342 | 0.911~1.228 |
| Interleukin-15 receptor subunit alpha measurement | 0.640753925 | 1.021046126 | 0.936~1.114 |
| Interleukin-17a measurement | 0.849139422 | 0.989209252 | 0.885~1.106 |
| Interleukin-17c measurement | 0.881546189 | 0.991402959 | 0.885~1.111 |
| Interleukin 18 measurement | 0.558552042 | 0.97218849 | 0.885~1.069 |
| Interleukin-18 receptor 1 measurement | 0.090188729 | 0.95511571 | 0.906~1.007 |
| Interleukin-1 alpha measurement | 0.677978683 | 0.984846788 | 0.916~1.058 |
| Interleukin-2 measurement | 0.07740399 | 0.917987666 | 0.835~1.009 |
| Interleukin-20 measurement | 0.291150659 | 1.093808053 | 0.926~1.292 |
| Interleukin-20 receptor subunit alpha measurement | 0.597326832 | 1.034418796 | 0.912~1.173 |
| Interleukin-22 receptor subunit alpha-1 measurement | 0.286716746 | 0.953002592 | 0.872~1.041 |
| Interleukin-24 measurement | 0.521908621 | 0.938998028 | 0.774~1.138 |
| Interleukin-2 receptor subunit beta measurement | 0.905772546 | 1.010513096 | 0.850~1.202 |
| Level of interleukin-33 in blood plasma | 0.867584002 | 0.987423578 | 0.851~1.146 |
| Interleukin-4 measurement | 0.747455619 | 0.978873314 | 0.860~1.115 |
| Interleukin-5 measurement | 0.711859457 | 1.024422635 | 0.901~1.164 |
| Interleukin-6 measurement | 0.775696404 | 1.015280674 | 0.915~1.127 |
| Interleukin-7 measurement | 0.716962035 | 1.025544025 | 0.895~1.175 |
| Interleukin-8 measurement | 0.752783452 | 1.015097112 | 0.925~1.114 |
| Transforming growth factor beta-1 measurement | 0.274065715 | 1.058249902 | 0.956~1.171 |
| Leukemia inhibitory factor measurement | 0.206989335 | 1.076015903 | 0.960~1.206 |
| Leukemia inhibitory factor receptor measurement | 0.332957247 | 1.045419336 | 0.956~1.144 |
| Ccl2 measurement | 0.202036076 | 1.044503498 | 0.977~1.117 |
| Monocyte chemotactic protein-2 measurement | 0.265061104 | 1.021836151 | 0.984~1.061 |
| Monocyte chemotactic protein 3 measurement | 0.237594093 | 1.065347928 | 0.959~1.183 |
| Monocyte chemotactic protein-4 measurement | 0.503878948 | 1.019953512 | 0.963~1.081 |
| Macrophage inflammatory protein 1a measurement | 0.914789496 | 0.994719076 | 0.903~1.096 |
| Matrix metalloproteinase 1 measurement | 0.691649178 | 0.981202618 | 0.893~1.078 |
| Matrix metalloproteinase 10 measurement | 0.279953505 | 1.051622418 | 0.960~1.152 |
| Level of neurturin in blood plasma | 0.304288769 | 0.936474867 | 0.826~1.061 |
| Neurotrophin-3 measurement | 0.457455683 | 1.042340882 | 0.934~1.163 |
| Osteoprotegerin measurement | 0.077956745 | 1.07367806 | 0.992~1.162 |
| Oncostatin-m measurement | 0.382798408 | 0.940220439 | 0.819~1.080 |
| Stem cell factor measurement | 0.774417755 | 0.988552924 | 0.914~1.070 |
| Sir2-like protein 2 measurement | 0.628422372 | 0.96738532 | 0.846~1.106 |
| Signaling lymphocytic activation molecule measurement | 0.991033477 | 1.000583468 | 0.904~1.108 |
| Sulfotrasferase 1a1 measurement | 0.214016095 | 0.958306538 | 0.896~1.025 |
| Stam binding protein measurement | 0.746256217 | 1.020153145 | 0.904~1.151 |
| Transforming growth factor-alpha measurement | 0.605271992 | 0.95352472 | 0.796~1.142 |
| Tumor necrosis factor measurement | 0.179961864 | 1.078953805 | 0.966~1.206 |
| Lymphotoxin-alpha measurement | 0.244034995 | 1.026859418 | 0.982~1.074 |
| Tumor necrosis factor receptor superfamily member 9 measurement | 0.962790331 | 1.002600075 | 0.899~1.118 |
| Tumor necrosis factor ligand superfamily member 14 measurement | 0.850366904 | 0.994105748 | 0.935~1.057 |
| Tnf-related apoptosis-inducing ligand measurement | 0.148528335 | 0.931451642 | 0.846~1.026 |
| Tnf-related activation-induced cytokine measurement | 0.575971297 | 1.020575767 | 0.950~1.096 |
| Thymic stromal lymphopoietin measurement | 0.845461662 | 0.985914611 | 0.855~1.137 |
| Tumor necrosis factor ligand superfamily member 12 measurement | 0.597249576 | 1.019992959 | 0.948~1.098 |
| Urokinase-type plasminogen activator measurement | 0.559931482 | 0.974045442 | 0.892~1.064 |
| Vascular endothelial growth factor a measurement | 0.346474973 | 0.97745845 | 0.932~1.025 |
Tab.3 Two-Sample MR analysis demonstrating the impact of 88 inflammatory protein factors on colorectal cancer (only the results using the Inverse Variance Weighted Model are shown)
| 88 inflammatory protein factors | P | OR | 95% CI |
|---|---|---|---|
| Level of eukaryotic translation initiation factor 4e-binding protein 1 in blood plasma | 0.330693955 | 1.05701024 | 0.945~1.182 |
| Adenosine deaminase measurement | 0.400744522 | 0.971110383 | 0.907~1.040 |
| Artemin measurement | 0.577886958 | 1.028293723 | 0.932~1.134 |
| Caspase-8 measurement | 0.893225803 | 1.01109646 | 0.861~1.188 |
| Eotaxin measurement | 0.418629293 | 1.049686291 | 0.933~1.181 |
| C-c motif chemokine 19 measurement | 0.138858991 | 0.953521049 | 0.895~1.016 |
| C-c motif chemokine 20 measurement | 0.58707287 | 1.027424201 | 0.932~1.133 |
| C-c motif chemokine 23 measurement | 0.193446913 | 1.0380569 | 0.981~1.098 |
| C-c motif chemokine 25 measurement | 0.276211279 | 1.024595882 | 0.981~1.070 |
| C-c motif chemokine 28 measurement | 0.155521941 | 1.077788608 | 0.972~1.195 |
| C-c motif chemokine 4-like measurement | 0.104239836 | 0.949281216 | 0.892~1.011 |
| Natural killer cell receptor 2b4 measurement | 0.883114482 | 1.006982684 | 0.918~1.105 |
| Cd40 measurement | 0.228753652 | 1.032385457 | 0.980~1.087 |
| T-cell surface glycoprotein cd5 measurement | 0.365387247 | 0.943265519 | 0.831~1.070 |
| Level of t-cell differentiation antigen cd6 in blood plasma | 0.100531596 | 0.951163531 | 0.896~1.010 |
| Cub domain-containing protein 1 measurement | 0.832570494 | 0.988924375 | 0.892~1.096 |
| Macrophage colony-stimulating factor 1 measurement | 0.506667178 | 0.959861227 | 0.851~1.083 |
| Cystatin-d measurement | 0.72428164 | 1.008161078 | 0.964~1.055 |
| Fractalkine measurement | 0.462560826 | 1.040793854 | 0.935~1.158 |
| Cxcl1 measurement | 0.894677494 | 1.00525697 | 0.930~1.086 |
| C-x-c motif chemokine 10 measurement | 0.771709442 | 0.982307712 | 0.871~1.108 |
| C-x-c motif chemokine 11 measurement | 0.575284323 | 1.033187503 | 0.922~1.158 |
| C-x-c motif chemokine 5 measurement | 0.799499229 | 0.988392831 | 0.903~1.082 |
| C-x-c motif chemokine 6 measurement | 0.911547109 | 0.989014351 | 0.814~1.202 |
| C-x-c motif chemokine 9 measurement | 0.228872998 | 0.930704757 | 0.828~1.046 |
| Delta and notch-like epidermal growth factor-related receptor measurement | 0.940378359 | 0.996546078 | 0.910~1.091 |
| Protein s100-a12 measurement | 0.408502837 | 1.040250552 | 0.947~1.142 |
| Fibroblast growth factor 19 measurement | 0.188440681 | 0.917624127 | 0.807~1.043 |
| Fibroblast growth factor 21 measurement | 0.090121312 | 0.912044138 | 0.820~1.015 |
| Fibroblast growth factor 23 measurement | 0.100383968 | 1.100299985 | 0.982~1.233 |
| Fibroblast growth factor 5 measurement | 0.996902105 | 1.00008661 | 0.957~1.045 |
| Fms-related tyrosine kinase 3 ligand measurement | 0.533761185 | 1.029291159 | 0.940~1.127 |
| Glial cell line-derived neurotrophic factor measurement | 0.407072647 | 1.044508504 | 0.942~1.158 |
| Hepatocyte growth factor measurement | 0.262585949 | 0.944119121 | 0.854~1.044 |
| Interferon gamma measurement | 0.237368214 | 1.110258305 | 0.933~1.321 |
| Interleukin-10 measurement | 0.116811526 | 0.911618611 | 0.812~1.023 |
| Interleukin-10 receptor subunit alpha measurement | 0.748459744 | 1.014930285 | 0.927~1.111 |
| Interleukin-10 receptor subunit beta measurement | 0.636886216 | 1.017501244 | 0.947~1.094 |
| Interleukin-12 subunit b measurement | 0.985645686 | 0.999389385 | 0.935~1.068 |
| Interleukin-13 measurement | 0.459701443 | 1.057809342 | 0.911~1.228 |
| Interleukin-15 receptor subunit alpha measurement | 0.640753925 | 1.021046126 | 0.936~1.114 |
| Interleukin-17a measurement | 0.849139422 | 0.989209252 | 0.885~1.106 |
| Interleukin-17c measurement | 0.881546189 | 0.991402959 | 0.885~1.111 |
| Interleukin 18 measurement | 0.558552042 | 0.97218849 | 0.885~1.069 |
| Interleukin-18 receptor 1 measurement | 0.090188729 | 0.95511571 | 0.906~1.007 |
| Interleukin-1 alpha measurement | 0.677978683 | 0.984846788 | 0.916~1.058 |
| Interleukin-2 measurement | 0.07740399 | 0.917987666 | 0.835~1.009 |
| Interleukin-20 measurement | 0.291150659 | 1.093808053 | 0.926~1.292 |
| Interleukin-20 receptor subunit alpha measurement | 0.597326832 | 1.034418796 | 0.912~1.173 |
| Interleukin-22 receptor subunit alpha-1 measurement | 0.286716746 | 0.953002592 | 0.872~1.041 |
| Interleukin-24 measurement | 0.521908621 | 0.938998028 | 0.774~1.138 |
| Interleukin-2 receptor subunit beta measurement | 0.905772546 | 1.010513096 | 0.850~1.202 |
| Level of interleukin-33 in blood plasma | 0.867584002 | 0.987423578 | 0.851~1.146 |
| Interleukin-4 measurement | 0.747455619 | 0.978873314 | 0.860~1.115 |
| Interleukin-5 measurement | 0.711859457 | 1.024422635 | 0.901~1.164 |
| Interleukin-6 measurement | 0.775696404 | 1.015280674 | 0.915~1.127 |
| Interleukin-7 measurement | 0.716962035 | 1.025544025 | 0.895~1.175 |
| Interleukin-8 measurement | 0.752783452 | 1.015097112 | 0.925~1.114 |
| Transforming growth factor beta-1 measurement | 0.274065715 | 1.058249902 | 0.956~1.171 |
| Leukemia inhibitory factor measurement | 0.206989335 | 1.076015903 | 0.960~1.206 |
| Leukemia inhibitory factor receptor measurement | 0.332957247 | 1.045419336 | 0.956~1.144 |
| Ccl2 measurement | 0.202036076 | 1.044503498 | 0.977~1.117 |
| Monocyte chemotactic protein-2 measurement | 0.265061104 | 1.021836151 | 0.984~1.061 |
| Monocyte chemotactic protein 3 measurement | 0.237594093 | 1.065347928 | 0.959~1.183 |
| Monocyte chemotactic protein-4 measurement | 0.503878948 | 1.019953512 | 0.963~1.081 |
| Macrophage inflammatory protein 1a measurement | 0.914789496 | 0.994719076 | 0.903~1.096 |
| Matrix metalloproteinase 1 measurement | 0.691649178 | 0.981202618 | 0.893~1.078 |
| Matrix metalloproteinase 10 measurement | 0.279953505 | 1.051622418 | 0.960~1.152 |
| Level of neurturin in blood plasma | 0.304288769 | 0.936474867 | 0.826~1.061 |
| Neurotrophin-3 measurement | 0.457455683 | 1.042340882 | 0.934~1.163 |
| Osteoprotegerin measurement | 0.077956745 | 1.07367806 | 0.992~1.162 |
| Oncostatin-m measurement | 0.382798408 | 0.940220439 | 0.819~1.080 |
| Stem cell factor measurement | 0.774417755 | 0.988552924 | 0.914~1.070 |
| Sir2-like protein 2 measurement | 0.628422372 | 0.96738532 | 0.846~1.106 |
| Signaling lymphocytic activation molecule measurement | 0.991033477 | 1.000583468 | 0.904~1.108 |
| Sulfotrasferase 1a1 measurement | 0.214016095 | 0.958306538 | 0.896~1.025 |
| Stam binding protein measurement | 0.746256217 | 1.020153145 | 0.904~1.151 |
| Transforming growth factor-alpha measurement | 0.605271992 | 0.95352472 | 0.796~1.142 |
| Tumor necrosis factor measurement | 0.179961864 | 1.078953805 | 0.966~1.206 |
| Lymphotoxin-alpha measurement | 0.244034995 | 1.026859418 | 0.982~1.074 |
| Tumor necrosis factor receptor superfamily member 9 measurement | 0.962790331 | 1.002600075 | 0.899~1.118 |
| Tumor necrosis factor ligand superfamily member 14 measurement | 0.850366904 | 0.994105748 | 0.935~1.057 |
| Tnf-related apoptosis-inducing ligand measurement | 0.148528335 | 0.931451642 | 0.846~1.026 |
| Tnf-related activation-induced cytokine measurement | 0.575971297 | 1.020575767 | 0.950~1.096 |
| Thymic stromal lymphopoietin measurement | 0.845461662 | 0.985914611 | 0.855~1.137 |
| Tumor necrosis factor ligand superfamily member 12 measurement | 0.597249576 | 1.019992959 | 0.948~1.098 |
| Urokinase-type plasminogen activator measurement | 0.559931482 | 0.974045442 | 0.892~1.064 |
| Vascular endothelial growth factor a measurement | 0.346474973 | 0.97745845 | 0.932~1.025 |
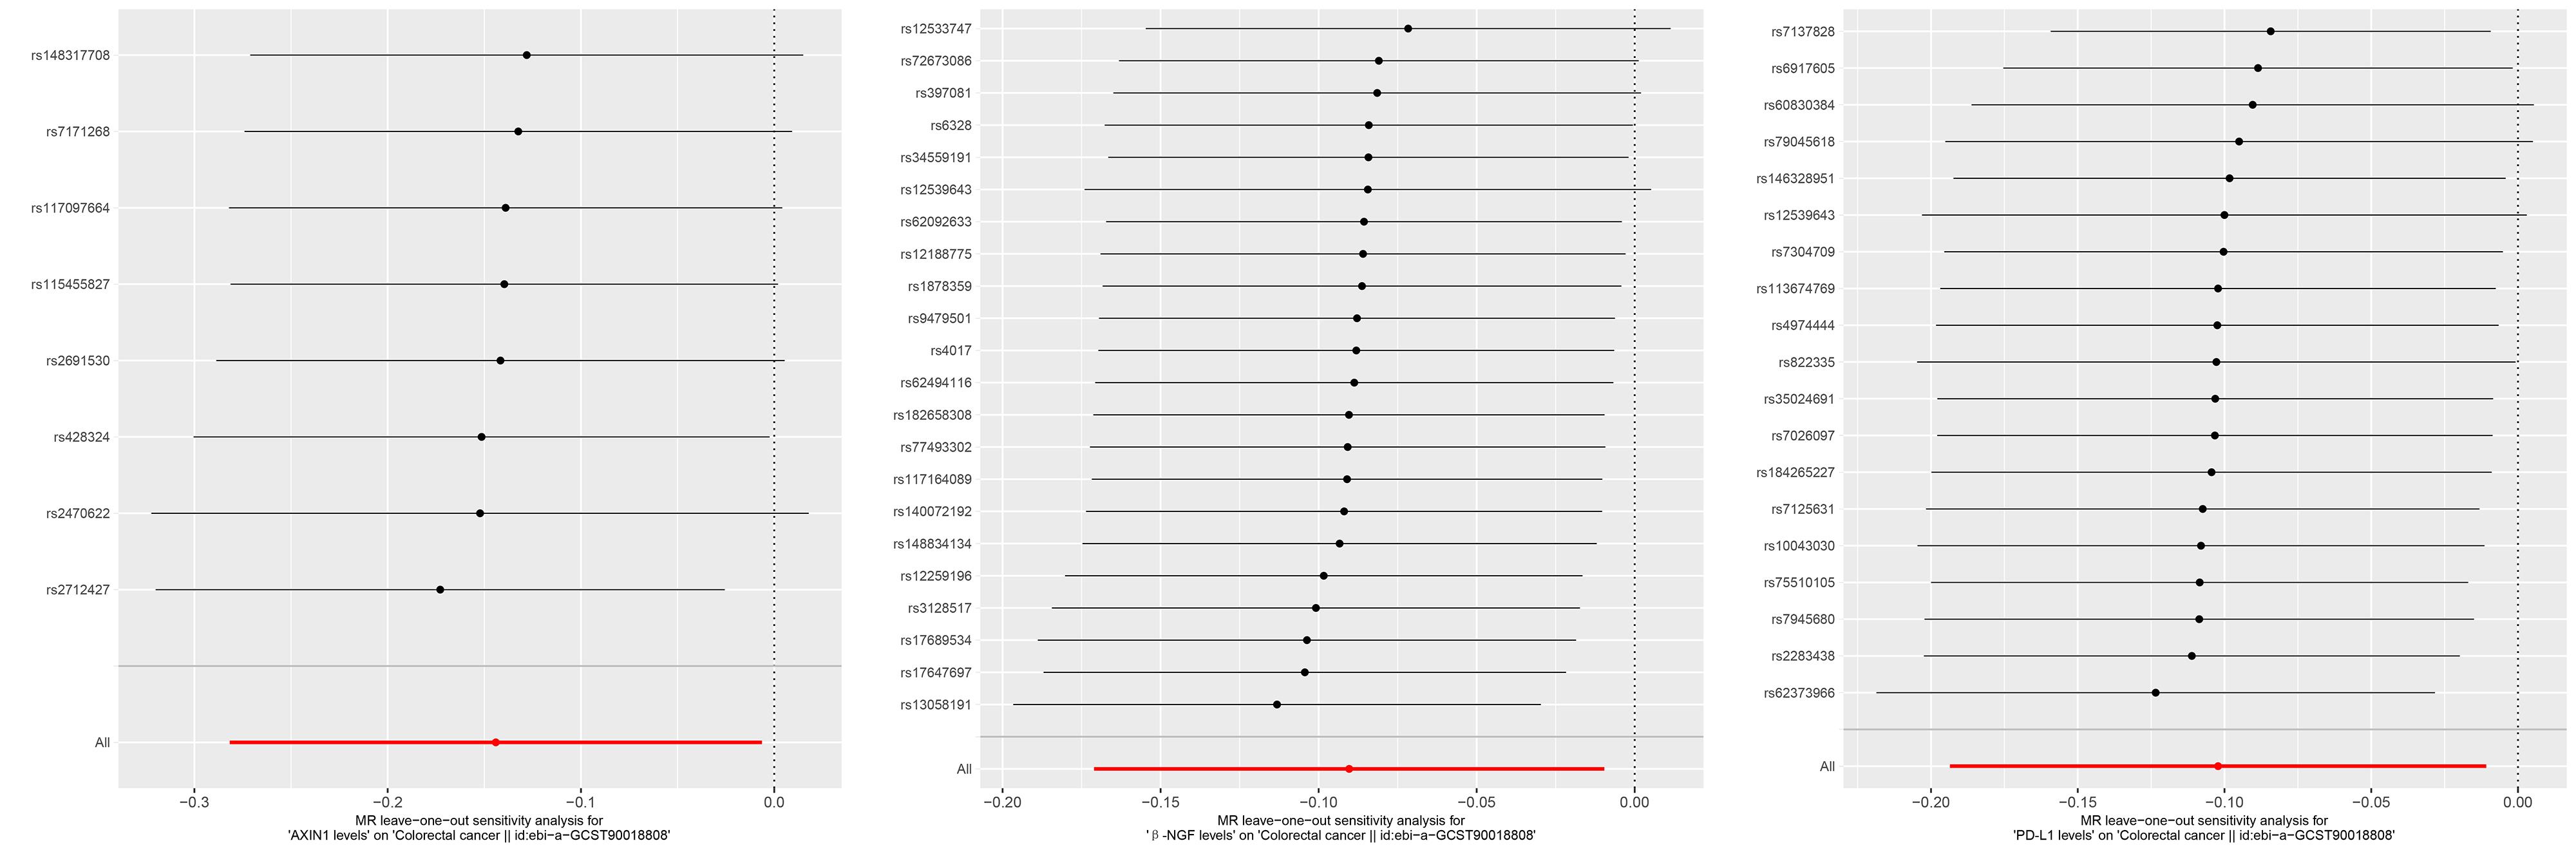
Fig.2 "Leave-One-Out" sensitivity analysis graph for three inflammatory protein markers with a significant causal relationship to colorectal cancer.
| General data title | Value (Mean±SD) | Proportion n(%) |
|---|---|---|
| Age (year) | 54.36±16.57 | |
| Gender | ||
| Male | 62 (72.09%) | |
| Female | 24 (27.91%) | |
| Body weight (kg) | 56.761±15.209 | |
| Height (cm) | 161.734±12.281 | |
| BMI (kg/m2) | 21.576±2.187 | |
| Smoking status | ||
| Yes | 23 (26.74%) | |
| No | 63 (73.26%) | |
| Maximum diameter (mm) | 7.793±4.466 | |
| Large (≥7.92) | 11.38±3.78 | 44 (51.16%) |
| Small (<7.92) | 2.67±1.30 | 42 (48.84%) |
| TNM stage | ||
| I | 9 (10.47%) | |
| II | 14 (16.28%) | |
| III | 37 (43.02%) | |
| IV | 26 (30.23%) | |
| Degree of differentiation | ||
| Poorly differentiated | 22 (25.58%) | |
| Moderately differentiated | 33 (38.37%) | |
| Well differentiated | 31 (36.05%) | |
| Pathological type | ||
| Tubular adenocarcinoma | 55 (63.95%) | |
| Mucinous adenocarcinoma | 14 (16.28%) | |
| Signet ring cell carcinoma | 17 (19.77%) | |
| Metastasis status | ||
| Yes | 67 (77.91%) | |
| No | 19 (22.09%) | |
| AXIN1 | 0.528±0.308 | |
| High expression | 35 (40.70%) | |
| Low expression | 51 (59.30%) | |
| β-NGF | 2.948±1.626 | |
| High expression | 44 (51.16%) | |
| Low expression | 42 (48.84%) | |
| PD-L1 | 22.415±6.046 | |
| High expression | 42 (48.84%) | |
| Low expression | 44 (51.16%) |
Tab.5 Baseline demographic and clinical data the untreated patients with colorectal cancer
| General data title | Value (Mean±SD) | Proportion n(%) |
|---|---|---|
| Age (year) | 54.36±16.57 | |
| Gender | ||
| Male | 62 (72.09%) | |
| Female | 24 (27.91%) | |
| Body weight (kg) | 56.761±15.209 | |
| Height (cm) | 161.734±12.281 | |
| BMI (kg/m2) | 21.576±2.187 | |
| Smoking status | ||
| Yes | 23 (26.74%) | |
| No | 63 (73.26%) | |
| Maximum diameter (mm) | 7.793±4.466 | |
| Large (≥7.92) | 11.38±3.78 | 44 (51.16%) |
| Small (<7.92) | 2.67±1.30 | 42 (48.84%) |
| TNM stage | ||
| I | 9 (10.47%) | |
| II | 14 (16.28%) | |
| III | 37 (43.02%) | |
| IV | 26 (30.23%) | |
| Degree of differentiation | ||
| Poorly differentiated | 22 (25.58%) | |
| Moderately differentiated | 33 (38.37%) | |
| Well differentiated | 31 (36.05%) | |
| Pathological type | ||
| Tubular adenocarcinoma | 55 (63.95%) | |
| Mucinous adenocarcinoma | 14 (16.28%) | |
| Signet ring cell carcinoma | 17 (19.77%) | |
| Metastasis status | ||
| Yes | 67 (77.91%) | |
| No | 19 (22.09%) | |
| AXIN1 | 0.528±0.308 | |
| High expression | 35 (40.70%) | |
| Low expression | 51 (59.30%) | |
| β-NGF | 2.948±1.626 | |
| High expression | 44 (51.16%) | |
| Low expression | 42 (48.84%) | |
| PD-L1 | 22.415±6.046 | |
| High expression | 42 (48.84%) | |
| Low expression | 44 (51.16%) |
| Clinical features | Gene name | Smoker/Large/Metastasis Present | Non-smoker/Small/No Metastasis | t | P |
|---|---|---|---|---|---|
| Smoking status | AXIN1 | 0.477±0.326 | 0.561±0.302 | 0.267 | 0.267 |
| β-NGF | 2.883±1.559 | 2.972±1.668 | 0.055 | 0.824 | |
| PD-L1 | 22.064±5.622 | 22.544±6.255 | 0.081 | 0.747 | |
| Maximum diameter | AXIN1 | 0.565±0.302 | 0.511±0.318 | 0.174 | 0.423 |
| β-NGF | 2.983±1.612 | 2.912±1.669 | 0.044 | 0.84 | |
| PD-L1 | 21.501±5.786 | 23.373±6.267 | 0.31 | 0.153 | |
| Metastasis status | AXIN1 | 0.523±0.305 | 0.592±0.325 | 0.219 | 0.393 |
| β-NGF | 2.934±1.598 | 2.999±1.786 | 0.039 | 0.879 | |
| PD-L1 | 22.153±6.258 | 23.339±5.371 | 0.203 | 0.455 |
Tab.6 Expression status of AXIN1, β-NGF and PD-L1 in patients in different subgroups (Mean±SD)
| Clinical features | Gene name | Smoker/Large/Metastasis Present | Non-smoker/Small/No Metastasis | t | P |
|---|---|---|---|---|---|
| Smoking status | AXIN1 | 0.477±0.326 | 0.561±0.302 | 0.267 | 0.267 |
| β-NGF | 2.883±1.559 | 2.972±1.668 | 0.055 | 0.824 | |
| PD-L1 | 22.064±5.622 | 22.544±6.255 | 0.081 | 0.747 | |
| Maximum diameter | AXIN1 | 0.565±0.302 | 0.511±0.318 | 0.174 | 0.423 |
| β-NGF | 2.983±1.612 | 2.912±1.669 | 0.044 | 0.84 | |
| PD-L1 | 21.501±5.786 | 23.373±6.267 | 0.31 | 0.153 | |
| Metastasis status | AXIN1 | 0.523±0.305 | 0.592±0.325 | 0.219 | 0.393 |
| β-NGF | 2.934±1.598 | 2.999±1.786 | 0.039 | 0.879 | |
| PD-L1 | 22.153±6.258 | 23.339±5.371 | 0.203 | 0.455 |
| Clinical features | Gene name | I/Poorly Differentiated/Tubular Adenocarcinoma | II/Moderately Differentiated/Mucinous Adenocarcinoma | III/Well Differentiated/Signet Ring Cell Carcinoma | IV | F | P |
|---|---|---|---|---|---|---|---|
| TNM stage | AXIN1 | 0.495±0.347 | 0.612±0.373 | 0.529±0.286 | 0.528±0.304 | 0.173 | 0.796 |
| β-NGF | 2.882±1.828 | 3.312±1.995 | 2.775±1.56 | 3.027±1.507 | 0.167 | 0.759 | |
| PD-L1 | 20.66±5.717 | 17.893±4.756 | 23.333±6.077 | 24.152±5.714 | 0.653 | 0.007 | |
| Degree of differentiation | AXIN1 | 0.792±0.264 | 0.439±0.226 | 0.331±0.231 | 1.253 | <0.001 | |
| β-NGF | 4.621±1.316 | 2.317±0.875 | 1.538±0.231 | 2.069 | <0.001 | ||
| PD-L1 | 22.566±5.901 | 22.346±5.964 | 22.306±6.695 | 0.028 | 0.985 | ||
| Pathological type | AXIN1 | 0.519±0.306 | 0.6±0.315 | 0.55±0.325 | 0.185 | 0.572 | |
| β-NGF | 2.895±1.593 | 3.216±1.728 | 2.902±1.75 | 0.17 | 0.681 | ||
| PD-L1 | 22.04±5.9 | 22.189±5.521 | 23.816±7.102 | 0.126 | 0.803 |
Tab.7 Expression profiles of AXIN1, β-NGF and PD-L1 mRNA in patients with different clinicopathological characteristics (Mean±SD)
| Clinical features | Gene name | I/Poorly Differentiated/Tubular Adenocarcinoma | II/Moderately Differentiated/Mucinous Adenocarcinoma | III/Well Differentiated/Signet Ring Cell Carcinoma | IV | F | P |
|---|---|---|---|---|---|---|---|
| TNM stage | AXIN1 | 0.495±0.347 | 0.612±0.373 | 0.529±0.286 | 0.528±0.304 | 0.173 | 0.796 |
| β-NGF | 2.882±1.828 | 3.312±1.995 | 2.775±1.56 | 3.027±1.507 | 0.167 | 0.759 | |
| PD-L1 | 20.66±5.717 | 17.893±4.756 | 23.333±6.077 | 24.152±5.714 | 0.653 | 0.007 | |
| Degree of differentiation | AXIN1 | 0.792±0.264 | 0.439±0.226 | 0.331±0.231 | 1.253 | <0.001 | |
| β-NGF | 4.621±1.316 | 2.317±0.875 | 1.538±0.231 | 2.069 | <0.001 | ||
| PD-L1 | 22.566±5.901 | 22.346±5.964 | 22.306±6.695 | 0.028 | 0.985 | ||
| Pathological type | AXIN1 | 0.519±0.306 | 0.6±0.315 | 0.55±0.325 | 0.185 | 0.572 | |
| β-NGF | 2.895±1.593 | 3.216±1.728 | 2.902±1.75 | 0.17 | 0.681 | ||
| PD-L1 | 22.04±5.9 | 22.189±5.521 | 23.816±7.102 | 0.126 | 0.803 |
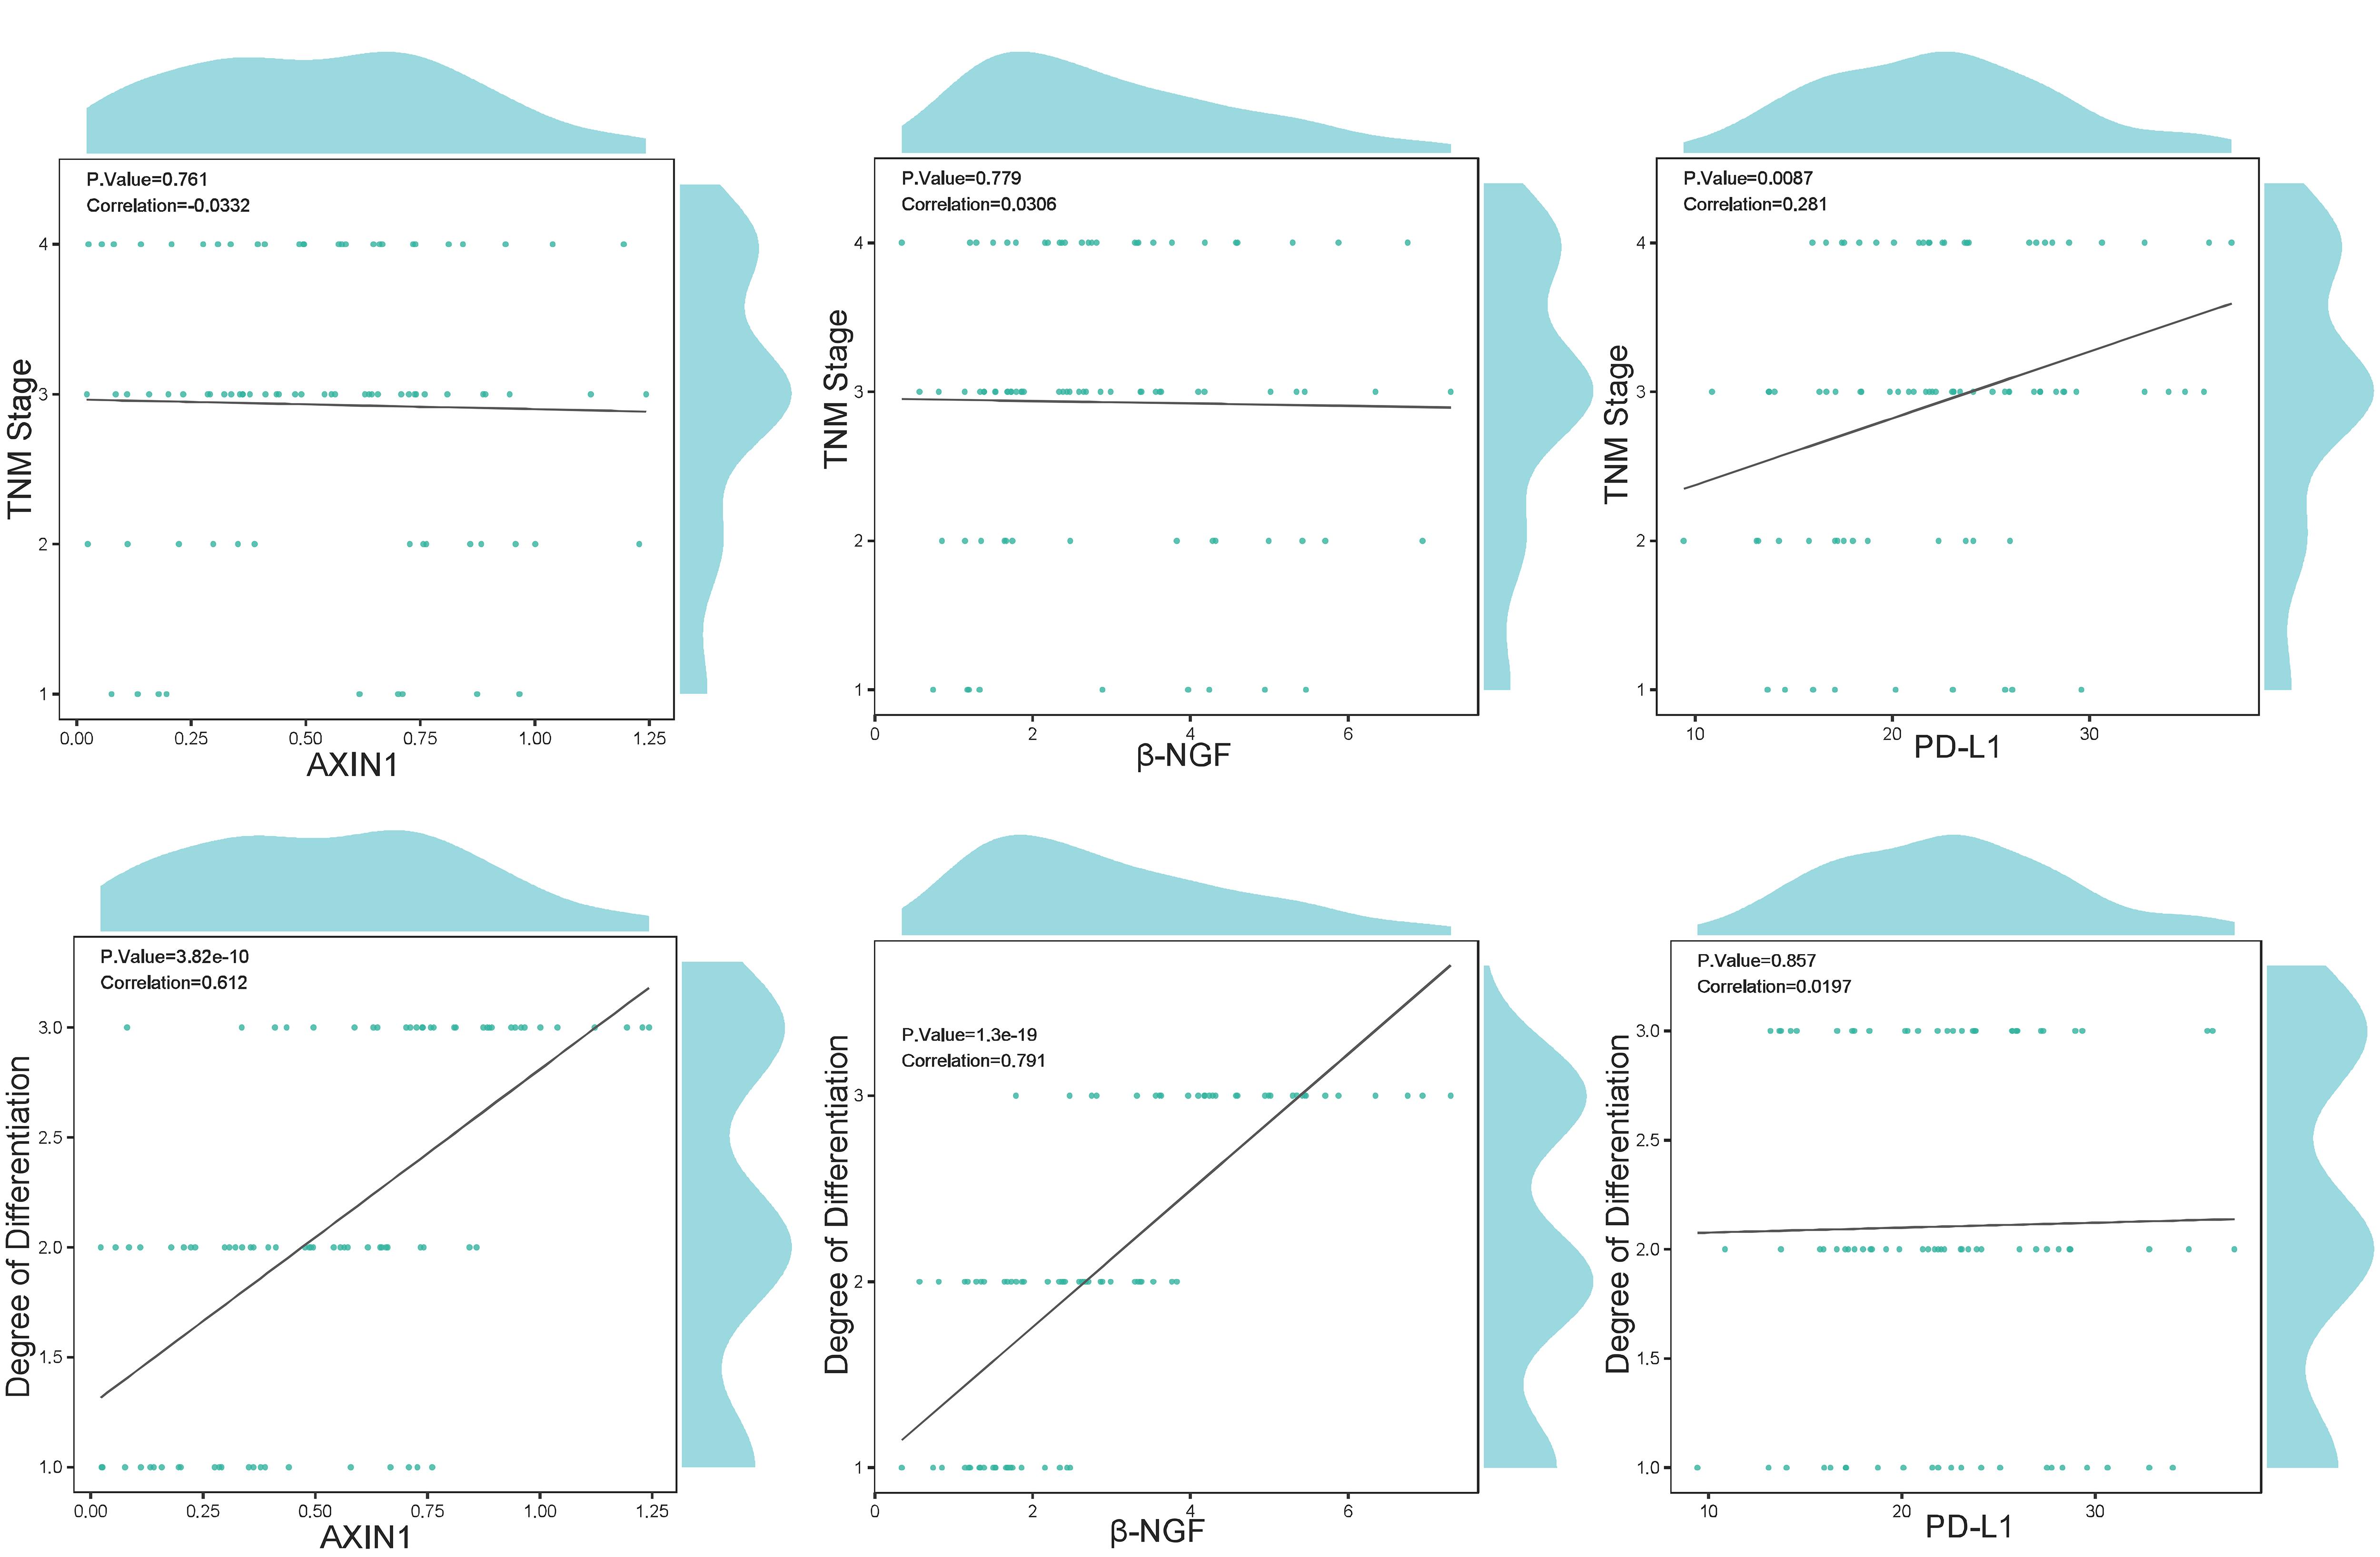
Fig.3 Correlation of the expression levels of PD-L1, AXIN1, β-NGF mRNAs with TNM staging and degree of tumor differentiation.
| 1 | Moon J, Garfinkle R, Zelkowitz P, et al. Incidence and factors associated with mental health disorders in patients with rectal cancer post-restorative proctectomy[J]. Dis Colon Rectum, 2023, 66(9): 1203-11. |
| 2 | Xu ZL, Li Y, Cui YY, et al. Identifications of candidate genes significantly associated with rectal cancer by integrated bioinformatics analysis[J]. Technol Cancer Res Treat, 2020, 19: 1533033820973270. |
| 3 | Belli F. Special issue “current management of early and advanced rectal cancer”[J]. Cancers, 2023, 15(14): 3574. |
| 4 | Hernandez-Ainsa M, Velamazan R, Lanas A, et al. Blood-cell-based inflammatory markers as a useful tool for early diagnosis in colorectal cancer[J]. Front Med, 2022, 9: 843074. |
| 5 | Markozannes G, Kanellopoulou A, Dimopoulou O, et al. Systematic review of Mendelian randomization studies on risk of cancer[J]. BMC Med, 2022, 20(1): 41. |
| 6 | Silva S, Fatumo S, Nitsch D. Mendelian randomization studies on coronary artery disease: a systematic review and meta-analysis[J]. Syst Rev, 2024, 13(1): 29. |
| 7 | Ho J, Mak CCH, Sharma V, et al. Mendelian randomization studies of lifestyle-related risk factors for osteoarthritis: a PRISMA review and meta-analysis[J]. Int J Mol Sci, 2022, 23(19): 11906. |
| 8 | Bouras E, Karhunen V, Gill D, et al. Circulating inflammatory cytokines and risk of five cancers: a Mendelian randomization analysis[J]. BMC Med, 2022, 20(1): 3. |
| 9 | Bull CJ, Hazelwood E, Bell JA, et al. Identifying metabolic features of colorectal cancer liability using Mendelian randomization[J]. medRxiv, 2023: 2023.03.10.23287084. |
| 10 | Zhao JH, Stacey D, Eriksson N, et al. Genetics of circulating inflammatory proteins identifies drivers of immune-mediated disease risk and therapeutic targets[J]. Nat Immunol, 2023, 24(9): 1540-51. |
| 11 | Ference BA, Holmes MV, Smith GD. Using Mendelian randomization to improve the design of randomized trials[J]. Cold Spring Harb Perspect Med, 2021, 11(7): a040980. |
| 12 | Perez RO, São Julião GP. Rectal cancer management and the long list of unanswered questions[J]. Ann Surg Oncol, 2023, 30(8): 4566-7. |
| 13 | Zhu JR, Wu YQ, Lao SX, et al. Targeting TRIM54/Axin1/β-catenin axis prohibits proliferation and metastasis in hepatocellular carcinoma[J]. Front Oncol, 2021, 11: 759842. |
| 14 | 蒋漫琦, 何师茜, 杨 洪, 等. CDK5RAP1通过Wnt/β-Catenin信号通路调控结直肠癌发生和进展的研究[J]. 国际消化病杂志, 2023, 43(4): 246-56. |
| 15 | Rudeen AJ, Douglas JT, Xing ML, et al. The 15-amino acid repeat region of adenomatous polyposis coli is intrinsically disordered and retains conformational flexibility upon binding β-catenin[J]. Biochemistry, 2020, 59(41): 4039-50. |
| 16 | 孙跃胜, 潘江华, 窦巩昊, 等. 结直肠癌的Wnt信号通路相关基因突变的研究[J]. 浙江创伤外科, 2019, 24(3): 437-9. |
| 17 | 梁家宏, 郑周红, 尹朝晖. 神经生长因子及受体在结直肠肿瘤中的表达及临床意义[J]. 当代医学, 2013, 19(28): 1-3. DOI: 10.3969/j.issn.1009-4393.2013.28.001 |
| 18 | 雷 雲, 杨 铃, 张 涛. 神经生长因子对结直肠癌发展和不良预后的影响[J]. 成都医学院学报, 2021, 16(2): 148-52. DOI: 10.3969/j.issn.1674-2257.2021.02.003 |
| 19 | 刘丹丹. 通麻汤联合穴位注射治疗结直肠癌奥沙利铂化疗相关外周神经毒性的效果及对患者生活质量的影响[J]. 临床医学研究与实践, 2022, 7(18): 128-30. |
| 20 | Hsieh RC, Krishnan S, Wu RC, et al. ATR-mediated CD47 and PD-L1 up-regulation restricts radiotherapy-induced immune priming and abscopal responses in colorectal cancer[J]. Sci Immunol, 2022, 7(72): eabl9330. |
| 21 | Boustani J, Derangère V, Bertaut A, et al. Radiotherapy scheme effect on PD-L1 expression for locally advanced rectal cancer[J]. Cells, 2020, 9(9): 2071. |
| 22 | Ding Y, Fu YY, Wei W, et al. Simultaneous high PD-L1 and low VEGFR2 expression is associated with better overall survival in rectal cancer[J]. Transl Cancer Res, 2021, 10(1): 499-508. |
| 23 | Cornista AM, Giolito MV, Baker K, et al. Colorectal cancer immunotherapy: state of the art and future directions[J]. Gastro Hep Adv, 2023, 2(8): 1103-19. |
| 24 | Lim YJ, Koh J, Choi M, et al. Prognostic stratification based on the levels of tumor-infiltrating myeloid-derived suppressor cells and PD-1/PD-L1 axis in locally advanced rectal cancer[J]. Front Oncol, 2022, 12: 1018700. |
| 25 | Ugai T, Shimizu T, Kawamura H, et al. Inverse relationship between Fusobacterium nucleatum amount and tumor CD274 (PD-L1) expression in colorectal carcinoma[J]. Clin Transl Immunology, 2023, 12(8): e1453. |
| 26 | Srivastava P, Husain N, Shukla S, et al. PD-L1 Expression in colorectal carcinoma and its correlation with clinicopathological parameters, microsatellite instability and BRAF mutation[J]. Indian J Pathol Microbiol, 2021, 64(3): 490-6. |
| 27 | Qiu QQ, Tan D, Chen QF, et al. Clinical implications of PD-L1 expression and pathway-related molecular subtypes in advanced Asian colorectal cancer patients[J]. Am J Cancer Res, 2024, 14(2): 796-808. |
| 28 | Secinti IE, Ozgur T, Dede I. PD-L1 expression in colorectal adenocarcinoma is associated with the tumor immune microenvironment and epithelial-mesenchymal transition[J]. Am J Clin Pathol, 2022, 158(4): 506-15. |
| 29 | Moradifard S, Minuchehr Z, Ganji SM. An investigation on the c-MYC, AXIN1, and COL11A1 gene expression in colorectal cancer[J]. Biotechnol Appl Biochem, 2022, 69(4): 1576-86. |
| 30 | Ferraguti G, Terracina S, Tarani L, et al. Nerve growth factor and the role of inflammation in tumor development[J]. Curr Issues Mol Biol, 2024, 46(2): 965-89. |
| [1] | Kang WANG, Haibin LI, Jing YU, Yuan MENG, Hongli ZHANG. High expression of ELFN1 is a prognostic biomarker and promotes proliferation and metastasis of colorectal cancer cells [J]. Journal of Southern Medical University, 2025, 45(7): 1543-1553. |
| [2] | Nuozhou WENG, Bin TAN, Wentao ZENG, Jiayu GU, Lianji WENG, Kehong ZHENG. RGL1 overexpression promotes metastasis of colorectal cancer by upregulating motile focal adhesion assembly via activating the CDC42/RAC1 complex [J]. Journal of Southern Medical University, 2025, 45(5): 1031-1038. |
| [3] | Zhennan MA, Fuquan LIU, Xuefeng ZHAO, Xiaowei ZHANG. High expression of DTX2 promotes proliferation, invasion and epithelial-mesenchymal transition of oxaliplatin-resistant colorectal cancer cells [J]. Journal of Southern Medical University, 2025, 45(4): 829-836. |
| [4] | Wenjie LI, Yaonan HONG, Rui HUANG, Yuchen LI, Ying ZHANG, Yun ZHANG, Dijiong WU. Causal relationship between autoimmune diseases and aplastic anemia: A Mendelian randomization study [J]. Journal of Southern Medical University, 2025, 45(4): 871-879. |
| [5] | Shunjie QING, Zhiyong SHEN. High expression of hexokinase 2 promotes proliferation, migration and invasion of colorectal cancer cells by activating the JAK/STAT pathway and regulating tumor immune microenvironment [J]. Journal of Southern Medical University, 2025, 45(3): 542-553. |
| [6] | Junjie GAO, Kai YE, Jing WU. Quercetin inhibits proliferation and migration of clear cell renal cell carcinoma cells by regulating TP53 gene [J]. Journal of Southern Medical University, 2025, 45(2): 313-321. |
| [7] | Chen YAO, Wenjia LI, Ruiming PANG, Jihong ZHOU. Gluteal tendinitis and primary coxarthrosis may lead to iliotibial band syndrome: a Mendelian randomization study [J]. Journal of Southern Medical University, 2024, 44(9): 1821-1830. |
| [8] | Kai JI, Guanyu YU, Leqi ZHOU, Tianshuai ZHANG, Qianlong LING, Wenjiang MAN, Bing ZHU, Wei ZHANG. HNRNPA1 gene is highly expressed in colorectal cancer: its prognostic implications and potential as a therapeutic target [J]. Journal of Southern Medical University, 2024, 44(9): 1685-1695. |
| [9] | Yinliang ZHANG, Zetan LUO, Rui ZHAO, Na ZHAO, Zhidong XU, Di AO, Guyi CONG, Xinyu LIU, Hailun ZHENG. Sanguinarine induces ferroptosis of colorectal cancer cells by upregulating STUB1 and downregulating GPX4 [J]. Journal of Southern Medical University, 2024, 44(8): 1537-1544. |
| [10] | Weitao ZHONG, Weisong LI, Zelin LI, Qiang WANG, Wangming ZHANG. Causal relationship between sleep phenotype and idiopathic normal pressure hydrocephalus: a two-sample bidirectional Mendelian randomization study [J]. Journal of Southern Medical University, 2024, 44(8): 1612-1619. |
| [11] | Jiajin LIU, Changhong MIAO, Jiankang XU, Weijie YU, Jixin CHEN, Haozhi TANG, Aifeng LIU. Causal relationship between gut microbiota and pigmented villonodular synovitis: a Mendelian randomization analysis [J]. Journal of Southern Medical University, 2024, 44(7): 1397-1406. |
| [12] | Nan WANG, Bin SHI, Xiaolan MAN, Weichao WU, Jia CAO. High expression of fragile X mental retardation protein inhibits ferroptosis of colorectal tumor cells by activating the RAS/MAPK signaling pathway [J]. Journal of Southern Medical University, 2024, 44(5): 885-893. |
| [13] | Xueyan XI, Ting DENG, Boyu DU. Colorectal fibroblasts promote malignant phenotype of colorectal cancer cells by activating the ERK signaling pathway [J]. Journal of Southern Medical University, 2024, 44(10): 1866-1873. |
| [14] | YAN Chang, LIU Shuang, SONG Qingzhi, HU Yibing. Metformin inhibits self-renewal of colorectal cancer stem cells by inhibiting mitochondrial oxidative phosphorylation [J]. Journal of Southern Medical University, 2023, 43(8): 1279-1286. |
| [15] | ZHAN Wenjie, ZHAO Ling. Type 1 diabetes mellitus is likely to increase the risk of thyrotoxicdsis: a two-sample Mendelian randomization study [J]. Journal of Southern Medical University, 2023, 43(8): 1396-1401. |
| Viewed | ||||||
|
Full text |
|
|||||
|
Abstract |
|
|||||