
Journal of Southern Medical University ›› 2026, Vol. 46 ›› Issue (9): 2159-2172.doi: 10.12122/j.issn.1673-4254.2026.09.15
Baofeng ZHAO1,2( ), Xueying TAN2, Xuewen LIANG2,3, Yuyao PAN2,3, Jiangshui YUAN2(), Weiqing SONG2()
Received:2026-01-20
Online:2026-09-20
Published:2026-09-30
Contact:
Jiangshui YUAN, Weiqing SONG
E-mail:zbf12340316@163.com;yjs19790104@163.com;songweiqing68@163.com
Supported by:Baofeng ZHAO, Xueying TAN, Xuewen LIANG, Yuyao PAN, Jiangshui YUAN, Weiqing SONG. MIS18BP1 regulates epithelial-mesenchymal transition, proliferation, and migration of renal cancer cells via the PI3K/AKT pathway[J]. Journal of Southern Medical University, 2026, 46(9): 2159-2172.
Add to citation manager EndNote|Ris|BibTeX
URL: https://www.j-smu.com/EN/10.12122/j.issn.1673-4254.2026.09.15
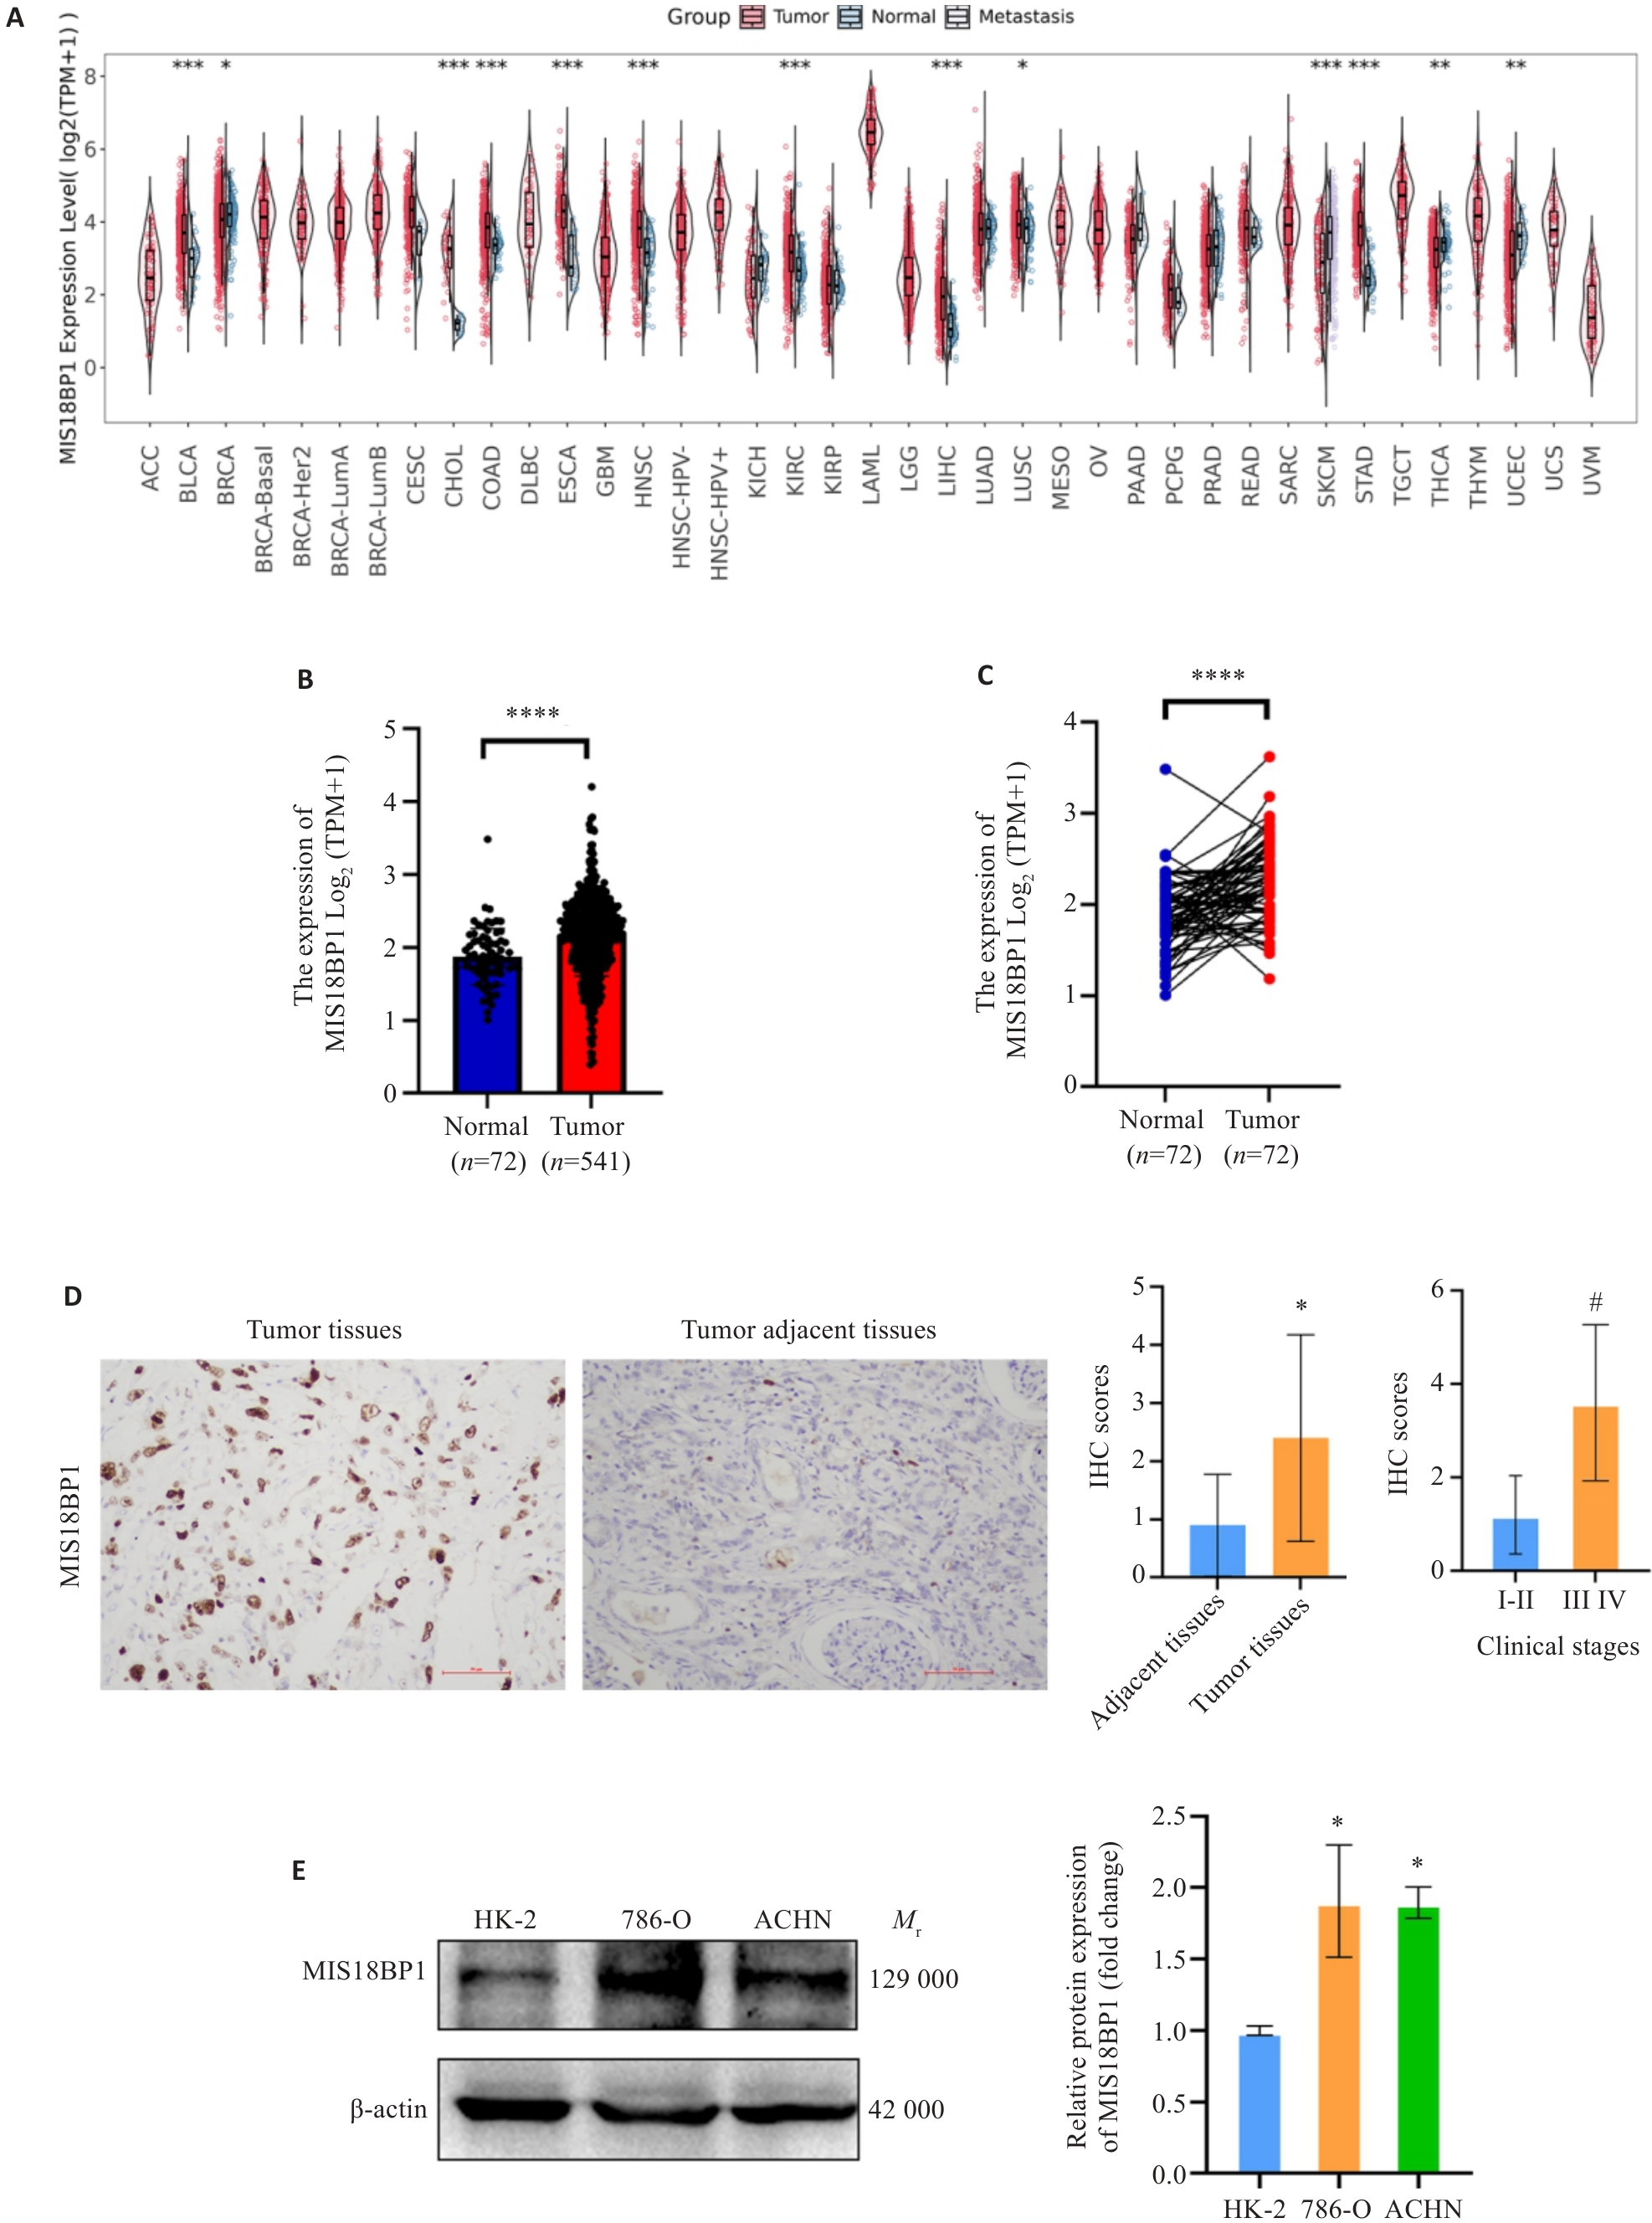
Fig.1 Expression patterns of MIS18BP1 in pan-cancer and renal clear cell carcinoma. A: Differential expression of MIS18BP1 in pan-cancer. *P<0.05, **P<0.01, ***P<0.001 vs Normal. B: Differential expression of MIS18BP1 in KIRC. ****P<0.0001. C: Paired difference analysis. ****P<0.0001. D: Expression of MIS18BP1 protein in renal clear cell carcinoma tissue and adjacent non-cancerous tissue (Original magnification: ×200). *P<0.05 vs adjacent tissues, #P<0.05 vs clinical stage I-II. E: Expression of MIS18BP1 protein in normal renal epithelial cells and renal cancer cell lines. *P<0.05 vs HK-2.
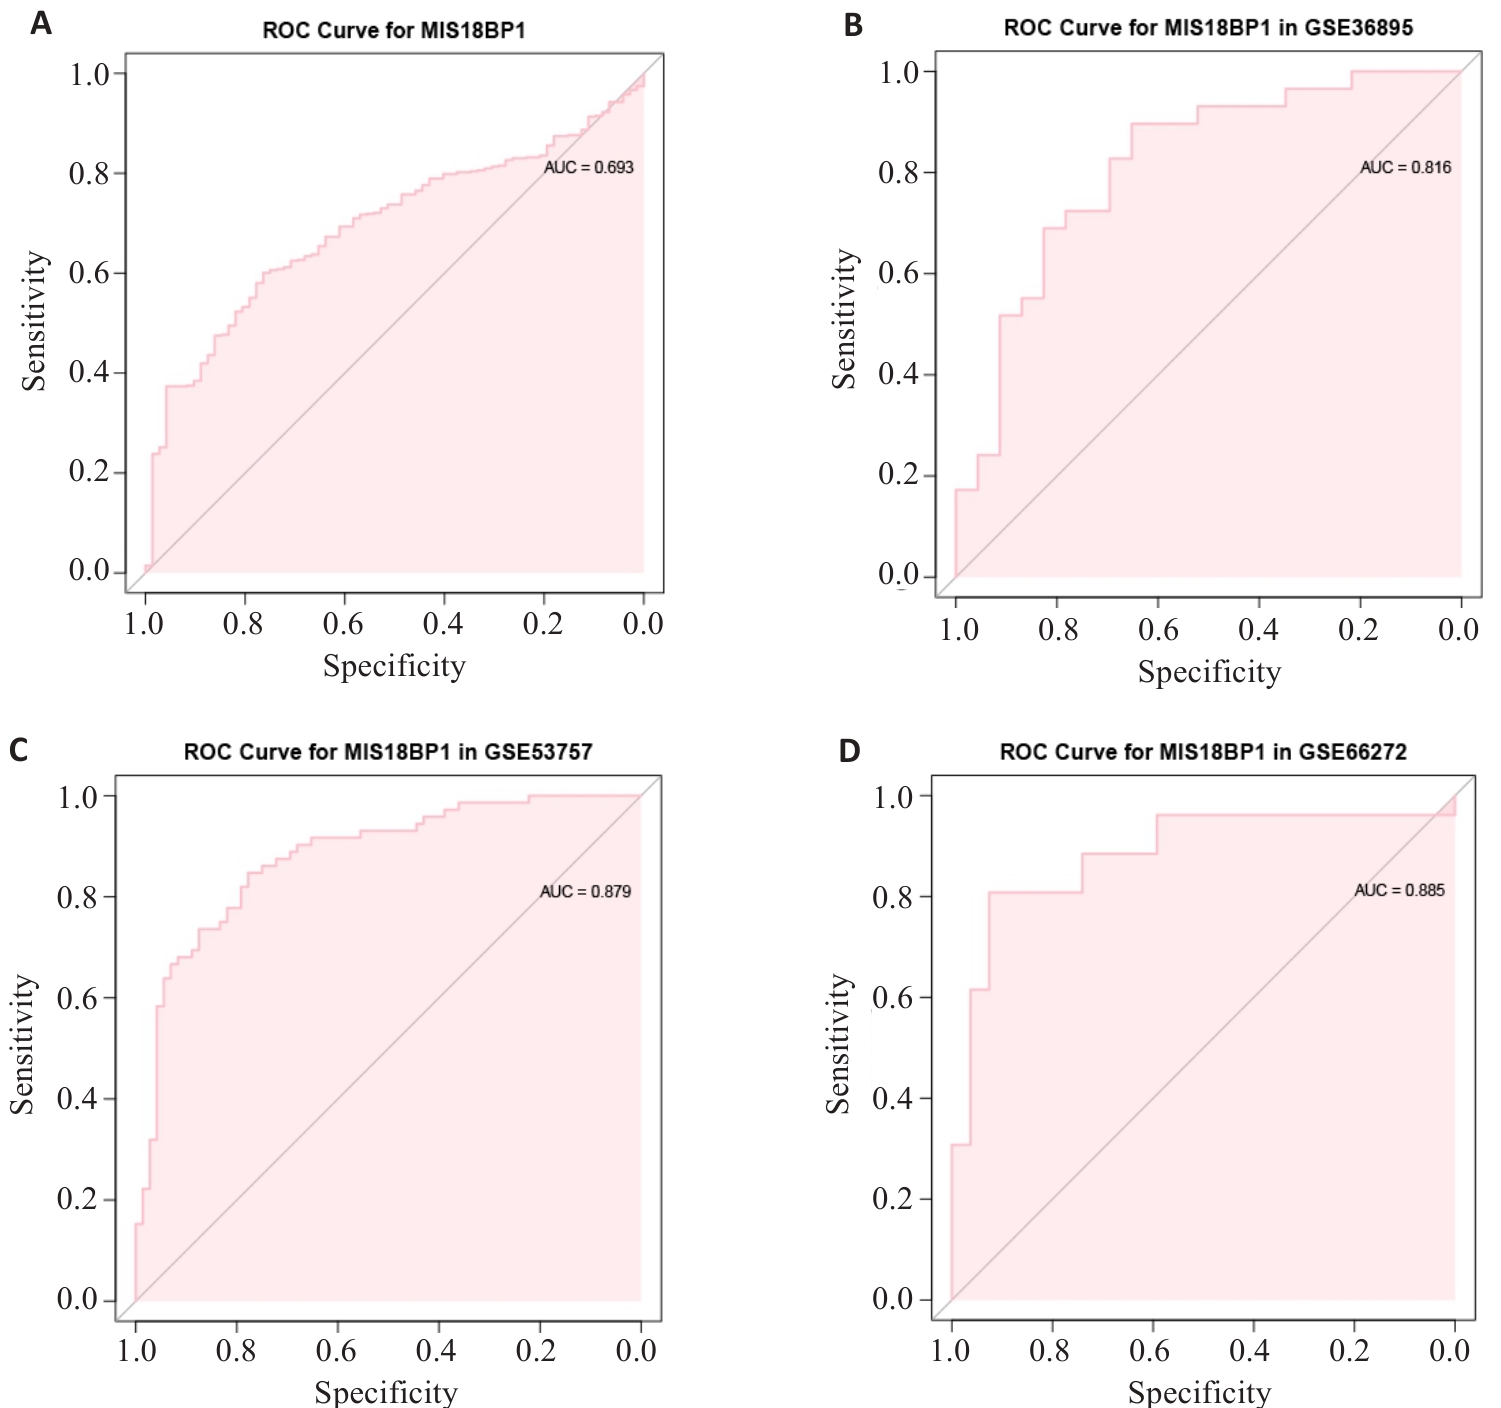
Fig.2 Diagnostic value of MIS18BP1 for KIRC. A: MIS18BP1 ROC curve for predicting overall survival in TCGA. B: ROC curve of MIS18BP1 for predicting overall survival in GSE36895. C: ROC curve of MIS18BP1 for predicting overall survival in GSE53757. D: ROC curve of MIS18BP1 for predicting overall survival in GSE66272.
| Dataset | AUC | Best cutoff | Sensitivity(%) | Specificity(%) | Youden index |
|---|---|---|---|---|---|
| TCGA | 0.693 | 2.097 | 60.07 | 76.39 | 0.3646 |
| GSE36895 | 0.816 | 5.017 | 89.66 | 65.22 | 0.5488 |
| GSE53757 | 0.879 | 6.759 | 84.72 | 77.78 | 0.6250 |
| GSE66272 | 0.885 | 0.0806 | 80.77 | 92.59 | 0.7336 |
Tab.1 Diagnostic performance of MIS18BP1 for KIRC in TCGA and GEO datasets
| Dataset | AUC | Best cutoff | Sensitivity(%) | Specificity(%) | Youden index |
|---|---|---|---|---|---|
| TCGA | 0.693 | 2.097 | 60.07 | 76.39 | 0.3646 |
| GSE36895 | 0.816 | 5.017 | 89.66 | 65.22 | 0.5488 |
| GSE53757 | 0.879 | 6.759 | 84.72 | 77.78 | 0.6250 |
| GSE66272 | 0.885 | 0.0806 | 80.77 | 92.59 | 0.7336 |
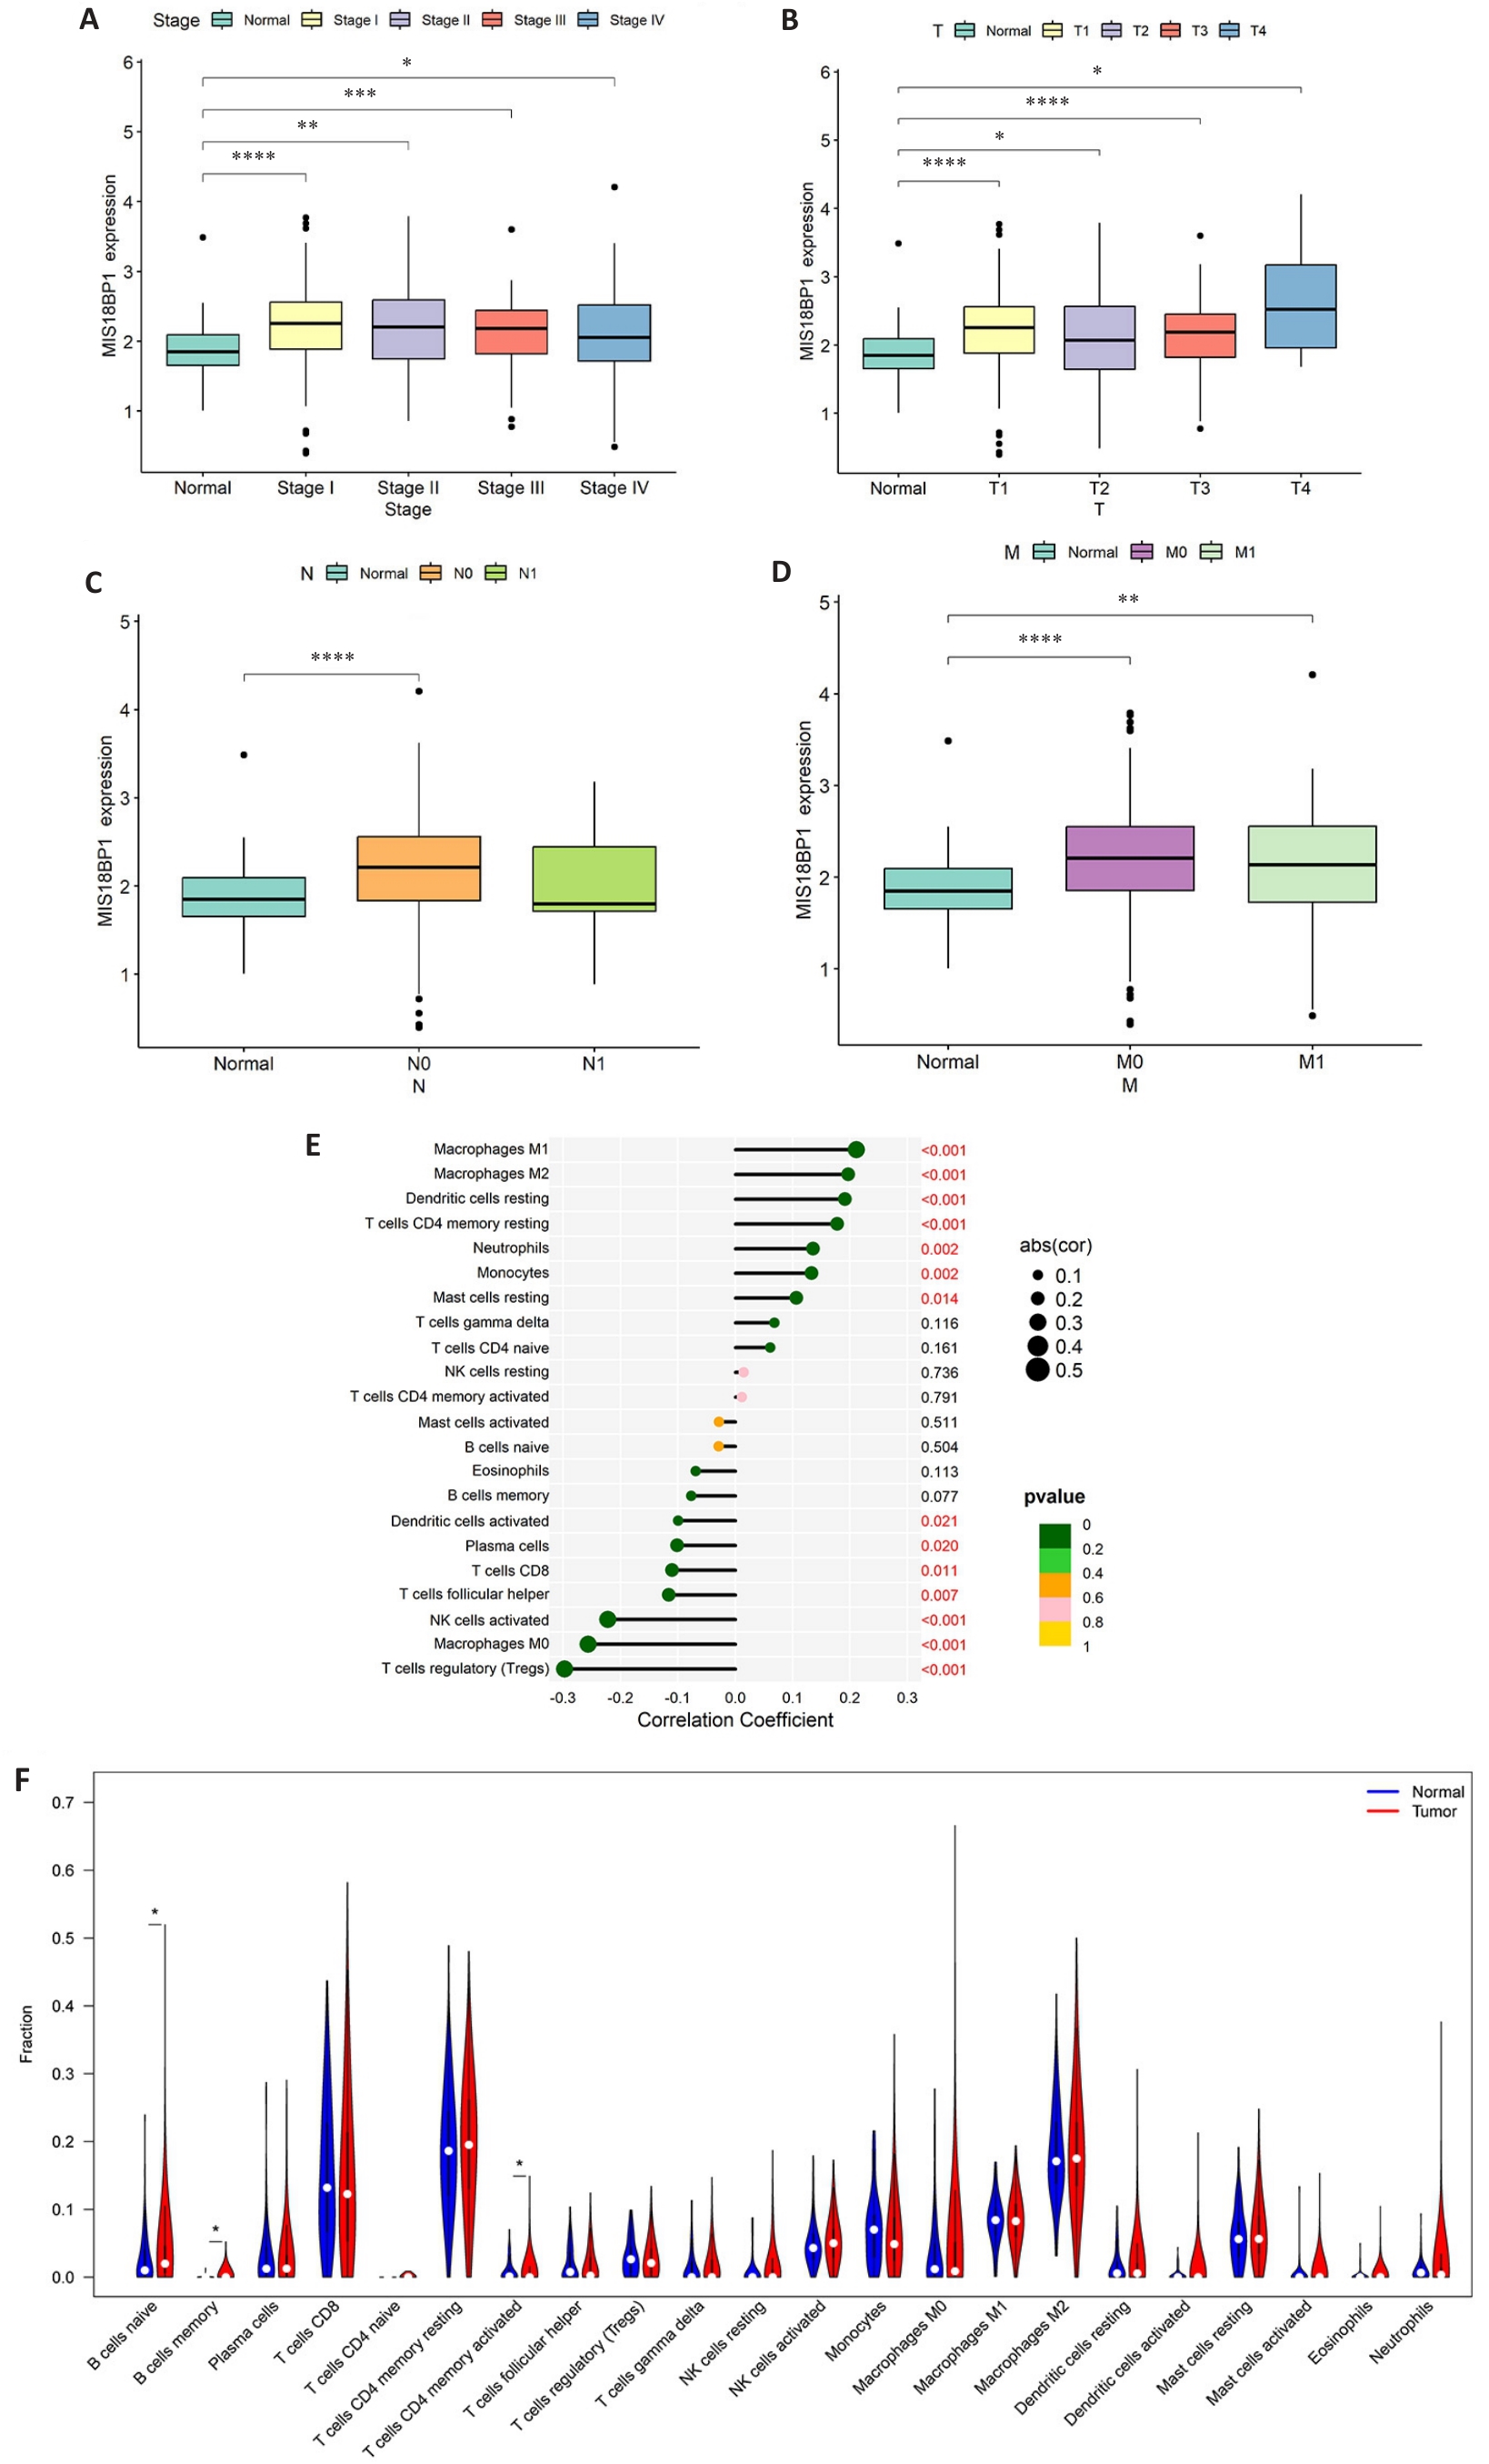
Fig.3 Correlation of MIS18BP1 expression level with clinical pathological features and immune infiltration in KIRC. A: Relationship between MIS18BP1 expression and T stage. B: Relationship between MIS18BP1 expression and N stage. C: Relationship between MIS18BP1 expression and M stage. D: Relationship between MIS18BP1 expression and grade. *P<0.05, **P<0.01, ***P<0.001, ****P<0.0001. E: Relationship between MIS18BP1 expression and immune cells. F: Differential expression of MIS18BP1 in immune cells. *P<0.05.
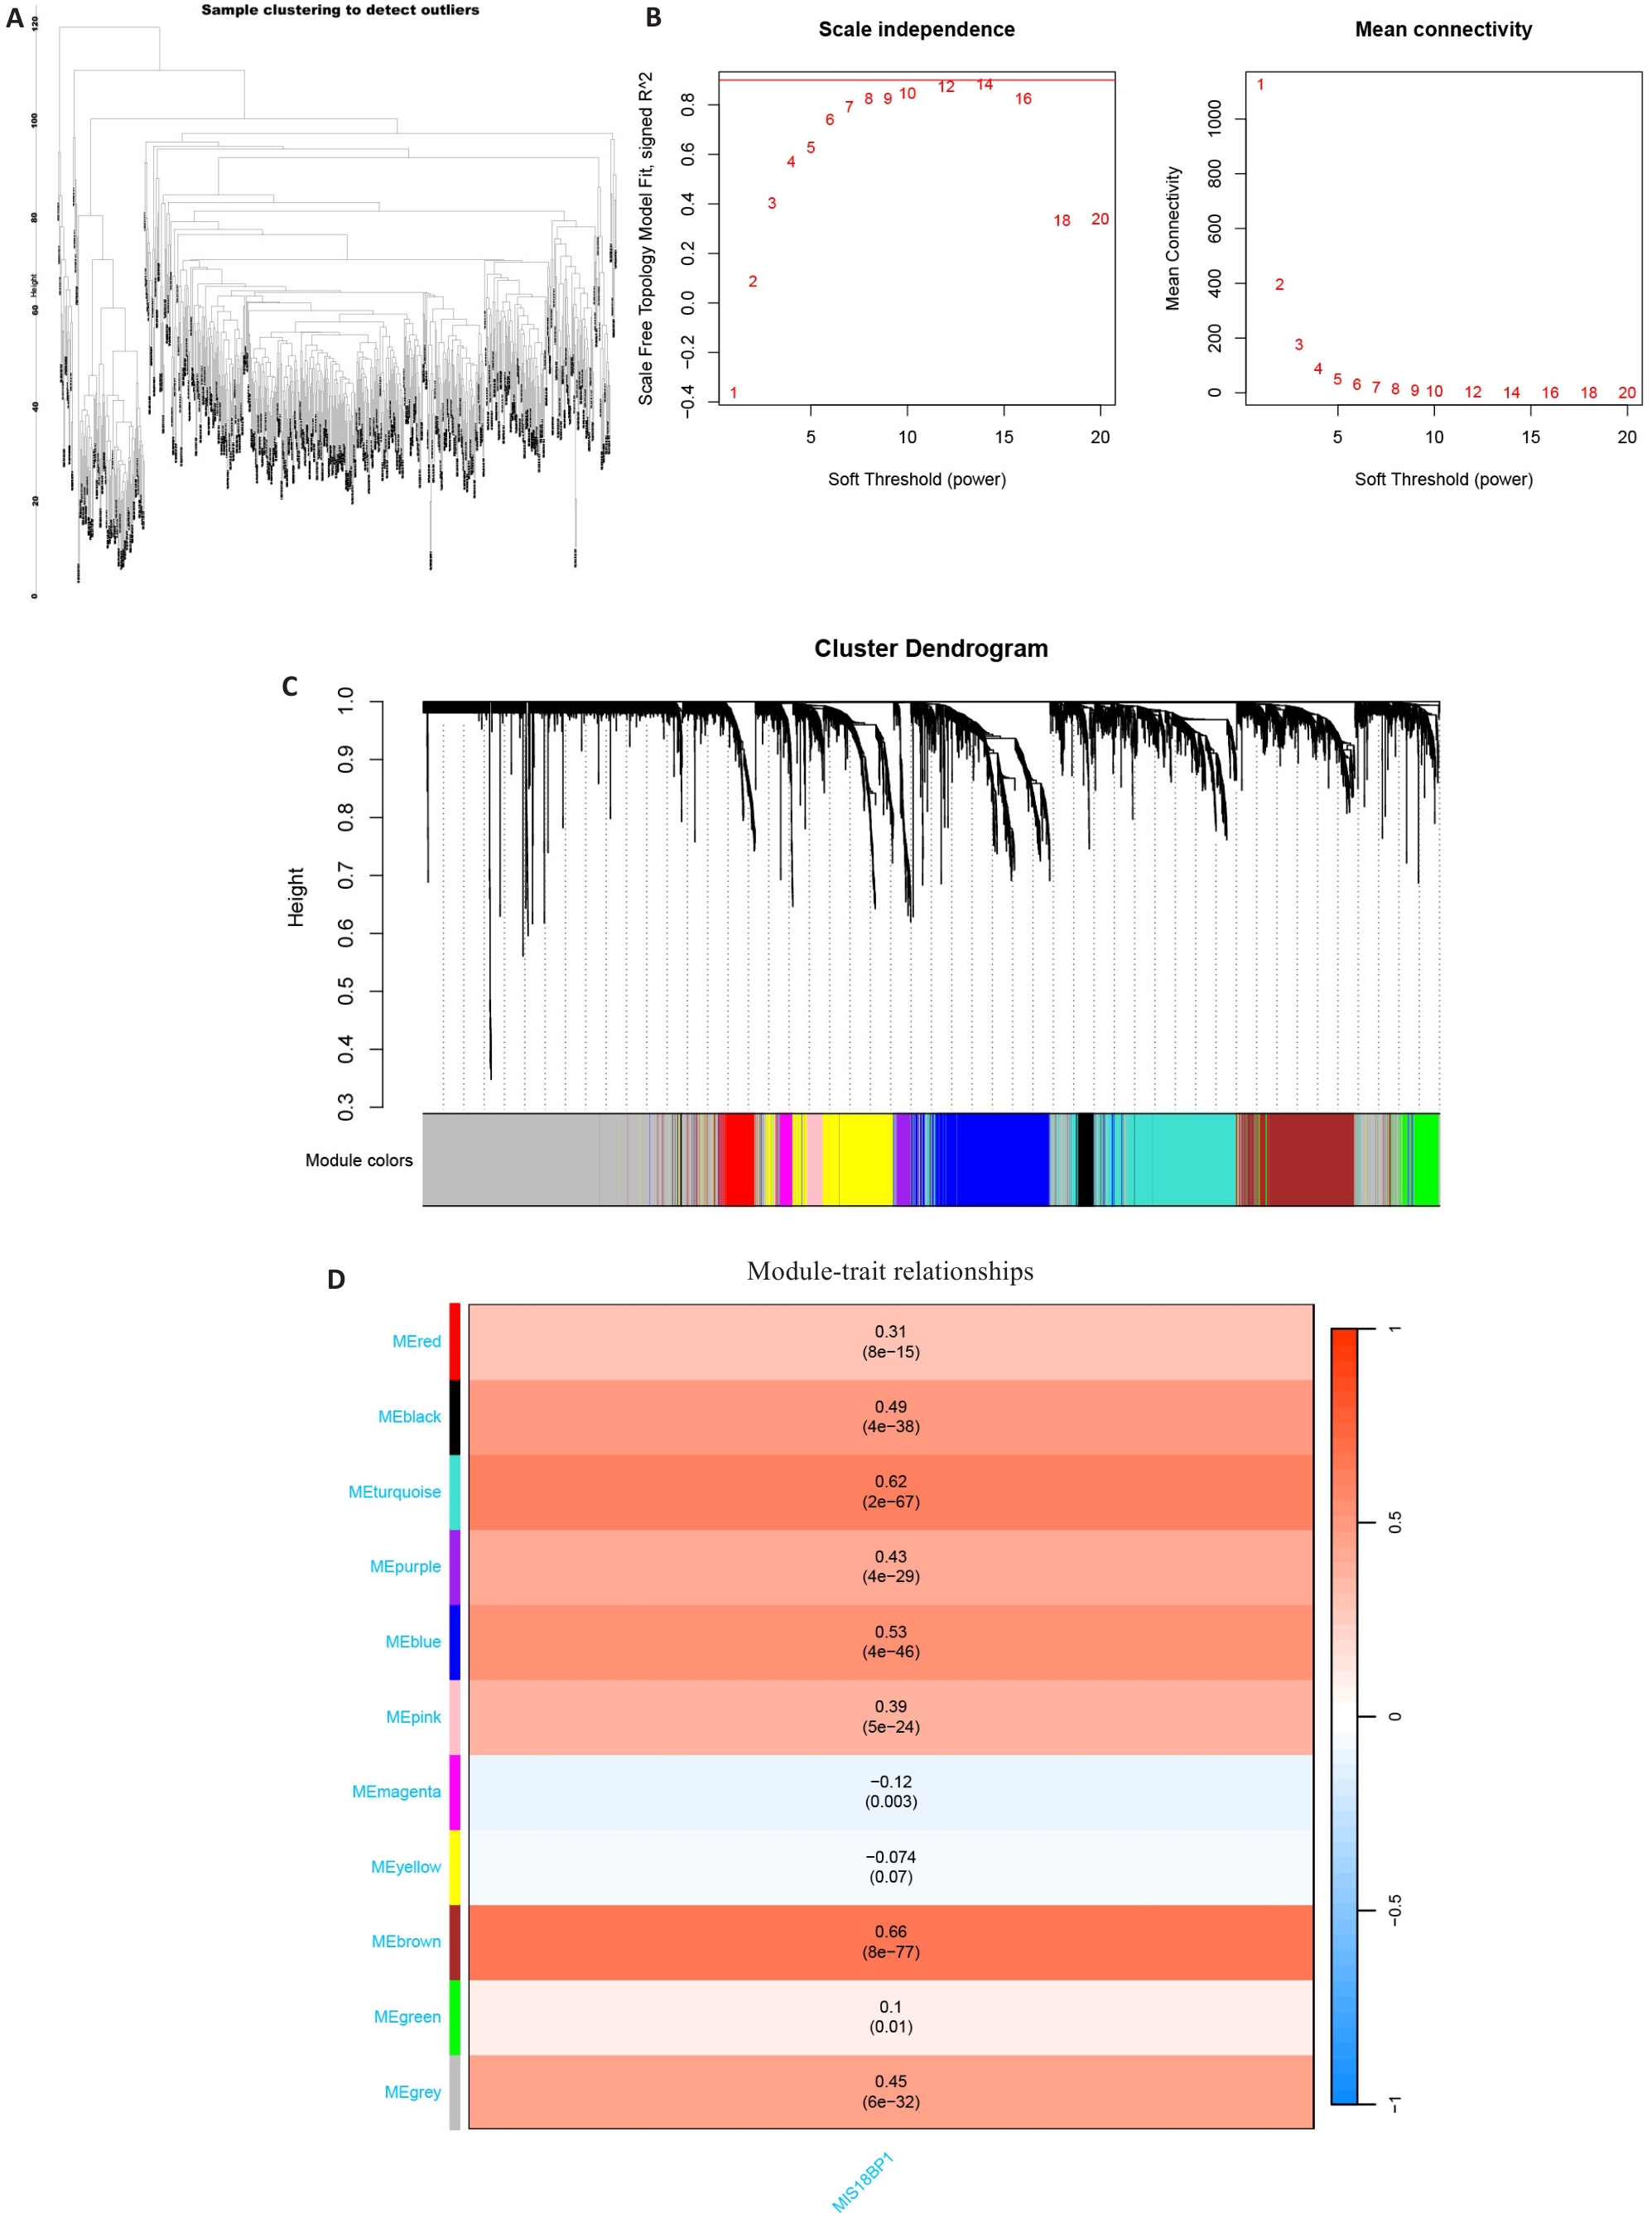
Fig.4 Weighted gene co-expression network analysis (WGCNA) for identifying MIS18BP1-related gene modules. A: Sample clustering dendrogram. B: Determination of the optimal soft threshold (left: scale independence assessment; right: average connectivity analysis), with the red reference line indicating R²=0.9. C: Gene clustering dendrogram (branches represent individual genes, and the colored blocks at the bottom indicate co-expression modules). D: Module-trait association heatmap (colored blocks represent co-expression modules, red and blue indicate positive and negative correlations with correlation coefficients and P-value annotations).
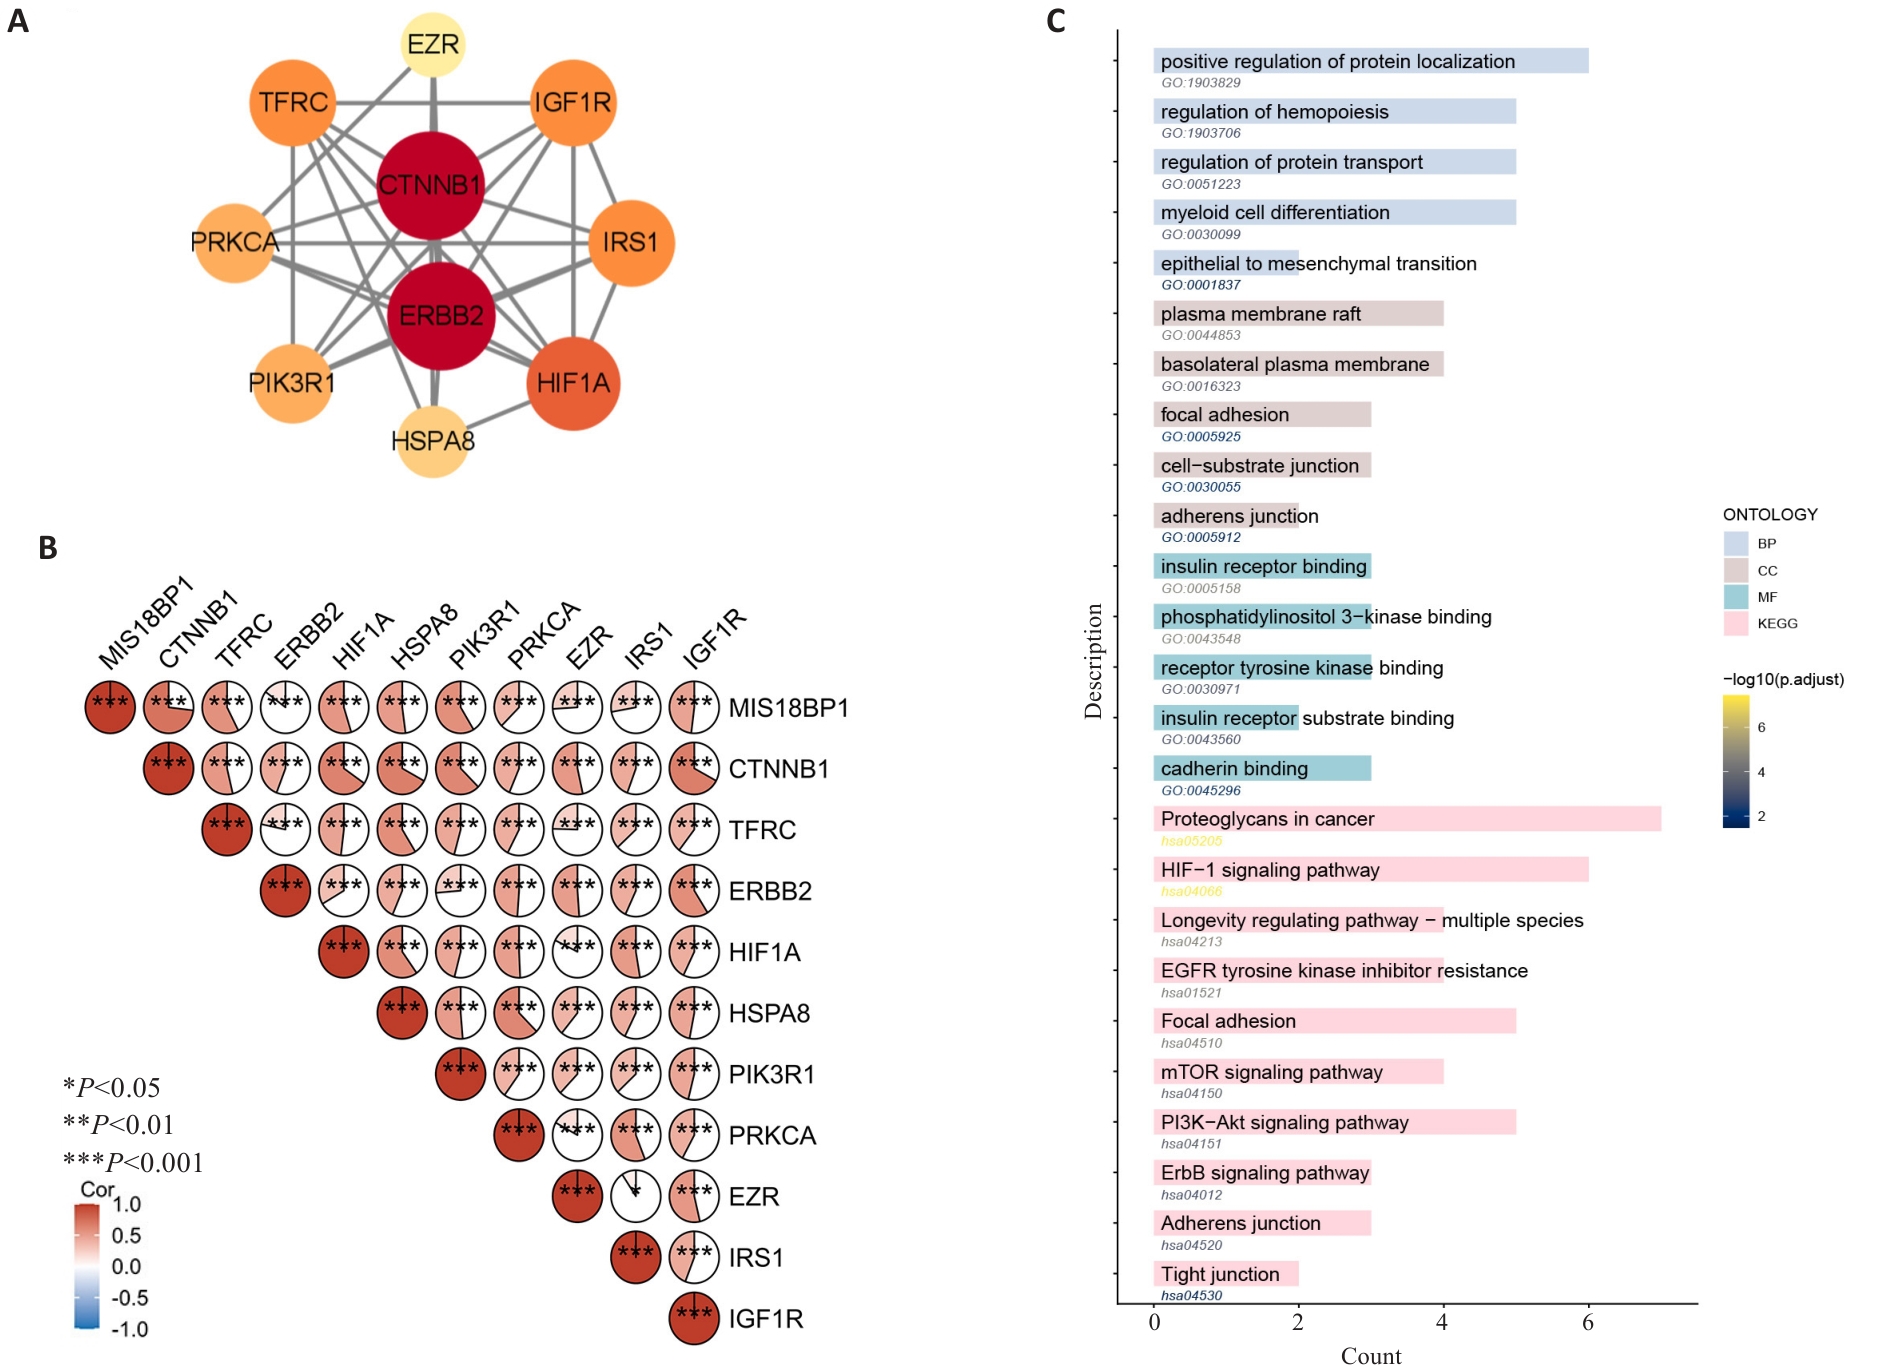
Fig.5 Screening of MIS18BP1-related genes and their GO/KEGG analysis. A: Screening key genes related to MIS18BP1 based on the PPI network. Node size is proportional to degree centrality, and node color intensity is proportional to betweenness centrality (dark red indicates high betweenness). B: Correlation analysis between key genes and MIS18BP1 expression. *P<0.05, ***P<0.001. C: GO and KEGG enrichment analysis of key genes.
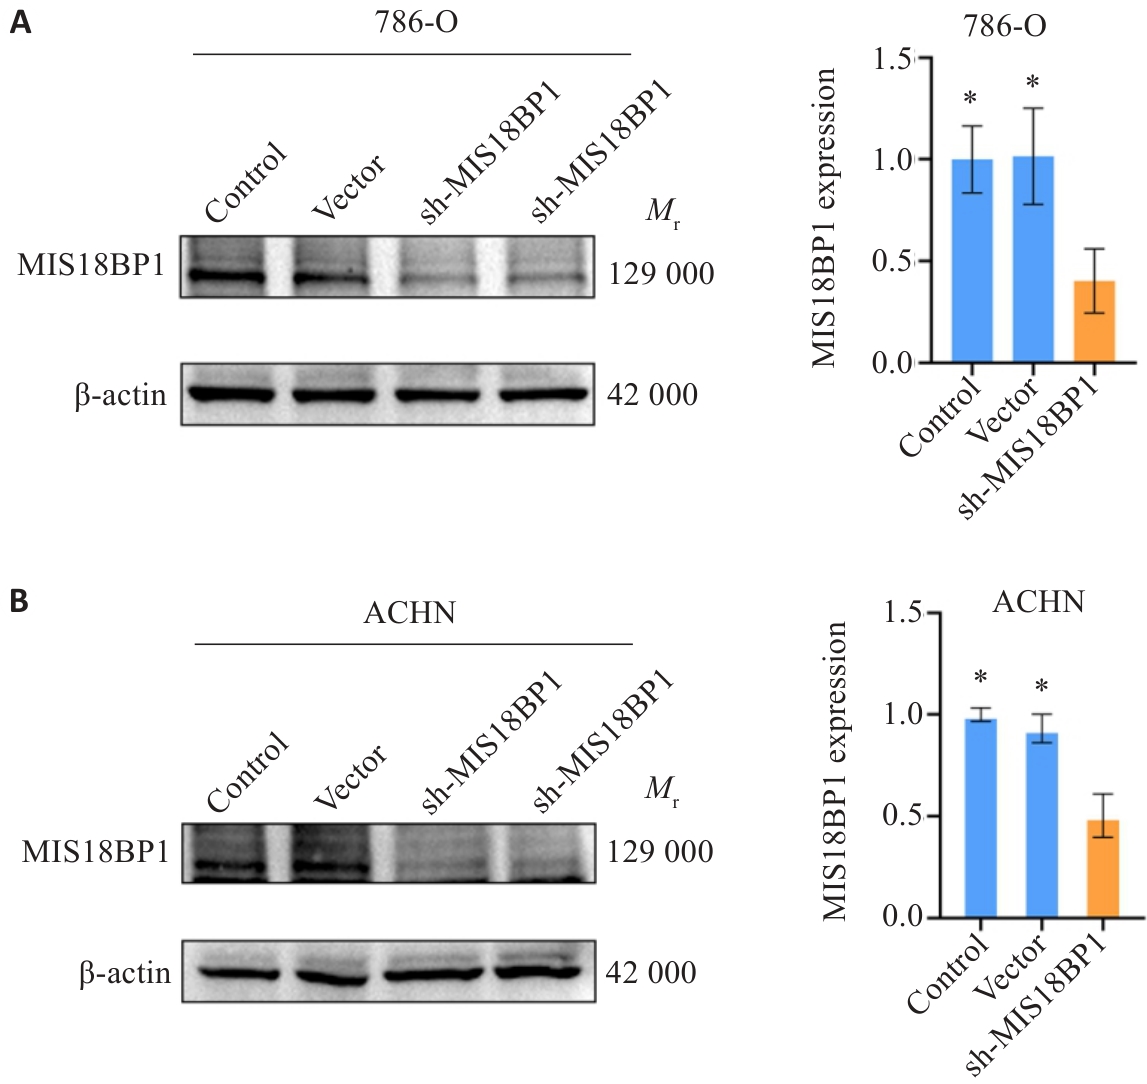
Fig.6 Knockdown of MIS18BP1 in renal cancer cells. A: Western blotting for detection of MIS18BP1 protein expression in 786-O cell line. B: Western blotting for detection of MIS18BP1 protein expression in ACHN cell line. *P<0.05 vs sh-MIS18BP1.
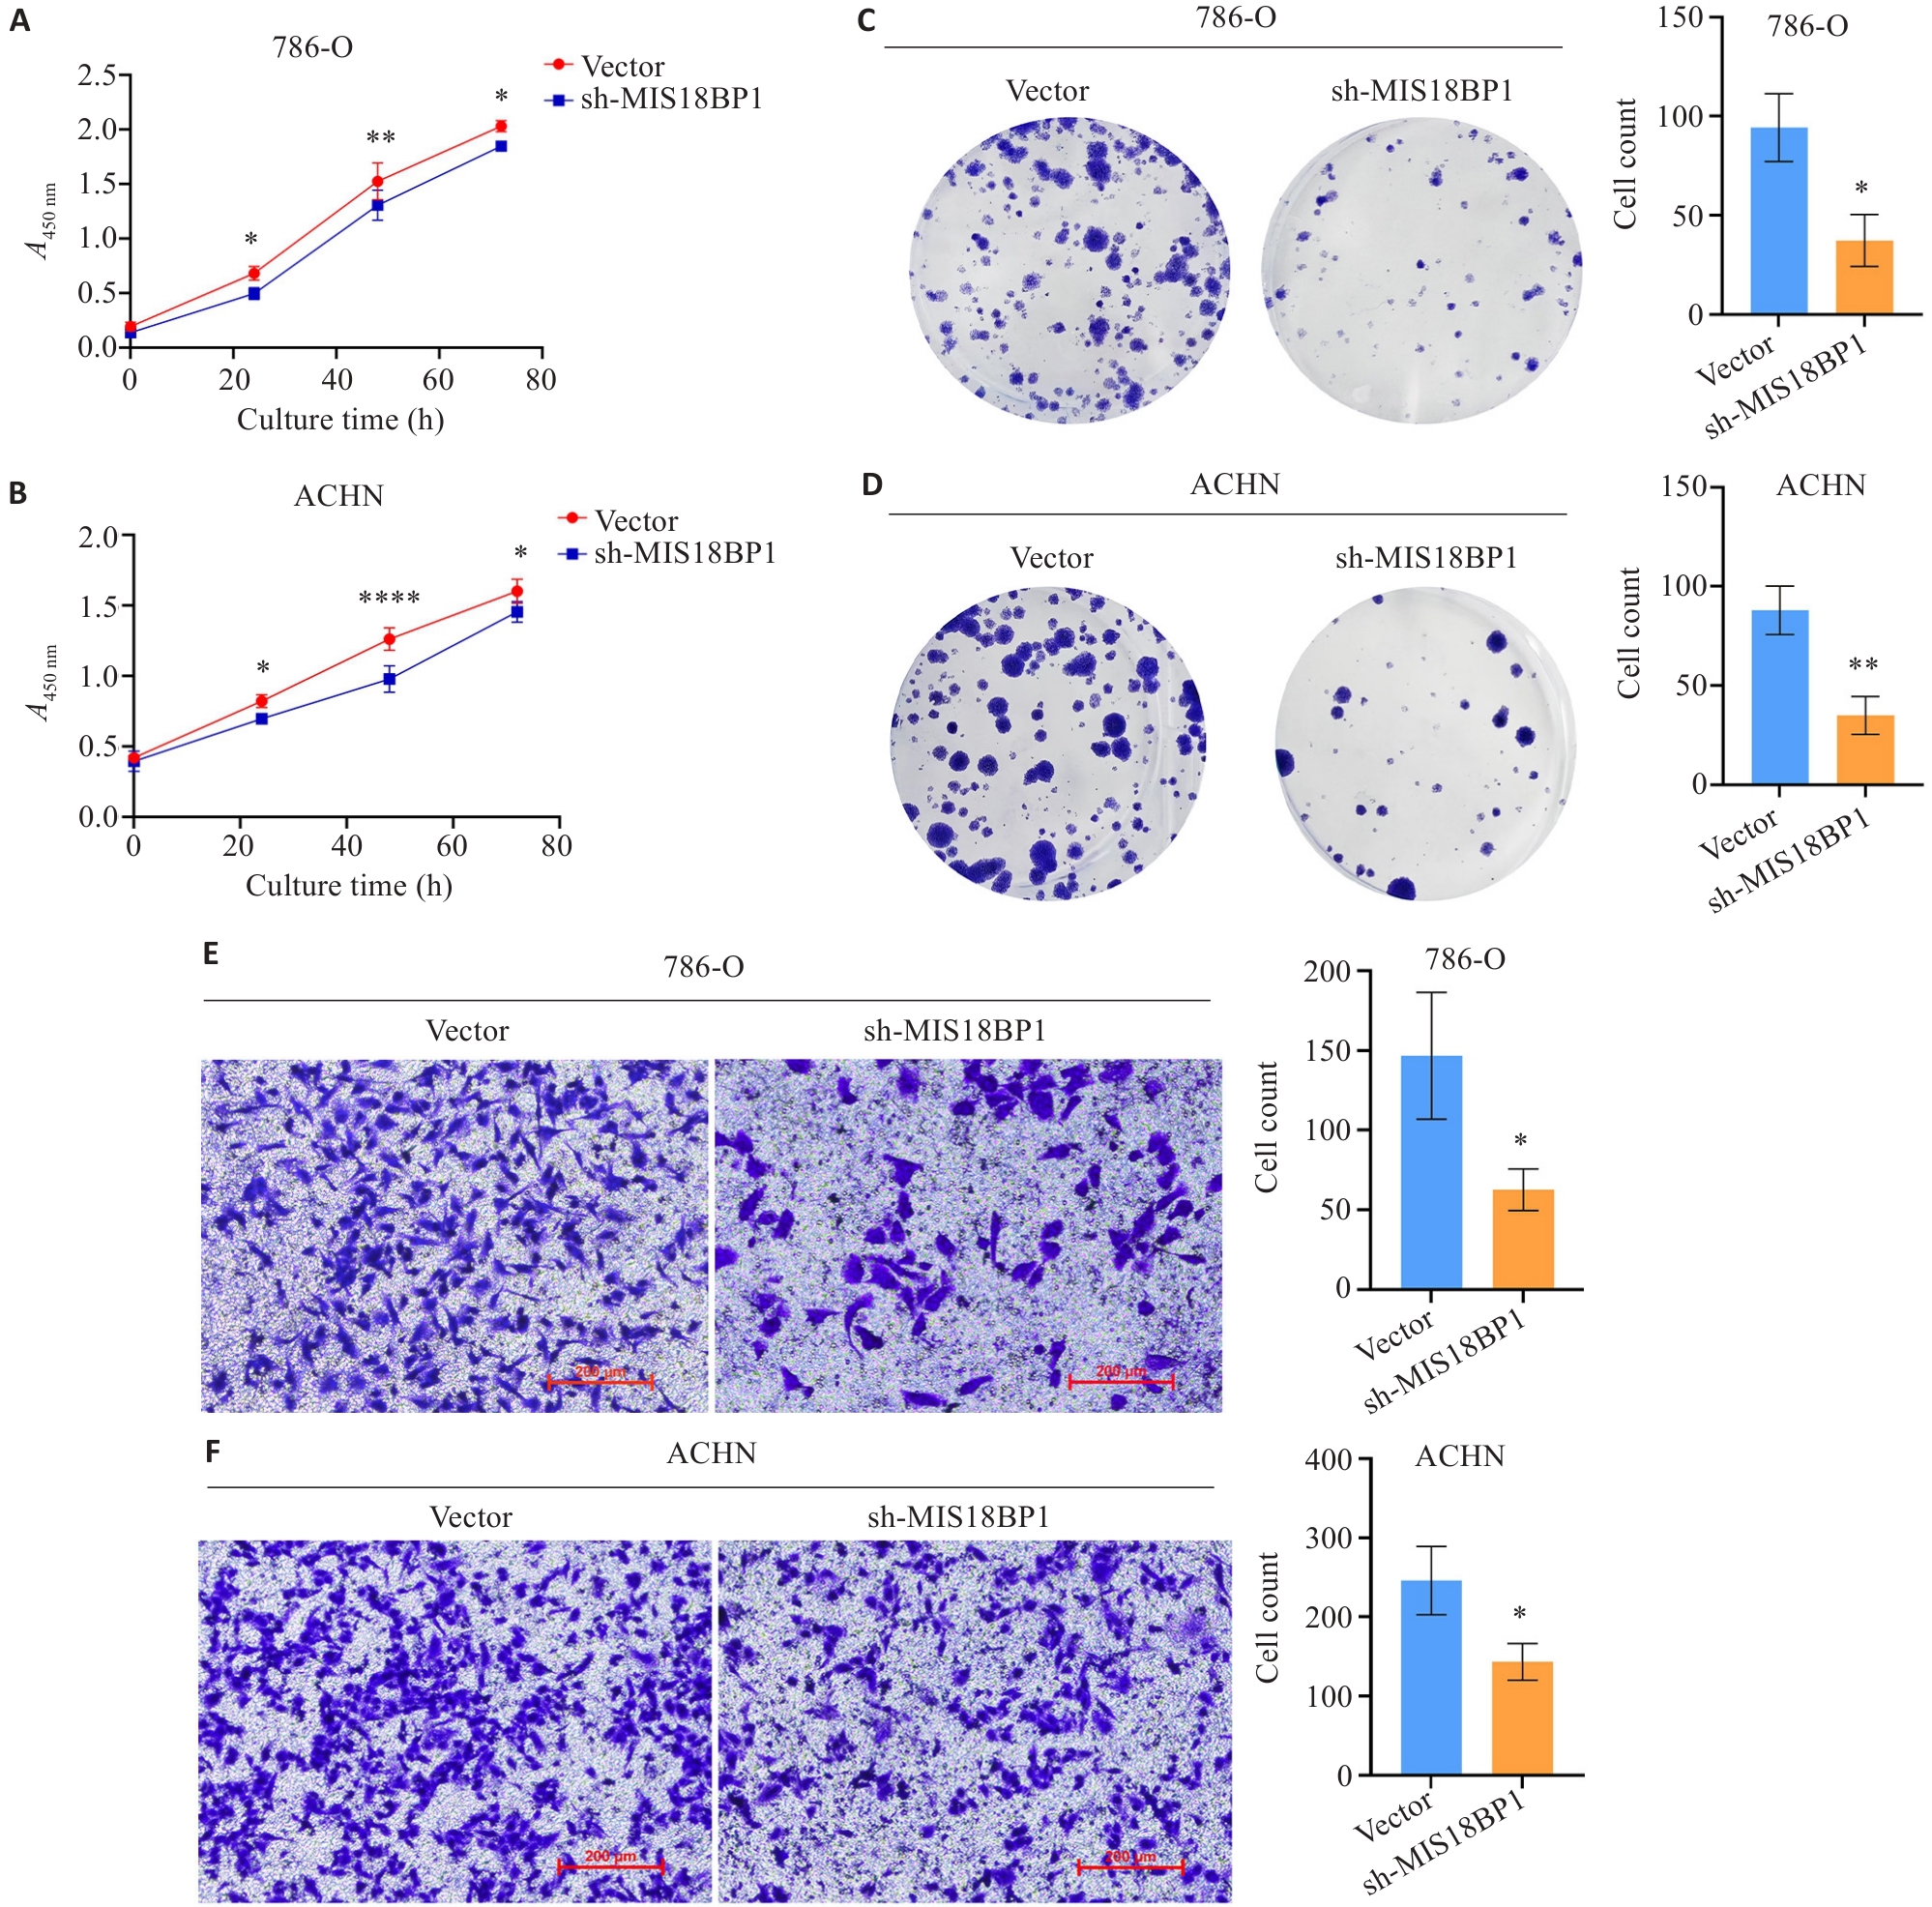
Fig.7 Knocking down MIS18BP1 inhibits proliferation of renal cancer cells. A, C, E: Knockdown of MIS18BP1 significantly inhibits proliferation of 786-O cells (Scale bar=200 μm). B, D, F: Knockdown of MIS18BP1 significantly inhibits proliferation of ACHN cells (Scale bar=200 μm). *P<0.05, **P<0.01, ****P<0.0001 vs Vector.
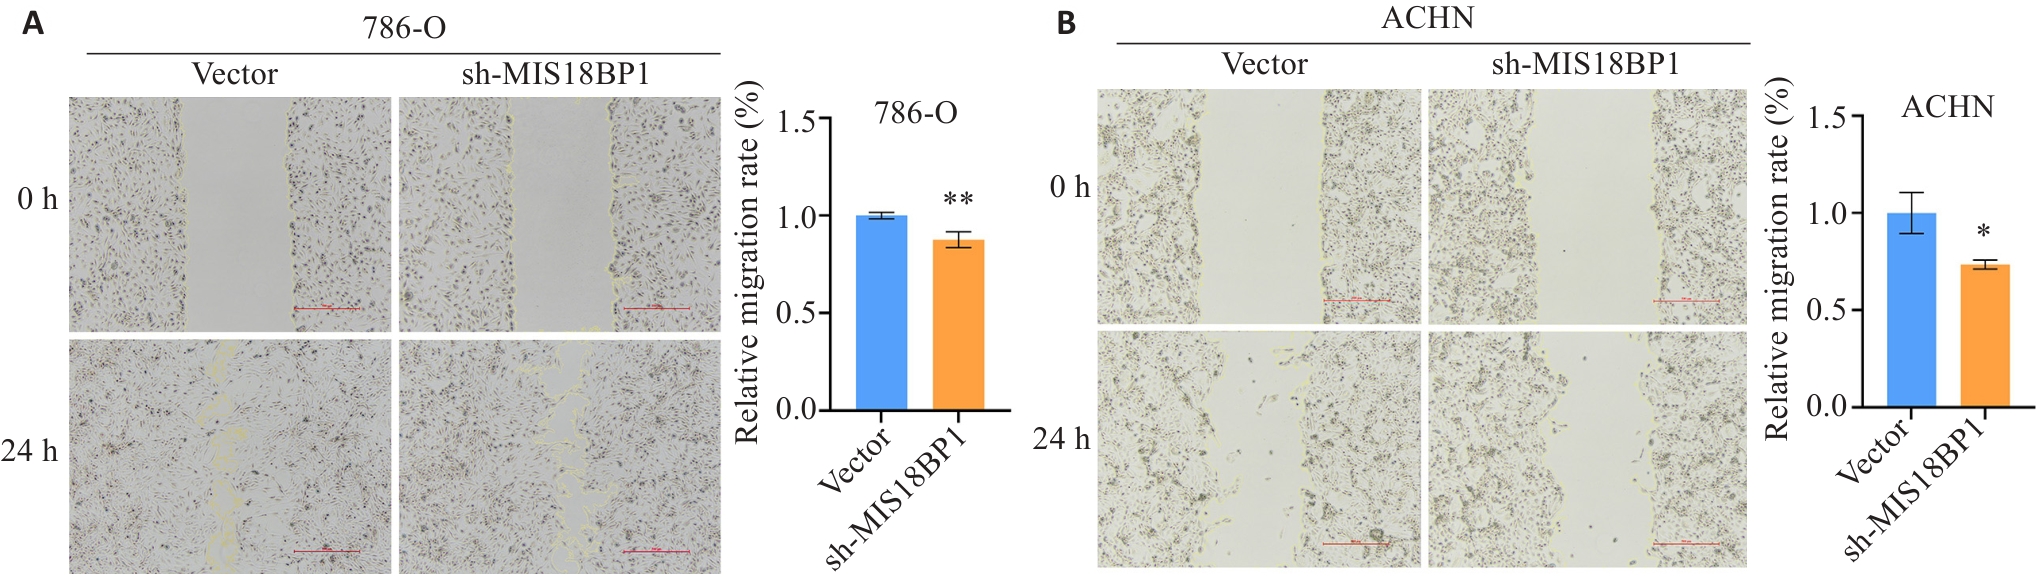
Fig.8 Knocking down MIS18BP1 inhibits migration ability of renal cancer cells. A: Knocking down MIS18BP1 in inhibits migration ability of 786-O cells (Scale bar=500 μm). B: Knocking down MIS18BP1 inhibits migration ability of ACHN cells (Scale bar=500 μm). *P<0.05, **P<0.01 vs Vector.
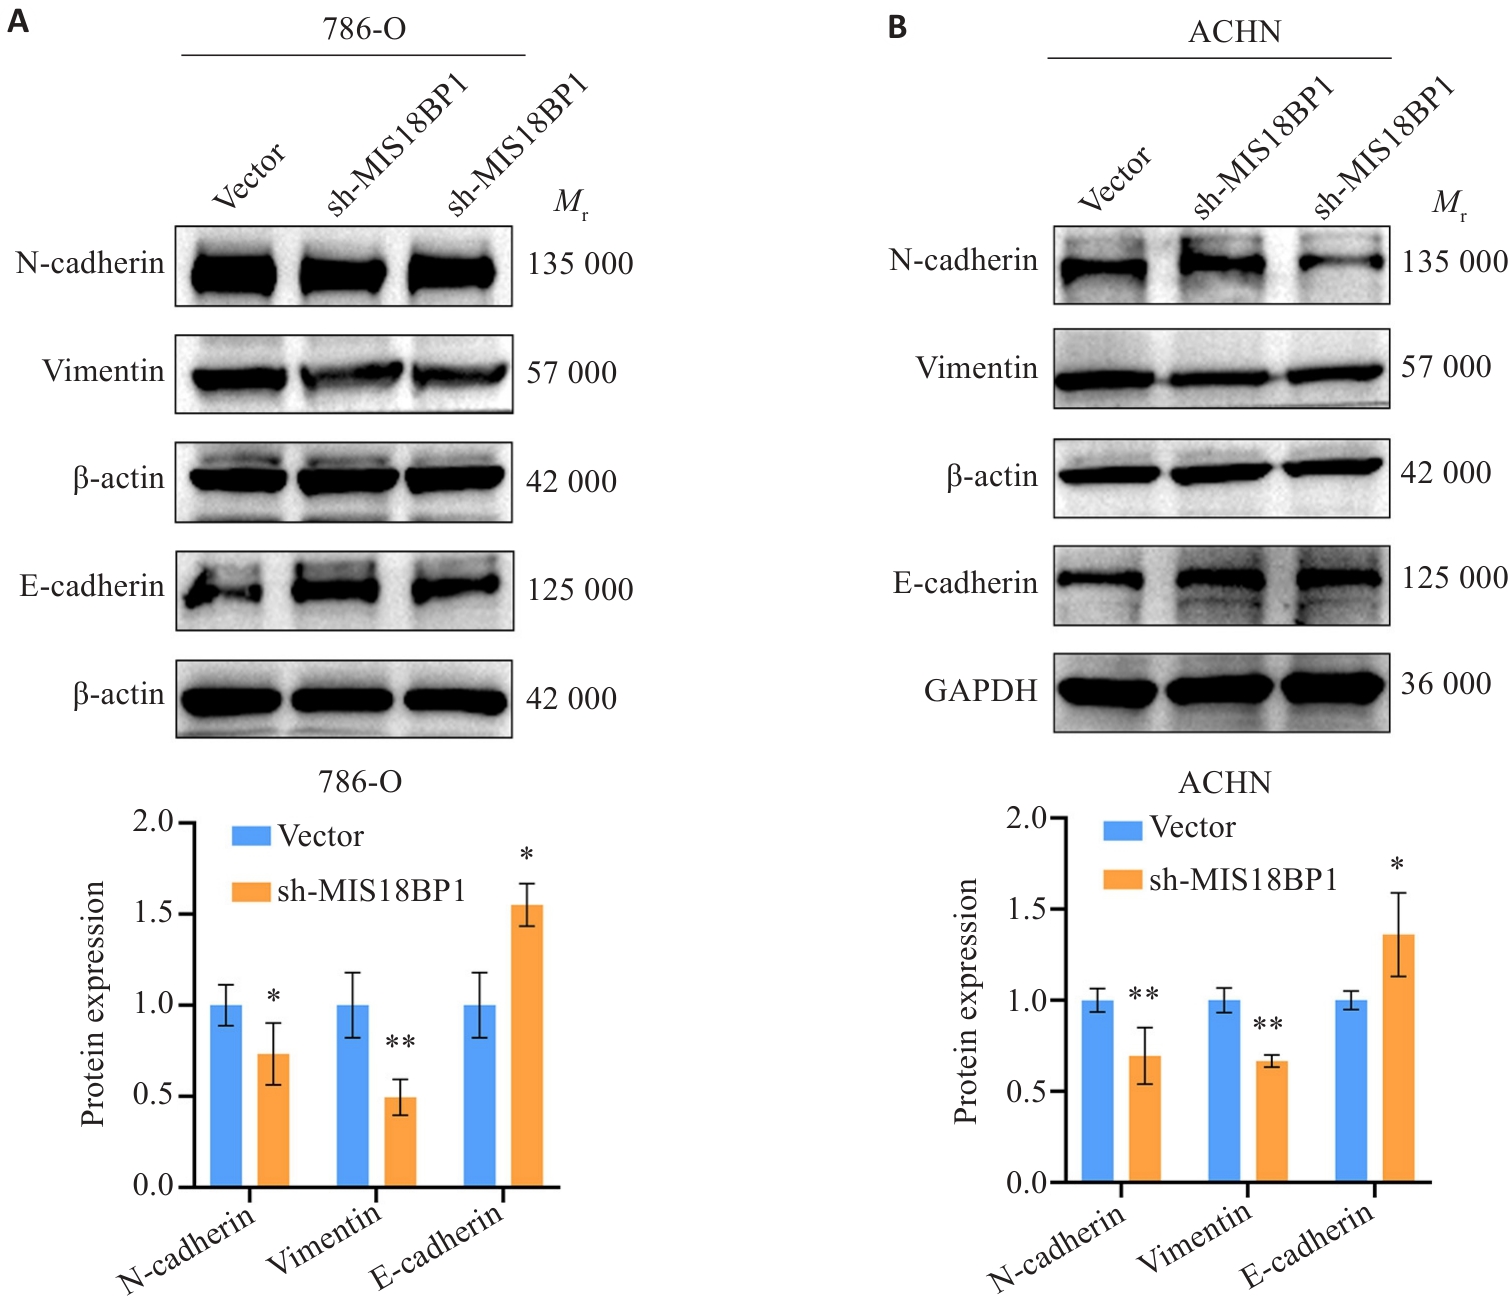
Fig.9 Effect of MIS18BP1 on expression of EMT-related proteins in renal cancer cells. A: MIS18BP1 regulates the expression of EMT-related proteins in 786-O cells. B: MIS18BP1 regulates the expression of EMT-related proteins in ACHN cells. *P<0.05, **P<0.01 vs Vector.
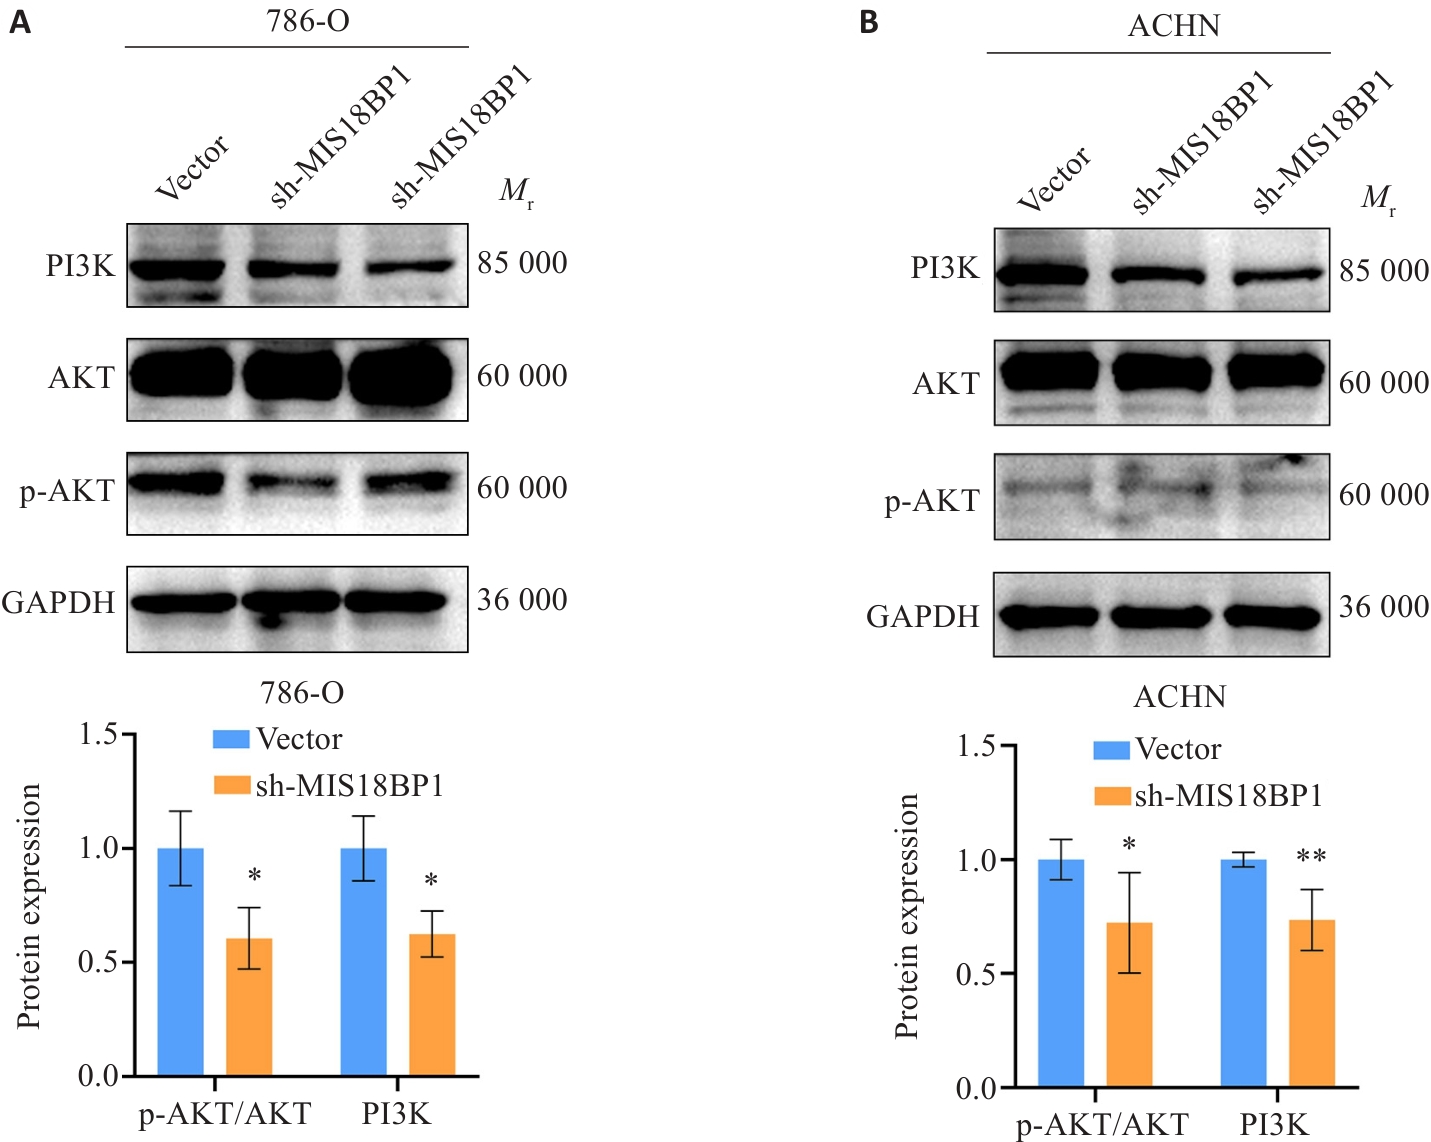
Fig.10 Effect of MIS18BP1 knockdown on the PI3K/AKT signaling pathway. A: MIS18BP1 regulates the expression of key proteins in the PI3K/AKT signaling pathway in 786-O cells. B: MIS18BP1 regulates the expression of key proteins in the PI3K/AKT signaling pathway in ACHN cells. *P<0.05, **P<0.01 vs Vector.
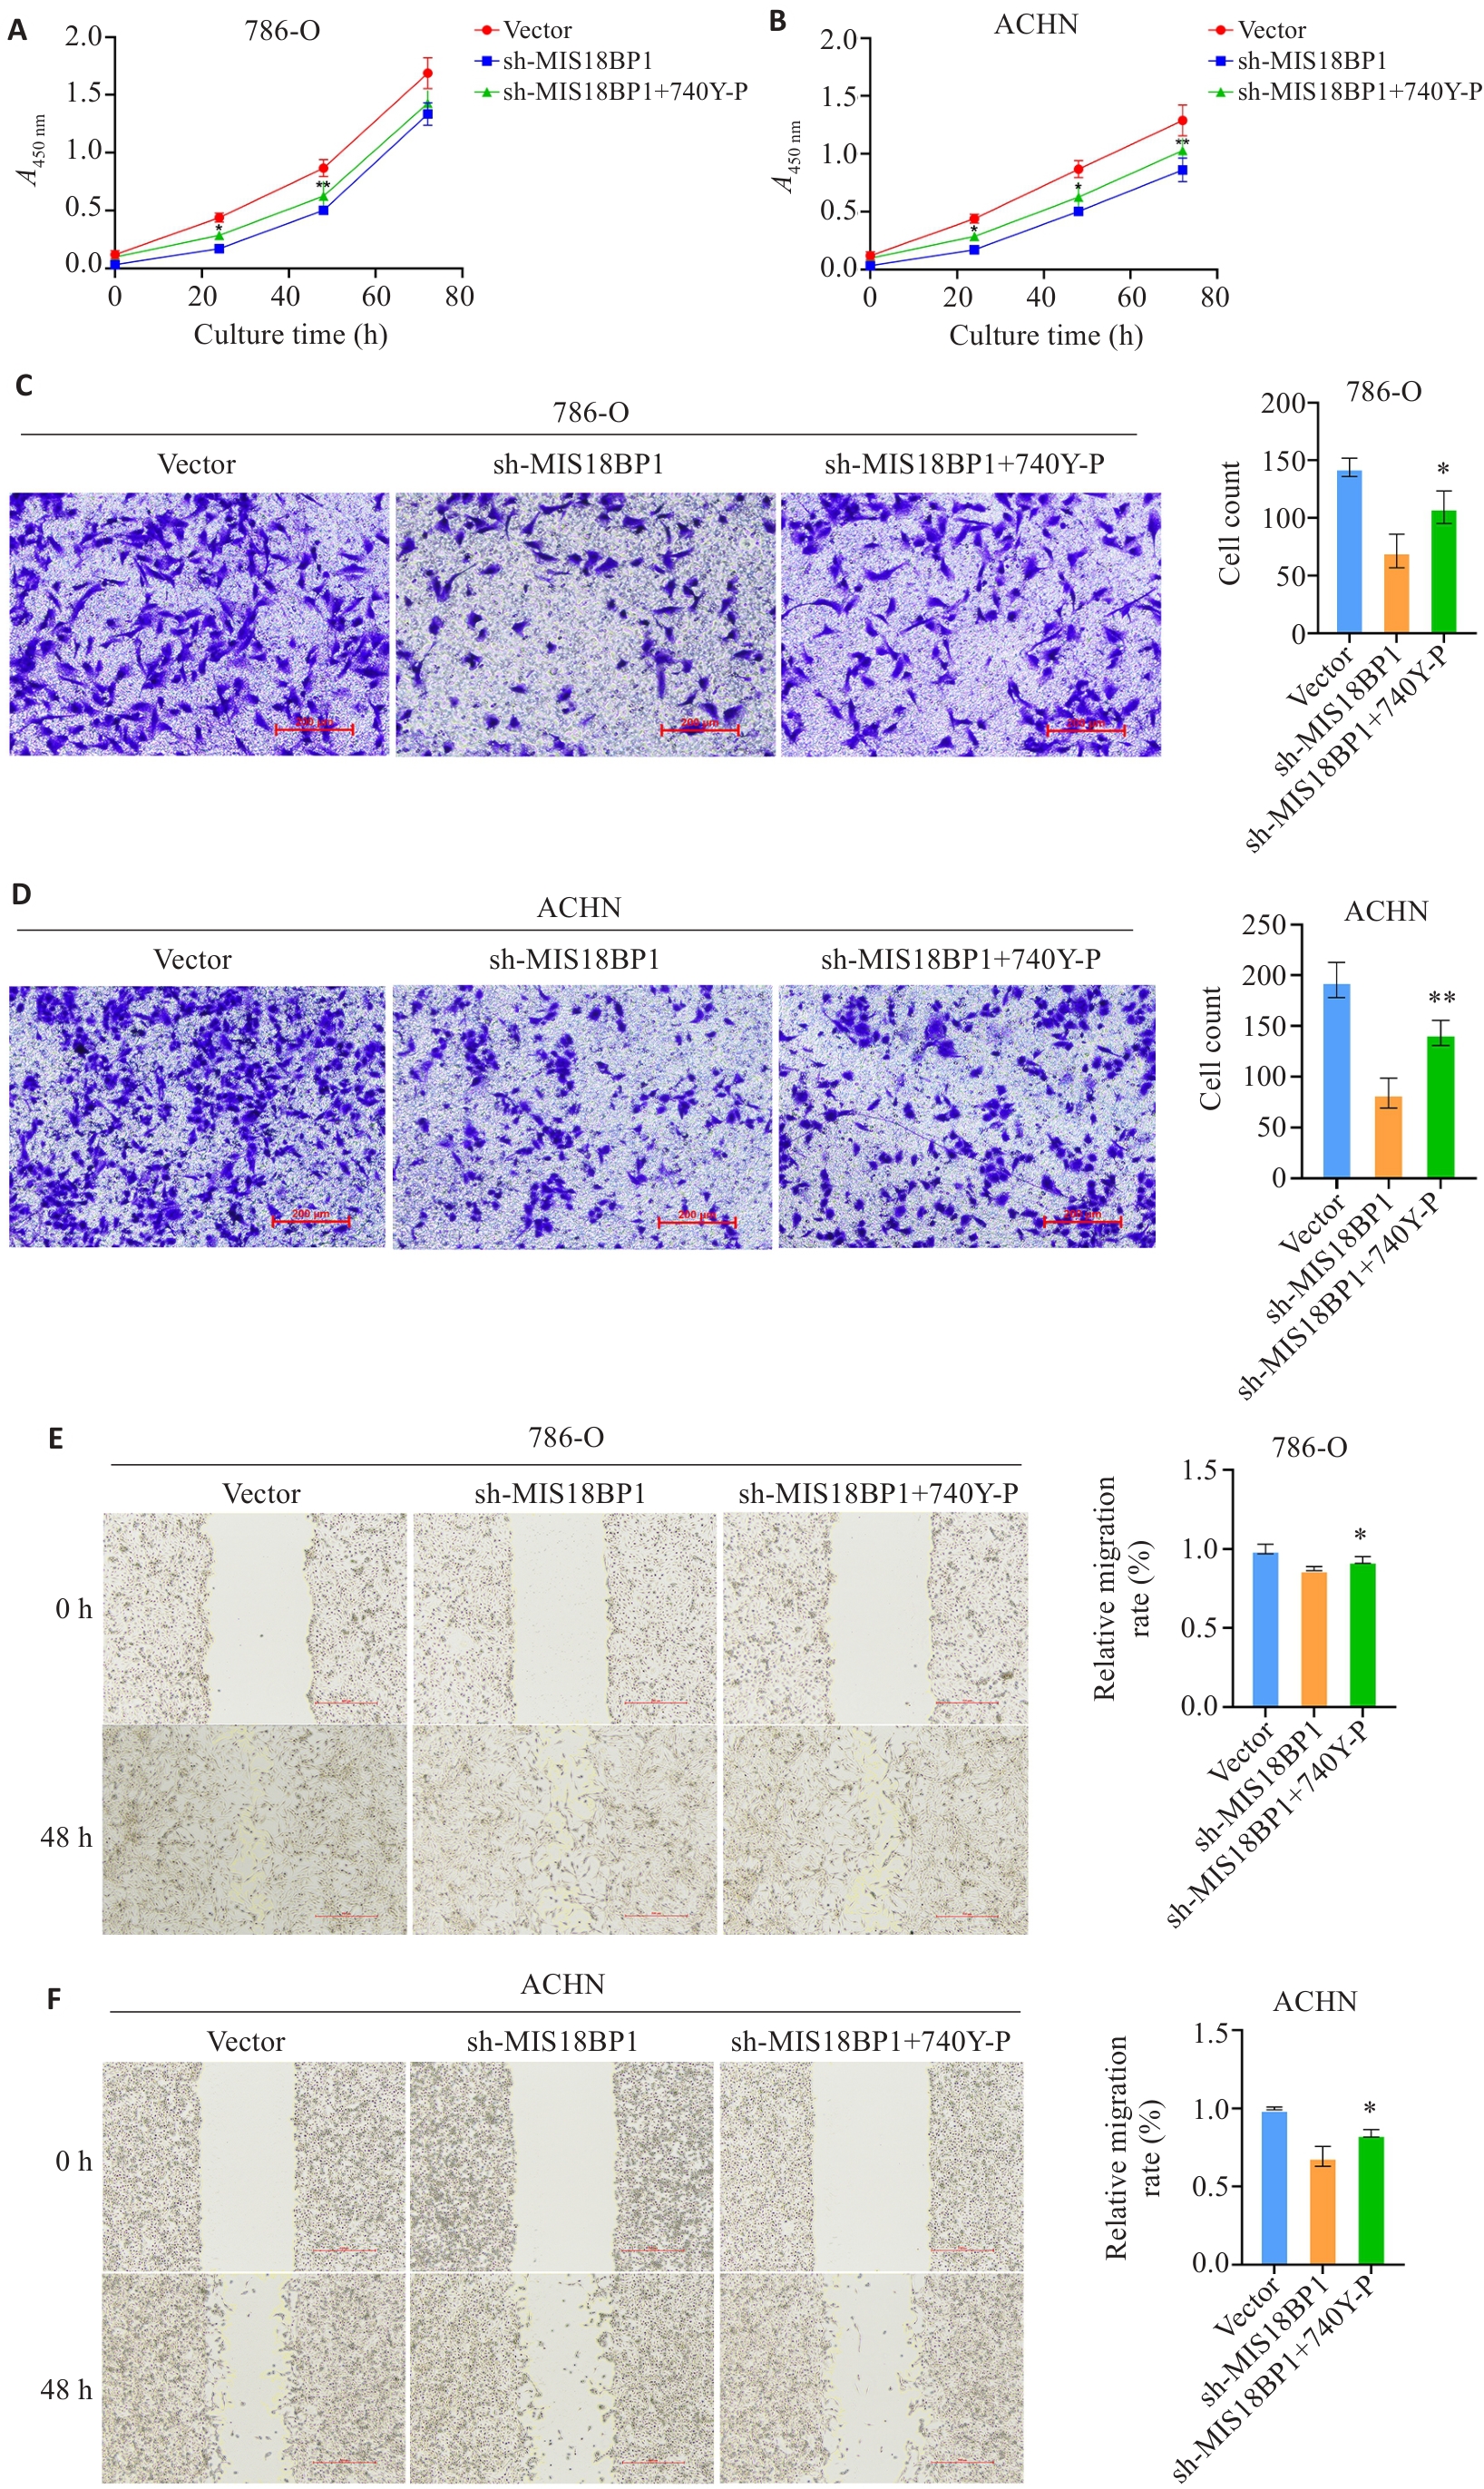
Fig.11 Knockdown of MIS18BP1 inhibits proliferation and migration of 786-O and ACHN cells, which is partially reversed by 740Y P. A, B: CCK-8 assay for assessing proliferation activity of 786-O (A) and ACHN (B) cells. C, D: Wound healing assay for assessing migration ability of 786-O (C) and ACHN (D) cells (Scale bar=200 μm). E, F: Transwell assay for detecting 786-O (E) and ACHN (F) cells passing through the membrane (Scale bar=500 μm). *P<0.05, **P<0.01 vs sh-MIS18BP1 (C-F).
| [1] | Siegel RL, Giaquinto AN, Jemal A. Cancer statistics, 2024[J]. CA A Cancer J Clin, 2024, 74(1): 12-49. doi:10.3322/caac.21820 |
| [2] | Moch H, Amin MB, Berney DM, et al. The 2022 World Health Organization classification of tumours of the urinary system and male genital organs: part A: renal, penile, and testicular tumours[J]. Eur Urol, 2022, 82(5): 458-68. doi:10.1016/j.eururo.2022.06.016 |
| [3] | Hsieh JJ, Purdue MP, Signoretti S, et al. Renal cell carcinoma[J]. Nat Rev Dis Primers, 2017, 3: 17009. doi:10.1016/j.celrep.2017.02.074 |
| [4] | Ljungberg B, Albiges L, Bedke J, et al. EAU Guidelines on Renal Cell Carcinoma: The 2023 Update[J]. Eur Urol, 2023, 119-53. |
| [5] | Thamkachy R, Medina-Pritchard B, Park SH, et al. Structural basis for Mis18 complex assembly and its implications for centromere maintenance[J]. EMBO Rep, 2024, 25(8): 3348-72. doi:10.1038/s44319-024-00183-w |
| [6] | Fujita Y, Hayashi T, Kiyomitsu T, et al. Priming of centromere for CENP-a recruitment by human hMis18α, hMis18β, and M18BP1[J]. Dev Cell, 2007, 12(1): 17-30. doi:10.1016/j.devcel.2006.11.002 |
| [7] | McKinley KL, Cheeseman IM. The molecular basis for centromere identity and function[J]. Nat Rev Mol Cell Biol, 2016, 17(1): 16-29. doi:10.1038/nrm.2015.5 |
| [8] | Kixmoeller K, Allu PK, Black BE. The centromere comes into focus: from CENP-a nucleosomes to kinetochore connections with the spindle[J]. Open Biol, 2020, 10(6): 200051. doi:10.1098/rsob.200051 |
| [9] | Stellfox ME, Nardi IK, Knippler CM, et al. Differential binding partners of the Mis18α/β YIPPEE domains regulate Mis18 complex recruitment to centromeres[J]. Cell Rep, 2016, 15(10): 2127-35. doi:10.1016/j.celrep.2016.05.004 |
| [10] | Ohzeki JI, Shono N, Otake K, et al. KAT7/HBO1/MYST2 regulates CENP-a chromatin assembly by antagonizing Suv39h1-mediated centromere inactivation[J]. Dev Cell, 2016, 37(5): 413-27. doi:10.1016/j.devcel.2016.05.006 |
| [11] | Sun SY, Hu XT, Yu XF, et al. Nuclear translocation of ATG5 induces DNA mismatch repair deficiency (MMR-D)/microsatellite instability (MSI) via interacting with Mis18α in colorectal cancer[J]. Br J Pharmacol, 2021, 178(11): 2351-69. doi:10.1111/bph.15422 |
| [12] | Cao WJ, Tan XY, Li XZ, et al. MIS18BP1 promotes bladder cancer cell proliferation and growth via inactivating P53 signaling pathway[J]. Med Oncol, 2025, 42(5): 156. doi:10.1007/s12032-025-02704-6 |
| [13] | Lamouille S, Xu J, Derynck R. Molecular mechanisms of epithelial–mesenchymal transition[J]. Nat Rev Mol Cell Biol, 2014, 15(3): 178-96. doi:10.1038/nrm3758 |
| [14] | Thiery JP, Acloque H, Huang RYJ, et al. Epithelial-mesenchymal transitions in development and disease[J]. Cell, 2009, 139(5): 871-90. doi:10.1016/j.cell.2009.11.007 |
| [15] | Hemmings BA, Restuccia DF. PI3K-PKB/Akt pathway[J]. Cold Spring Harb Perspect Biol, 2012, 4(9): a011189. doi:10.1101/cshperspect.a011189 |
| [16] | Larue L, Bellacosa A. Epithelial–mesenchymal transition in development and cancer: role of phosphatidylinositol 3' kinase/AKT pathways[J]. Oncogene, 2005, 24(50): 7443-54. doi:10.1038/sj.onc.1209091 |
| [17] | Li TW, Fan JY, Wang BB, et al. TIMER: a web server for comprehensive analysis of tumor-infiltrating immune cells[J]. Cancer Res, 2017, 77(21): e108-10. doi:10.1158/0008-5472.can-17-0307 |
| [18] | Ahmed MM, Tazyeen S, Ali R, et al. Network centrality approaches used to uncover and classify most influential nodes with their related miRNAs in cardiovascular diseases[J]. Gene Rep, 2022, 27: 101555. doi:10.1016/j.genrep.2022.101555 |
| [19] | Muetze T, Goenawan IH, Wiencko HL, et al. Contextual Hub Analysis Tool (CHAT): a Cytoscape app for identifying contextually relevant hubs in biological networks[J]. F1000Research, 2016, 5: 1745. doi:10.12688/f1000research.9118.1 |
| [20] | Bray F, Laversanne M, Sung H, et al. Global cancer statistics 2022: GLOBOCAN estimates of incidence and mortality worldwide for 36 cancers in 185 countries[J]. CA A Cancer J Clin, 2024, 74(3): 229-63. doi:10.3322/caac.21834 |
| [21] | 张永贞, 杨国庆, 张思维, 等. 中国2009年肾及泌尿系统其他癌发病和死亡分析[J]. 中国肿瘤, 2013, 22(5): 333-7. |
| [22] | Chen YW, Wang LK, Panian J, et al. Treatment landscape of renal cell carcinoma[J]. Curr Treat Options Oncol, 2023, 24(12): 1889-916. doi:10.1007/s11864-023-01161-5 |
| [23] | Rini BI, Plimack ER, Stus V, et al. Pembrolizumab plus axitinib versus sunitinib for advanced renal-cell carcinoma[J]. N Engl J Med, 2019, 380(12): 1116-27. doi:10.1056/nejmoa1816714 |
| [24] | Pal SK, Albiges L, Tomczak P, et al. Atezolizumab plus cabozantinib versus cabozantinib monotherapy for patients with renal cell carcinoma after progression with previous immune checkpoint inhibitor treatment (CONTACT-03): a multicentre, randomised, open-label, phase 3 trial[J]. Lancet, 2023, 402(10397): 185-95. doi:10.1016/s0140-6736(23)00922-4 |
| [25] | McKay RR, McGregor BA, Xie WL, et al. Optimized management of nivolumab and ipilimumab in advanced renal cell carcinoma: a response-based phase II study (OMNIVORE)[J]. J Clin Oncol, 2020, 38(36): 4240-8. doi:10.1200/jco.20.02295 |
| [26] | Moree B, Meyer CB, Fuller CJ, et al. CENP-C recruits M18BP1 to centromeres to promote CENP-a chromatin assembly[J]. J Cell Biol, 2011, 194(6): 855-71. doi:10.1083/jcb.201106079 |
| [27] | Stellfox ME, Bailey AO, Foltz DR. Putting CENP-a in its place[J]. Cell Mol Life Sci, 2013, 70(3): 387-406. doi:10.1007/s00018-012-1048-8 |
| [28] | Musacchio A, Desai A. A molecular view of kinetochore assembly and function[J]. Biology, 2017, 6(1): 5. doi:10.3390/biology6010005 |
| [29] | Tao LS, Xie W, Du Y, et al. Activation of the PI3K/AKT pathway by EDIL3 induces EMT and promotes tumor progression in clear cell renal cell carcinoma[J]. Mol Genet Genom, 2026, 301(1): 47. doi:10.1007/s00438-026-02369-4 |
| [30] | Zhao HN, Wang EM. COL1A1 drives tumor progression in kidney renal clear cell carcinoma by regulating EMT through the PI3K/Akt pathway[J]. Cancer Cell Int, 2025, 25(1): 314. doi:10.1186/s12935-025-03956-y |
| [31] | Wang SJ, Xie DQ, Yue HZ, et al. Phospholipase C beta 2 as a key regulator of tumor progression and epithelial-mesenchymal transition via PI3K/AKT signaling in renal cell carcinoma[J]. Biomedicines, 2025, 13(2): 304. doi:10.3390/biomedicines13020304 |
| [32] | Zhan SZ, Bai XJ, Zhao YQ, et al. TGFBI promotes proliferation and epithelial-mesenchymal transition in renal cell carcinoma through PI3K/AKT/mTOR/HIF-1α pathway[J]. Cancer Cell Int, 2024, 24(1): 265. doi:10.1186/s12935-024-03454-7 |
| [33] | Zhou BP, Deng J, Xia WY, et al. Dual regulation of Snail by GSK-3β-mediated phosphorylation in control of epithelial–mesenchymal transition[J]. Nat Cell Biol, 2004, 6(10): 931-40. doi:10.1038/ncb1173 |
| [34] | Villagrasa P, Díaz VM, Viñas-Castells R, et al. Akt2 interacts with Snail1 in the E-cadherin promoter[J]. Oncogene, 2012, 31(36): 4022-33. doi:10.1038/onc.2011.562 |
| [35] | Yan D, Avtanski D, Saxena NK, et al. Leptin-induced epithelial-mesenchymal transition in breast cancer cells requires β‑catenin activation via Akt/GSK3- and MTA1/Wnt1 protein-dependent pathways[J]. J Biol Chem, 2012, 287(11): 8598-612. doi:10.1074/jbc.m111.322800 |
| [36] | Lamouille S, Derynck R. Cell size and invasion in TGF-beta-induced epithelial to mesenchymal transition is regulated by activation of the mTOR pathway[J]. J Cell Biol, 2007, 178(3): 437-51. doi:10.1083/jcb.200611146 |
| [37] | Yin SS, Liu L, Brobbey C, et al. PRMT5-mediated arginine methylation activates AKT kinase to govern tumorigenesis[J]. Nat Commun, 2021, 12: 3444. doi:10.1038/s41467-021-23833-2 |
| Viewed | ||||||
|
Full text |
|
|||||
|
Abstract |
|
|||||
