Journal of Southern Medical University ›› 2026, Vol. 46 ›› Issue (2): 239-246.doi: 10.12122/j.issn.1673-4254.2026.02.01
Xiaoxiao LIANG1( ), Huilin LUAN1, Pengzhen MA2, Wenzhu DENG1, Jiaxin JIN1, Chenyang QUAN1, Tingting CHEN3, Youcai YANG1, Yingzhen XIE1()
Received:2025-06-10
Online:2026-02-20
Published:2026-03-10
Contact:
Yingzhen XIE
E-mail:lxx13286242364@163.com;xyz_3191@aliyun.com
Xiaoxiao LIANG, Huilin LUAN, Pengzhen MA, Wenzhu DENG, Jiaxin JIN, Chenyang QUAN, Tingting CHEN, Youcai YANG, Yingzhen XIE. Correlation between cardiovascular health score based on eight life factors and prognosis of ischemic stroke and mediating effect of clinical test indicators: a multicenter prospective cohort study[J]. Journal of Southern Medical University, 2026, 46(2): 239-246.
Add to citation manager EndNote|Ris|BibTeX
URL: https://www.j-smu.com/EN/10.12122/j.issn.1673-4254.2026.02.01
| Characteristics | LE8 quartile grouping | |||||
|---|---|---|---|---|---|---|
| 1 (n=152) | 2 (n=152) | 3 (n=155) | 4 (n=140) | t/c2/Z | P | |
| Age (year) | 67 (59,73)b | 62 (54, 73)a | 64.26 (58, 72) | 63.5 (58, 71)a | 8.826 | 0.032 |
| Male [n (%)] | 101 (66.4) | 115 (75.7) | 108 (69.7) | 100 (71.4) | 3.248 | 0.355 |
| Drinking [n (%)] | 69 (45.4) | 72 (47.4) | 67 (43.2) | 71 (50.7) | 1.786 | 0.618 |
| Alcohol abuse [n (%)] | 92 (60.5) | 104 (68.4) | 85 (54.8) | 80 (57.1) | 6.703 | 0.082 |
| BMI [kg/m², Median (P25, P75)] | 29 (25.53, 32.40)b | 26.95 (23.56, 30.90)ac | 25.70 (222.40, 29.20)ab | 24.49 (23.00, 27.18)ab | 66.077 | <0.001 |
| Hypertension [n (%)] | 108 (71.1) | 117 (77.0) | 127 (81.9) | 97 (69.3)c | 7.984 | 0.046 |
| Diabetes [n (%)] | 58 (38.2) | 71 (46.7) | 72 (46.5) | 68 (48.6) | 3.908 | 0.272 |
| Hyperlipemia [n (%)] | 64 (42.1) | 57 (37.5) | 73 (47.1) | 48 (34.3) | 5.775 | 0.123 |
| Coronary heart disease [n (%)] | 39 (25.7) | 31 (20.4) | 37 (23.9) | 25 (17.9) | 3.126 | 0.373 |
| Atrial fibrillation [n (%)] | 7 (4.6) | 8 (5.3) | 10 (6.5) | 7 (5.0) | 0.575 | 0.902 |
| Stroke [n (%)] | 55 (36.2) | 47 (30.9) | 48 (31.0) | 41 (29.3) | 1.854 | 0.603 |
| NIHSS (score) | 3 (1.87, 7)c | 3 (2, 5)c | 2 (1, 4)ab | 2 (1, 4)ab | 24.211 | <0.001 |
| mRS (score) | 2.50 (1, 4)b | 1 (0, 2)c | 1 (0, 2)ab | 1 (0, 1)ab | 105.189 | <0.001 |
Tab.1 Comparison of general data of the patients in the LE8 score quartile groups
| Characteristics | LE8 quartile grouping | |||||
|---|---|---|---|---|---|---|
| 1 (n=152) | 2 (n=152) | 3 (n=155) | 4 (n=140) | t/c2/Z | P | |
| Age (year) | 67 (59,73)b | 62 (54, 73)a | 64.26 (58, 72) | 63.5 (58, 71)a | 8.826 | 0.032 |
| Male [n (%)] | 101 (66.4) | 115 (75.7) | 108 (69.7) | 100 (71.4) | 3.248 | 0.355 |
| Drinking [n (%)] | 69 (45.4) | 72 (47.4) | 67 (43.2) | 71 (50.7) | 1.786 | 0.618 |
| Alcohol abuse [n (%)] | 92 (60.5) | 104 (68.4) | 85 (54.8) | 80 (57.1) | 6.703 | 0.082 |
| BMI [kg/m², Median (P25, P75)] | 29 (25.53, 32.40)b | 26.95 (23.56, 30.90)ac | 25.70 (222.40, 29.20)ab | 24.49 (23.00, 27.18)ab | 66.077 | <0.001 |
| Hypertension [n (%)] | 108 (71.1) | 117 (77.0) | 127 (81.9) | 97 (69.3)c | 7.984 | 0.046 |
| Diabetes [n (%)] | 58 (38.2) | 71 (46.7) | 72 (46.5) | 68 (48.6) | 3.908 | 0.272 |
| Hyperlipemia [n (%)] | 64 (42.1) | 57 (37.5) | 73 (47.1) | 48 (34.3) | 5.775 | 0.123 |
| Coronary heart disease [n (%)] | 39 (25.7) | 31 (20.4) | 37 (23.9) | 25 (17.9) | 3.126 | 0.373 |
| Atrial fibrillation [n (%)] | 7 (4.6) | 8 (5.3) | 10 (6.5) | 7 (5.0) | 0.575 | 0.902 |
| Stroke [n (%)] | 55 (36.2) | 47 (30.9) | 48 (31.0) | 41 (29.3) | 1.854 | 0.603 |
| NIHSS (score) | 3 (1.87, 7)c | 3 (2, 5)c | 2 (1, 4)ab | 2 (1, 4)ab | 24.211 | <0.001 |
| mRS (score) | 2.50 (1, 4)b | 1 (0, 2)c | 1 (0, 2)ab | 1 (0, 1)ab | 105.189 | <0.001 |
| Variable | Model 1 | Model 2 | Model 3 | ||||||
|---|---|---|---|---|---|---|---|---|---|
| β | 95%CI | P | β | 95% CI | P | β | 95% CI | P | |
| Physical activity score | -0.011 | -0.015, -0.008 | <0.001 | -0.01 | -0.013,-0.007 | <0.001 | -0.009 | -0.012, -0.005 | <0.001 |
| Dash diet score | -0.017 | -0.022, -0.012 | <0.001 | -0.016 | -0.02,-0.011 | <0.001 | -0.014 | -0.019, -0.009 | <0.001 |
| Nicotine exposure score | -0.004 | -0.007, 0.00 | 0.0429 | -0.006 | -0.01,-0.002 | <0.001 | -0.005 | -0.008, -0.001 | 0.0057 |
| Sleep health score | -0.016 | -0.019, -0.012 | <0.001 | -0.015 | -0.019, -0.012 | <0.001 | -0.014 | -0.017, -0.01 | <0.001 |
| Body mass index score | -0.005 | -0.009, -0.001 | 0.0115 | -0.005 | -0.008, -0.001 | 0.0122 | -0.006 | -0.009, -0.002 | 0.0012 |
| Blood lipid score | -0.009 | -0.013, -0.005 | <0.001 | -0.009 | -0.013, -0.005 | <0.001 | -0.007 | -0.011, -0.003 | <0.001 |
| Blood glucose score | -0.003 | -0.006, 0.001 | 0.1543 | -0.002 | -0.005,0.002 | 0.3338 | 0.000 | -0.004, 0.003 | 0.924 |
| Blood pressure score | -0.009 | -0.013, -0.004 | <0.001 | -0.009 | -0.013, -0.004 | <0.001 | -0.007 | -0.012, -0.003 | <0.001 |
Tab.3 Linear regression analysis of LE8 single factor score and mRS score
| Variable | Model 1 | Model 2 | Model 3 | ||||||
|---|---|---|---|---|---|---|---|---|---|
| β | 95%CI | P | β | 95% CI | P | β | 95% CI | P | |
| Physical activity score | -0.011 | -0.015, -0.008 | <0.001 | -0.01 | -0.013,-0.007 | <0.001 | -0.009 | -0.012, -0.005 | <0.001 |
| Dash diet score | -0.017 | -0.022, -0.012 | <0.001 | -0.016 | -0.02,-0.011 | <0.001 | -0.014 | -0.019, -0.009 | <0.001 |
| Nicotine exposure score | -0.004 | -0.007, 0.00 | 0.0429 | -0.006 | -0.01,-0.002 | <0.001 | -0.005 | -0.008, -0.001 | 0.0057 |
| Sleep health score | -0.016 | -0.019, -0.012 | <0.001 | -0.015 | -0.019, -0.012 | <0.001 | -0.014 | -0.017, -0.01 | <0.001 |
| Body mass index score | -0.005 | -0.009, -0.001 | 0.0115 | -0.005 | -0.008, -0.001 | 0.0122 | -0.006 | -0.009, -0.002 | 0.0012 |
| Blood lipid score | -0.009 | -0.013, -0.005 | <0.001 | -0.009 | -0.013, -0.005 | <0.001 | -0.007 | -0.011, -0.003 | <0.001 |
| Blood glucose score | -0.003 | -0.006, 0.001 | 0.1543 | -0.002 | -0.005,0.002 | 0.3338 | 0.000 | -0.004, 0.003 | 0.924 |
| Blood pressure score | -0.009 | -0.013, -0.004 | <0.001 | -0.009 | -0.013, -0.004 | <0.001 | -0.007 | -0.012, -0.003 | <0.001 |
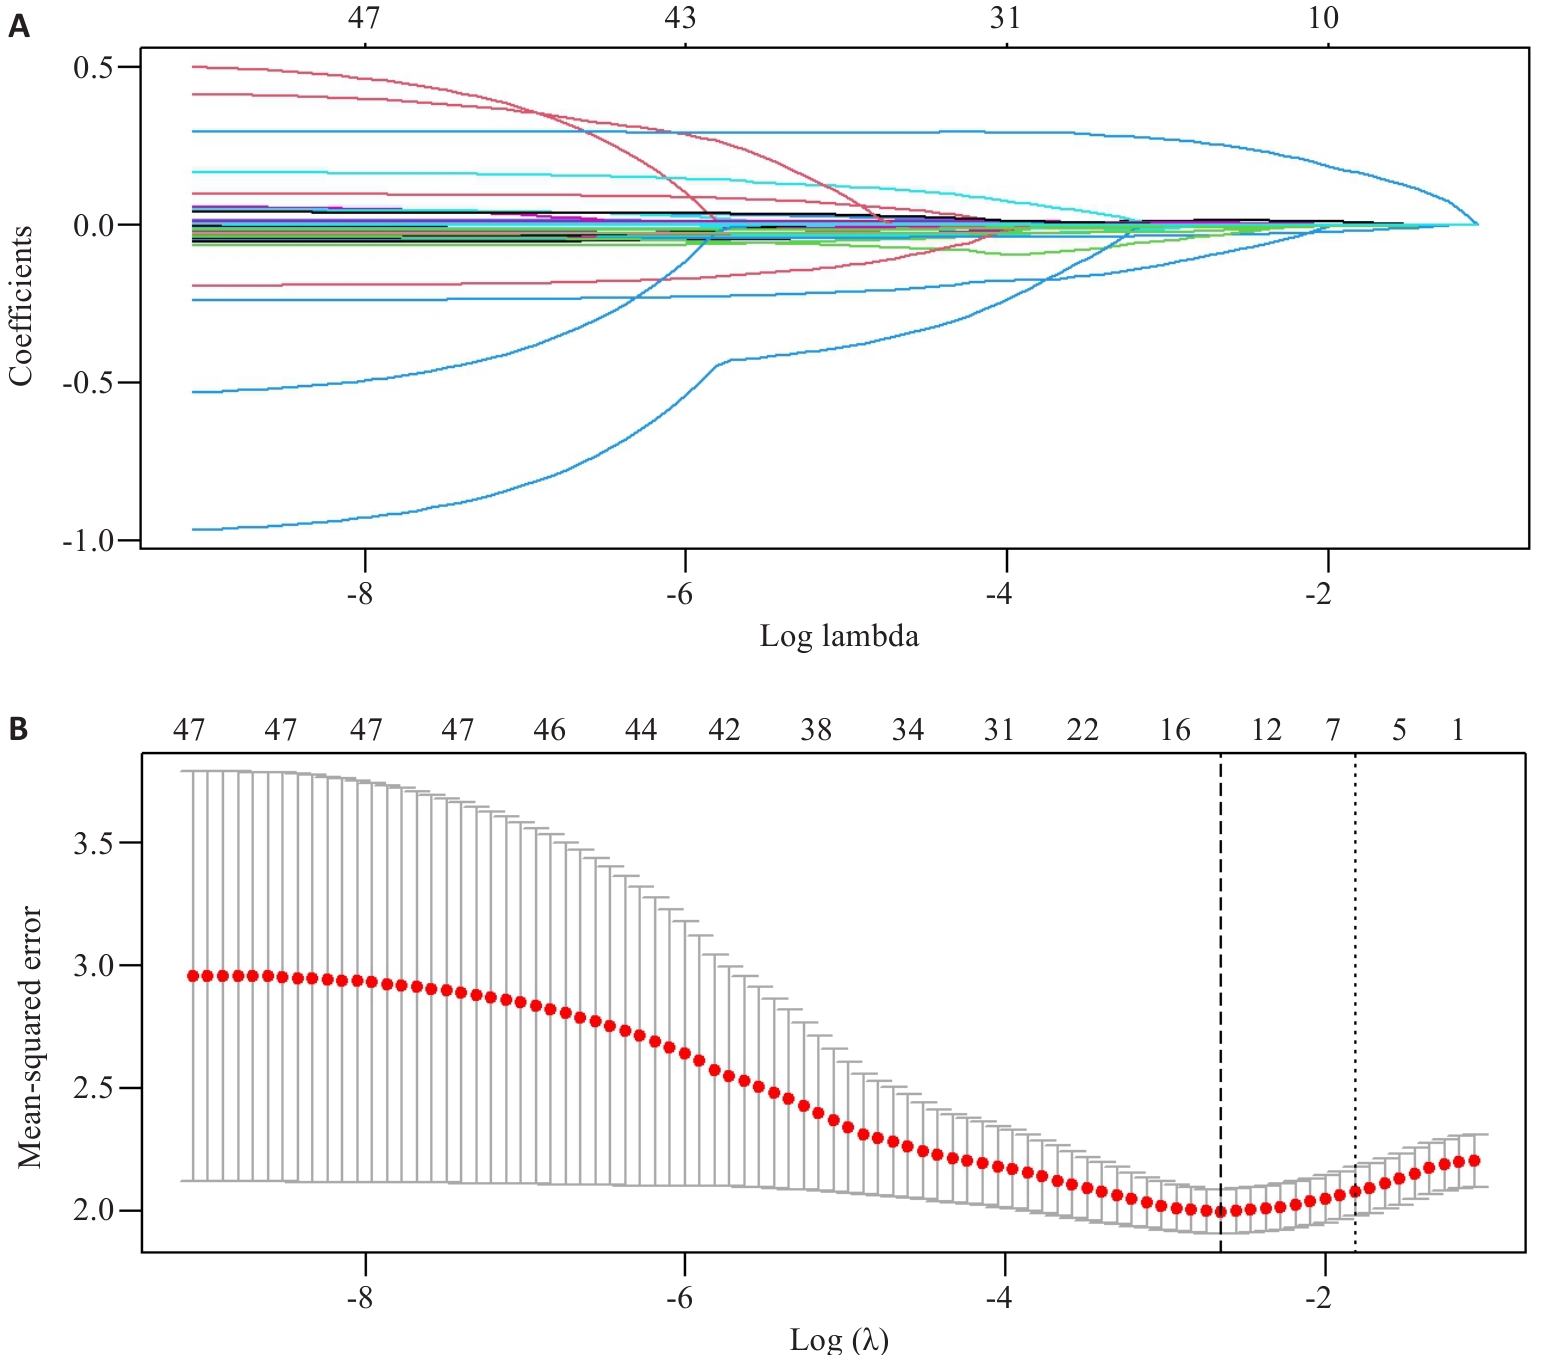
Fig.1 Variable selection based on Lasso regression. A: Lasso coefficients for 47 clinical features. B: Ten-fold cross-validation of the Lasso regression model.
| Variable | Univariate analysis | Multivariate analysis | ||||
|---|---|---|---|---|---|---|
| β | 95% CI | P | β | 95% CI | P | |
| WBC (×109/L) | 0.023 | -0.022, 0.067 | 0.3152 | |||
| RBC (×1012/L) | -0.04 | -0.113, 0.033 | 0.2847 | |||
| MCHC (g/L) | -0.02 | -0.031, -0.009 | <0.001 | -0.012 | -0.022, -0.002 | 0.0229 |
| MCH (pg) | -0.051 | -0.105, 0.003 | 0.063 | |||
| HGB (g/L) | -0.014 | -0.02, -0.008 | <0.001 | |||
| RDW (%) | 0.019 | -0.02, 0.057 | 0.3385 | |||
| NE% (%) | 0.031 | 0.019, 0.043 | <0.001 | 0.007 | -0.023, 0.036 | 0.6578 |
| NE# (×109/L) | 0.078 | 0.027, 0.129 | 0.0028 | |||
| LY% (%) | -0.036 | -0.05, -0.022 | <0.001 | -0.01 | -0.044, 0.023 | 0.5555 |
| LY# (×109/L) | -0.271 | -0.413, -0.129 | <0.001 | |||
| MO% (%) | -0.038 | -0.097, 0.02 | 0.1959 | |||
| MO# (×109/L) | 0.053 | -0.385, 0.491 | 0.812 | |||
| PLT (×109/L) | 0.000 | -0.002, 0.002 | 0.8917 | |||
| NLR | 0.063 | 0.028, 0.098 | <0.001 | |||
| HRR (g/dL) | -0.015 | -0.021, -0.009 | <0.001 | -0.007 | -0.013, 0 | 0.042 |
| K (mmol/L) | -0.062 | -0.39, 0.265 | 0.7087 | |||
| NA (mmol/L) | 0.00 | -0.041, 0.04 | 0.9869 | |||
| CL (mmol/L) | 0.00 | -0.035, 0.034 | 0.998 | |||
| UREA (mmol/L) | 0.076 | 0.014, 0.138 | 0.0166 | |||
| Cr (μmol/L) | 0.007 | 0.002, 0.011 | 0.0074 | |||
| UA (μmol/L) | -0.001 | -0.002, 0.001 | 0.3646 | |||
| TP (g/L) | 0.004 | -0.001, 0.009 | 0.1576 | |||
| ALB (g/L) | -0.067 | -0.093, -0.041 | <0.001 | -0.02 | -0.047, 0.007 | 0.1469 |
| Glb (g/L) | 0.006 | -0.019, 0.031 | 0.6243 | |||
| A/G | -0.588 | -0.977, -0.20 | 0.0031 | |||
| AST (U/L) | -0.003 | -0.012, 0.006 | 0.5436 | |||
| ALT (U/L) | -0.002 | -0.01, 0.005 | 0.5344 | |||
| GGT (U/L) | -0.002 | -0.005, 0.001 | 0.2419 | |||
| ALP (U/L) | 0.004 | -0.002, 0.01 | 0.1965 | |||
| TBIL (μmol/L) | -0.005 | -0.021, 0.011 | 0.5389 | |||
| DBIL (μmol/L) | 0.013 | -0.038, 0.065 | 0.6095 | |||
| IBIL (μmol/L) | -0.01 | -0.03, 0.01 | 0.3184 | |||
| TC (mmol/L) | 0.022 | -0.09, 0.134 | 0.6954 | |||
| TG (mmol/L) | -0.145 | -0.273, -0.016 | 0.0273 | |||
| HDL-C (mmol/L) | -0.057 | -0.531, 0.418 | 0.8151 | |||
| LDL-C (mmol/L) | 0.051 | -0.092, 0.194 | 0.4821 | |||
| HCY (μmol/L) | 0.009 | 0.001, 0.018 | 0.0297 | |||
| FBG (mmol/L) | 0.015 | -0.02, 0.049 | 0.4078 | |||
| TyG | -0.152 | -0.332, 0.029 | 0.1005 | |||
| Non-HDL-C (mmol/L) | 0.027 | -0.095, 0.149 | 0.6686 | |||
| PTA (%) | 0.001 | -0.007, 0.01 | 0.7792 | |||
| D-D (μg/L) | 0.00 | 0.00, 0.00 | 0.0759 | |||
| PT (s) | 0.032 | -0.052, 0.116 | 0.4544 | |||
| INR | 0.303 | -0.883, 1.489 | 0.6161 | |||
| APTT (s) | -0.023 | -0.05, 0.004 | 0.0997 | |||
| FIB (g/L) | 0.441 | 0.292, 0.591 | <0.001 | 0.215 | 0.068, 0.361 | 0.0041 |
| TT (s) | -0.005 | -0.023, 0.013 | 0.6089 | |||
Tab.4 Univariate and multivariate analysis of various laboratory parameters and mRS scores of the patients
| Variable | Univariate analysis | Multivariate analysis | ||||
|---|---|---|---|---|---|---|
| β | 95% CI | P | β | 95% CI | P | |
| WBC (×109/L) | 0.023 | -0.022, 0.067 | 0.3152 | |||
| RBC (×1012/L) | -0.04 | -0.113, 0.033 | 0.2847 | |||
| MCHC (g/L) | -0.02 | -0.031, -0.009 | <0.001 | -0.012 | -0.022, -0.002 | 0.0229 |
| MCH (pg) | -0.051 | -0.105, 0.003 | 0.063 | |||
| HGB (g/L) | -0.014 | -0.02, -0.008 | <0.001 | |||
| RDW (%) | 0.019 | -0.02, 0.057 | 0.3385 | |||
| NE% (%) | 0.031 | 0.019, 0.043 | <0.001 | 0.007 | -0.023, 0.036 | 0.6578 |
| NE# (×109/L) | 0.078 | 0.027, 0.129 | 0.0028 | |||
| LY% (%) | -0.036 | -0.05, -0.022 | <0.001 | -0.01 | -0.044, 0.023 | 0.5555 |
| LY# (×109/L) | -0.271 | -0.413, -0.129 | <0.001 | |||
| MO% (%) | -0.038 | -0.097, 0.02 | 0.1959 | |||
| MO# (×109/L) | 0.053 | -0.385, 0.491 | 0.812 | |||
| PLT (×109/L) | 0.000 | -0.002, 0.002 | 0.8917 | |||
| NLR | 0.063 | 0.028, 0.098 | <0.001 | |||
| HRR (g/dL) | -0.015 | -0.021, -0.009 | <0.001 | -0.007 | -0.013, 0 | 0.042 |
| K (mmol/L) | -0.062 | -0.39, 0.265 | 0.7087 | |||
| NA (mmol/L) | 0.00 | -0.041, 0.04 | 0.9869 | |||
| CL (mmol/L) | 0.00 | -0.035, 0.034 | 0.998 | |||
| UREA (mmol/L) | 0.076 | 0.014, 0.138 | 0.0166 | |||
| Cr (μmol/L) | 0.007 | 0.002, 0.011 | 0.0074 | |||
| UA (μmol/L) | -0.001 | -0.002, 0.001 | 0.3646 | |||
| TP (g/L) | 0.004 | -0.001, 0.009 | 0.1576 | |||
| ALB (g/L) | -0.067 | -0.093, -0.041 | <0.001 | -0.02 | -0.047, 0.007 | 0.1469 |
| Glb (g/L) | 0.006 | -0.019, 0.031 | 0.6243 | |||
| A/G | -0.588 | -0.977, -0.20 | 0.0031 | |||
| AST (U/L) | -0.003 | -0.012, 0.006 | 0.5436 | |||
| ALT (U/L) | -0.002 | -0.01, 0.005 | 0.5344 | |||
| GGT (U/L) | -0.002 | -0.005, 0.001 | 0.2419 | |||
| ALP (U/L) | 0.004 | -0.002, 0.01 | 0.1965 | |||
| TBIL (μmol/L) | -0.005 | -0.021, 0.011 | 0.5389 | |||
| DBIL (μmol/L) | 0.013 | -0.038, 0.065 | 0.6095 | |||
| IBIL (μmol/L) | -0.01 | -0.03, 0.01 | 0.3184 | |||
| TC (mmol/L) | 0.022 | -0.09, 0.134 | 0.6954 | |||
| TG (mmol/L) | -0.145 | -0.273, -0.016 | 0.0273 | |||
| HDL-C (mmol/L) | -0.057 | -0.531, 0.418 | 0.8151 | |||
| LDL-C (mmol/L) | 0.051 | -0.092, 0.194 | 0.4821 | |||
| HCY (μmol/L) | 0.009 | 0.001, 0.018 | 0.0297 | |||
| FBG (mmol/L) | 0.015 | -0.02, 0.049 | 0.4078 | |||
| TyG | -0.152 | -0.332, 0.029 | 0.1005 | |||
| Non-HDL-C (mmol/L) | 0.027 | -0.095, 0.149 | 0.6686 | |||
| PTA (%) | 0.001 | -0.007, 0.01 | 0.7792 | |||
| D-D (μg/L) | 0.00 | 0.00, 0.00 | 0.0759 | |||
| PT (s) | 0.032 | -0.052, 0.116 | 0.4544 | |||
| INR | 0.303 | -0.883, 1.489 | 0.6161 | |||
| APTT (s) | -0.023 | -0.05, 0.004 | 0.0997 | |||
| FIB (g/L) | 0.441 | 0.292, 0.591 | <0.001 | 0.215 | 0.068, 0.361 | 0.0041 |
| TT (s) | -0.005 | -0.023, 0.013 | 0.6089 | |||
| Mediator variable | Indirect effect | Direct effect | Proportion of intermediary effect [% (95% CI)] | ||
|---|---|---|---|---|---|
| 95% CI | P | 95% CI | P | ||
| MCHC (g/L) | -0.0005 (-0.0018, 0.00) | 0.310 | -0.0498 (-0.0595, -0.04) | <0.001 | 0.0103 (-0.0091, 0.04) |
| HRR (g/dL) | 0.0002 (-0.0013, 0.00) | 0.800 | -0.0505 (-0.0603, -0.04) | <0.001 | -0.0036 (-0.0345, 0.03) |
| FIB (g/L) | -0.0019 (-0.0038, 0.00) | 0.006 | -0.0484 (-0.0582, -0.04) | <0.001 | 0.0378 (0.0087, 0.08) |
Tab.5 Analysis of mediating effect of the selected laboratory parameters in LE8 score‑mRS score relationship
| Mediator variable | Indirect effect | Direct effect | Proportion of intermediary effect [% (95% CI)] | ||
|---|---|---|---|---|---|
| 95% CI | P | 95% CI | P | ||
| MCHC (g/L) | -0.0005 (-0.0018, 0.00) | 0.310 | -0.0498 (-0.0595, -0.04) | <0.001 | 0.0103 (-0.0091, 0.04) |
| HRR (g/dL) | 0.0002 (-0.0013, 0.00) | 0.800 | -0.0505 (-0.0603, -0.04) | <0.001 | -0.0036 (-0.0345, 0.03) |
| FIB (g/L) | -0.0019 (-0.0038, 0.00) | 0.006 | -0.0484 (-0.0582, -0.04) | <0.001 | 0.0378 (0.0087, 0.08) |
| [1] | Feigin VL, Stark BA, Johnson CO, et al. Global, regional, and national burden of stroke and its risk factors, 1990–2019: a systematic analysis for the Global Burden of Disease Study 2019[J]. Lancet Neurol, 2021, 20(10): 795-820. |
| [2] | 北京高血压防治协会, 北京糖尿病防治协会, 北京慢性病防治与健康教育研究会, 等. 基层心血管病综合管理实践指南2020[J]. 中国医学前沿杂志(电子版), 2020, 12(8): 1-73. |
| [3] | 王蓉蓉, 王守宝, 杜冠华. 线粒体相关内质网膜在缺血性脑卒中的作用[J]. 中国药理学通报, 2019, 35(6): 761-5. |
| [4] | Sayre NL, Sifuentes M, Holstein D, et al. Stimulation of astrocyte fatty acid oxidation by thyroid hormone is protective against ischemic stroke-induced damage[J]. J Cereb Blood Flow Metab, 2017, 37(2): 514-27. doi:10.1177/0271678x16629153 |
| [5] | Zhang JR, Dong DW, Zeng Y, et al. The association between stress hyperglycemia and unfavorable outcomes in patients with anterior circulation stroke after mechanical thrombectomy[J]. Front Aging Neurosci, 2023, 14: 1071377. doi:10.3389/fnagi.2022.1071377 |
| [6] | Shimoyama T, Shibazaki K, Kimura K, et al. Admission hyperglycemia causes infarct volume expansion in patients with ICA or MCA occlusion: association of collateral grade on conventional angiography[J]. Eur J Neurol, 2013, 20(1): 109-16. doi:10.1111/j.1468-1331.2012.03801.x |
| [7] | Lloyd-Jones DM, Allen NB, Anderson CAM, et al. Life's essential 8: updating and enhancing the American heart association's construct of cardiovascular health: a presidential advisory from the American heart association[J]. Circulation, 2022, 146(5): e18-43. doi:10.1161/cir.0000000000001078 |
| [8] | Ma RC, Song JT, Ding YC. Associations between Life's Essential 8 and post-stroke depression and all-cause mortality among US adults[J]. Eur J Med Res, 2024, 29(1): 229. doi:10.1186/s40001-024-01834-3 |
| [9] | Liu Y, Qin X, Jiang J, et al. Life's essential 8 trajectories and risk of stroke: a prospective cohort study[J]. Stroke, 2024, 55(11): 2611-21. doi:10.1161/strokeaha.124.046352 |
| [10] | 中华医学会神经病学分会, 中华医学会神经病学分会脑血管病学组. 中国急性缺血性卒中诊治指南2023[J]. 中华神经科杂志, 2024,57(6): 523-59. |
| [11] | Wu S, Wu Z, Yu D, et al. Life's essential 8 and risk of stroke: a prospective community-based study[J]. Stroke, 2023, 54(9): 2369-79. doi:10.1161/strokeaha.123.042525 |
| [12] | Yan B, Jin Y, Mao S, et al. Association of Life's essential 8 score with the risk of all-cause mortality and cardio-cerebrovascular mortality in patients with stroke[J]. BMC Cardiovasc Disord, 2024, 24(1): 320. doi:10.1186/s12872-024-03947-3 |
| [13] | Xing A, Tian X, Wang Y, et al. 'Life's Essential 8' cardiovascular health with premature cardiovascular disease and all-cause mortality in young adults: the Kailuan prospective cohort study[J]. Eur J Prev Cardiol, 2023, 30(7): 593-600. doi:10.1093/eurjpc/zwad033 |
| [14] | 林奕蝶, 张柏杨, 胡美婧, 等. 体育锻炼与缺血性卒中复发风险存在因果关系:基于潜在结果理论[J].南方医科大学学报, 2021, 41(8):1191-7. |
| [15] | Hamburg NM, McMackin CJ, Huang AL, et al. Physical inactivity rapidly induces insulin resistance and microvascular dysfunction in healthy volunteers[J]. Arterioscler Thromb Vasc Biol, 2007, 27(12): 2650-6. doi:10.1161/atvbaha.107.153288 |
| [16] | Schmidt-Trucksäss A, Lichtenstein AH, von Känel R. Lifestyle factors as determinants of atherosclerotic cardiovascular health[J]. Atherosclerosis, 2024, 395: 117577. doi:10.1016/j.atherosclerosis.2024.117577 |
| [17] | Alkadhi KA. Exercise as a positive modulator of brain function[J]. Mol Neurobiol, 2018, 55(4): 3112-30. doi:10.1007/s12035-017-0516-4 |
| [18] | Boehme AK, Esenwa C, Elkind MS. Stroke risk factors, genetics, and prevention[J]. Circ Res, 2017, 120(3): 472-95. doi:10.1161/circresaha.116.308398 |
| [19] | Glantz SA, Parmley WW. Passive smoking and heart disease. Epidemiology, physiology, and biochemistry[J]. Circulation, 1991, 83(1): 1-12. doi:10.1161/01.cir.83.1.1 |
| [20] | 陈晶晶, 徐格林. 吸烟与卒中[J]. 医学研究生学报, 2020, 33(5):454-9. |
| [21] | Tsereteli N, Vallat R, Fernandez-Tajes J, et al. Impact of insufficient sleep on dysregulated blood glucose control under standardised meal conditions[J]. Diabetologia, 2022, 65(2): 356-65. doi:10.1007/s00125-021-05608-y |
| [22] | St-Onge MP, Grandner MA, Brown D, et al. Sleep duration and quality: impact on lifestyle behaviors and cardiometabolic health: a scientific statement from the American heart association[J]. Circulation, 2016, 134(18): e367-86. doi:10.1161/cir.0000000000000444 |
| [23] | Tobaldini E, Fiorelli EM, Solbiati M, et al. Short sleep duration and cardiometabolic risk: from pathophysiology to clinical evidence[J]. Nat Rev Cardiol, 2019, 16(4): 213-24. doi:10.1038/s41569-018-0109-6 |
| [24] | Casas R, Castro-Barquero S, Estruch R, et al. Nutrition and cardiovascular health[J]. Int J Mol Sci, 2018, 19(12): 3988. doi:10.3390/ijms19123988 |
| [25] | Appel LJ, Moore TJ, Obarzanek E, et al. A clinical trial of the effects of dietary patterns on blood pressure. DASH Collaborative Research Group[J]. N Engl J Med, 1997, 336(16): 1117-24. doi:10.1056/nejm199704173361601 |
| [26] | 臧 丽, 杨 雁. 成人肥胖相关代谢共病的管理:共识声明和内分泌专家建议[J].中国实用内科杂志, 2025, 45(8): 656-70. |
| [27] | Klein S, Gastaldelli A, Yki-Järvinen H, et al. Why does obesity cause diabetes[J]? Cell Metab, 2022, 34(1): 11-20. doi:10.1016/j.cmet.2021.12.012 |
| [28] | Wu SM, Wu B, Liu M, et al. Stroke in China: advances and challenges in epidemiology, prevention, and management[J]. Lancet Neurol, 2019, 18(4): 394-405. doi:10.1016/s1474-4422(18)30500-3 |
| [29] | Chen Y, Han L, Zhu DS, et al. Fibrinogen and neuroinflammation in the neurovascular unit in stroke[J]. J Inflamm Res, 2025, 18: 4567-84. doi:10.2147/jir.s496433 |
| [30] | 栗 静,田 婷, 石正洪, 等. 纤维蛋白原、C反应蛋白及同型半胱氨酸与大动脉粥样硬化型卒中患者颈动脉易损性斑块的相关性分析[J].解放军医学杂志, 2017, 42(1): 41-6. |
| [31] | Du D, Zhang L, Wen X, et al. Machine learning model and hemoglobin to red cell distribution width ratio evaluates all-cause mortality in pulmonary embolism[J]. Sci Rep, 2025, 15: 23070. doi:10.1038/s41598-025-07431-6 |
| [32] | Feng XR, Zhang YD, Li QZ, et al. Hemoglobin to red cell distribution width ratio as a prognostic marker for ischemic stroke after mechanical thrombectomy[J]. Front Aging Neurosci, 2023, 15: 1259668. doi:10.3389/fnagi.2023.1259668 |
| [33] | Xiong Y, Xie S, Yao YC, et al. Hemoglobin-to-red blood cell distribution width ratio is negatively associated with stroke: a cross-sectional study from NHANES[J]. Sci Rep, 2024, 14: 28098. doi:10.1038/s41598-024-79520-x |
| [34] | Luan X, Cheng H, Chen Y, et al. High levels of plasma fibrinogen and prothrombin time are related to post-stroke emotional impairment[J]. Brain Res, 2020, 1748: 147017. doi:10.1016/j.brainres.2020.147017 |
| [35] | Ząbczyk M, RASAriëns, Undas A. Fibrin clot properties in cardiovascular disease: from basic mechanisms to clinical practice[J]. Cardiovasc Res, 2023, 119(1): 94-111. doi:10.1093/cvr/cvad017 |
| [36] | 李晓利, 范 利, 王 强, 等.老年患者远期缺血性动脉血栓事件和死亡事件重要危险因素筛查[J].中华老年心脑血管病杂志, 2018, 20(10): 1032-6. |
| [37] | McCabe JJ, Walsh C, Gorey S, et al. Plasma fibrinogen and risk of vascular recurrence after ischaemic stroke: an individual participant and summary-level data meta-analysis of 11 prospective studies[J]. Eur Stroke J, 2024, 9(3): 704-13. doi:10.1177/23969873241246489 |
| [38] | Liu J, Yang C, Cheng WK, et al. Exploring the synergistic effects of Life’s Essential 8, insulin resistance, and CRP on cardiometabolic multimorbidity risk[J]. Front Nutr, 2025, 12: 1598659. doi:10.3389/fnut.2025.1598659 |
| [39] | Ryu JK, Yan ZQ, Montano M, et al. Fibrin drives thrombo-inflammation and neuropathology in COVID-19[J]. Nature, 2024, 633(8031): 905-13. doi:10.1038/s41586-024-07873-4 |
| [1] | Xinli ZHAO, Haojie WANG, Yinchun SONG, Shuai YUAN, Zhen ZHANG, Xingqi ZHOU, Shanshan LI, Xian LI, Feng LI. ERI3 expression is elevated in hepatocellular carcinoma and correlates with poor patient prognosis [J]. Journal of Southern Medical University, 2026, 46(1): 175-182. |
| [2] | Tong SHA, Wenyan WANG, Jiabin XUAN, Jie WU, Nengxian SHI, Jin HE, Hongbin HU, Yaoyuan ZHANG. Identification of immune status subtypes and prognostic analysis of septic patients based on Th1/Th2 cytokine assays [J]. Journal of Southern Medical University, 2026, 46(1): 6-22. |
| [3] | Ying WANG, Jing LI, Yidi WANG, Mingyu HUA, Weibin HU, Xiaozhi ZHANG. Construction and verification of a prognostic model combining anoikis and immune prognostic signatures for primary liver cancer [J]. Journal of Southern Medical University, 2025, 45(9): 1967-1979. |
| [4] | Yu ZHANG, Haitao LI, Yuqing PAN, Jiexian CAO, Li ZHAI, Xi ZHANG. Pan-cancer analysis of MZB1 expression and its association with immune infiltration and clinical prognosis [J]. Journal of Southern Medical University, 2025, 45(9): 2006-2018. |
| [5] | Ziliang WANG, Xiaohua CHEN, Jingjing YANG, Chen YAN, Zhizhi ZHANG, Bingyi HUANG, Meng ZHAO, Song LIU, Sitang GE, Lugen ZUO, Deli CHEN. High expression of SURF4 promotes migration, invasion and proliferation of gastric cancer cells by inhibiting tight junction proteins [J]. Journal of Southern Medical University, 2025, 45(8): 1732-1742. |
| [6] | Jinlong PANG, Xinli ZHAO, Zhen ZHANG, Haojie WANG, Xingqi ZHOU, Yumei YANG, Shanshan LI, Xiaoqiang CHANG, Feng LI, Xian LI. Overexpression of multimerin-2 promotes cutaneous melanoma cell invasion and migration and is associated with poor prognosis [J]. Journal of Southern Medical University, 2025, 45(7): 1479-1489. |
| [7] | Xuan WU, Jiamin FANG, Weiwei HAN, Lin CHEN, Jing SUN, Qili JIN. High PRELID1 expression promotes epithelial-mesenchymal transition in gastric cancer cells and is associated with poor prognosis [J]. Journal of Southern Medical University, 2025, 45(7): 1535-1542. |
| [8] | Kang WANG, Haibin LI, Jing YU, Yuan MENG, Hongli ZHANG. High expression of ELFN1 is a prognostic biomarker and promotes proliferation and metastasis of colorectal cancer cells [J]. Journal of Southern Medical University, 2025, 45(7): 1543-1553. |
| [9] | Yi ZHANG, Yu SHEN, Zhiqiang WAN, Song TAO, Yakui LIU, Shuanhu WANG. High expression of CDKN3 promotes migration and invasion of gastric cancer cells by regulating the p53/NF-κB signaling pathway and inhibiting cell apoptosis [J]. Journal of Southern Medical University, 2025, 45(4): 853-861. |
| [10] | Qingqing HUANG, Wenjing ZHANG, Xiaofeng ZHANG, Lian WANG, Xue SONG, Zhijun GENG, Lugen ZUO, Yueyue WANG, Jing LI, Jianguo HU. High MYO1B expression promotes proliferation, migration and invasion of gastric cancer cells and is associated with poor patient prognosis [J]. Journal of Southern Medical University, 2025, 45(3): 622-631. |
| [11] | Huali LI, Ting SONG, Jiawen LIU, Yongbao LI, Zhaojing JIANG, Wen DOU, Linghong ZHOU. Prognosis-guided optimization of intensity-modulated radiation therapy plans for lung cancer [J]. Journal of Southern Medical University, 2025, 45(3): 643-649. |
| [12] | Xue SONG, Yue CHEN, Min ZHANG, Nuo ZHANG, Lugen ZUO, Jing LI, Zhijun GENG, Xiaofeng ZHANG, Yueyue WANG, Lian WANG, Jianguo HU. GPSM2 is highly expressed in gastric cancer to affect patient prognosis by promoting tumor cell proliferation [J]. Journal of Southern Medical University, 2025, 45(2): 229-238. |
| [13] | Tianwei TANG, Luan LI, Yuanhan CHEN, Li ZHANG, Lixia XU, Zhilian LI, Zhonglin FENG, Huilin ZHANG, Ruifang HUA, Zhiming YE, Xinling LIANG, Ruizhao LI. High serum cystatin C is an independent risk factor for poor renal prognosis in IgA nephropathy [J]. Journal of Southern Medical University, 2025, 45(2): 379-386. |
| [14] | Renjie ZHOU, Jingjing YANG, Bowen SONG, Xiaohua CHEN, Lian WANG, Yueyue WANG, Lugen ZUO, Bing ZHU. PSMD11 overexpression promotes epithelial-mesenchymal transition in gastric cancer and affects patient prognosis [J]. Journal of Southern Medical University, 2025, 45(12): 2747-2755. |
| [15] | Bowen SONG, Renjie ZHOU, Ying XU, Jinran SHI, Zhizhi ZHANG, Jing LI, Zhijun GENG, Xue SONG, Lian WANG, Yueyue WANG, Lugen ZUO. Elevated TMCO1 expression in gastric cancer is associated poor prognosis and promotes malignant phenotypes of tumor cells by inhibiting apoptosis [J]. Journal of Southern Medical University, 2025, 45(11): 2385-2393. |
| Viewed | ||||||
|
Full text |
|
|||||
|
Abstract |
|
|||||