Journal of Southern Medical University ›› 2025, Vol. 45 ›› Issue (9): 1903-1918.doi: 10.12122/j.issn.1673-4254.2025.09.10
Qizhi HUANG1,2( ), Daipeng XIE3, Lintong YAO2, Qiaxuan LI4, Shaowei WU2, Haiyu ZHOU1,2()
Received:2025-04-12
Online:2025-09-20
Published:2025-09-28
Contact:
Haiyu ZHOU
E-mail:hccxxzz@163.com;zhouhaiyu@gdph.org.cn
Supported by:Qizhi HUANG, Daipeng XIE, Lintong YAO, Qiaxuan LI, Shaowei WU, Haiyu ZHOU. Tumor microenvironment-specific CT radiomics signature for predicting immunotherapy response in non-small cell lung cancer[J]. Journal of Southern Medical University, 2025, 45(9): 1903-1918.
Add to citation manager EndNote|Ris|BibTeX
URL: https://www.j-smu.com/EN/10.12122/j.issn.1673-4254.2025.09.10
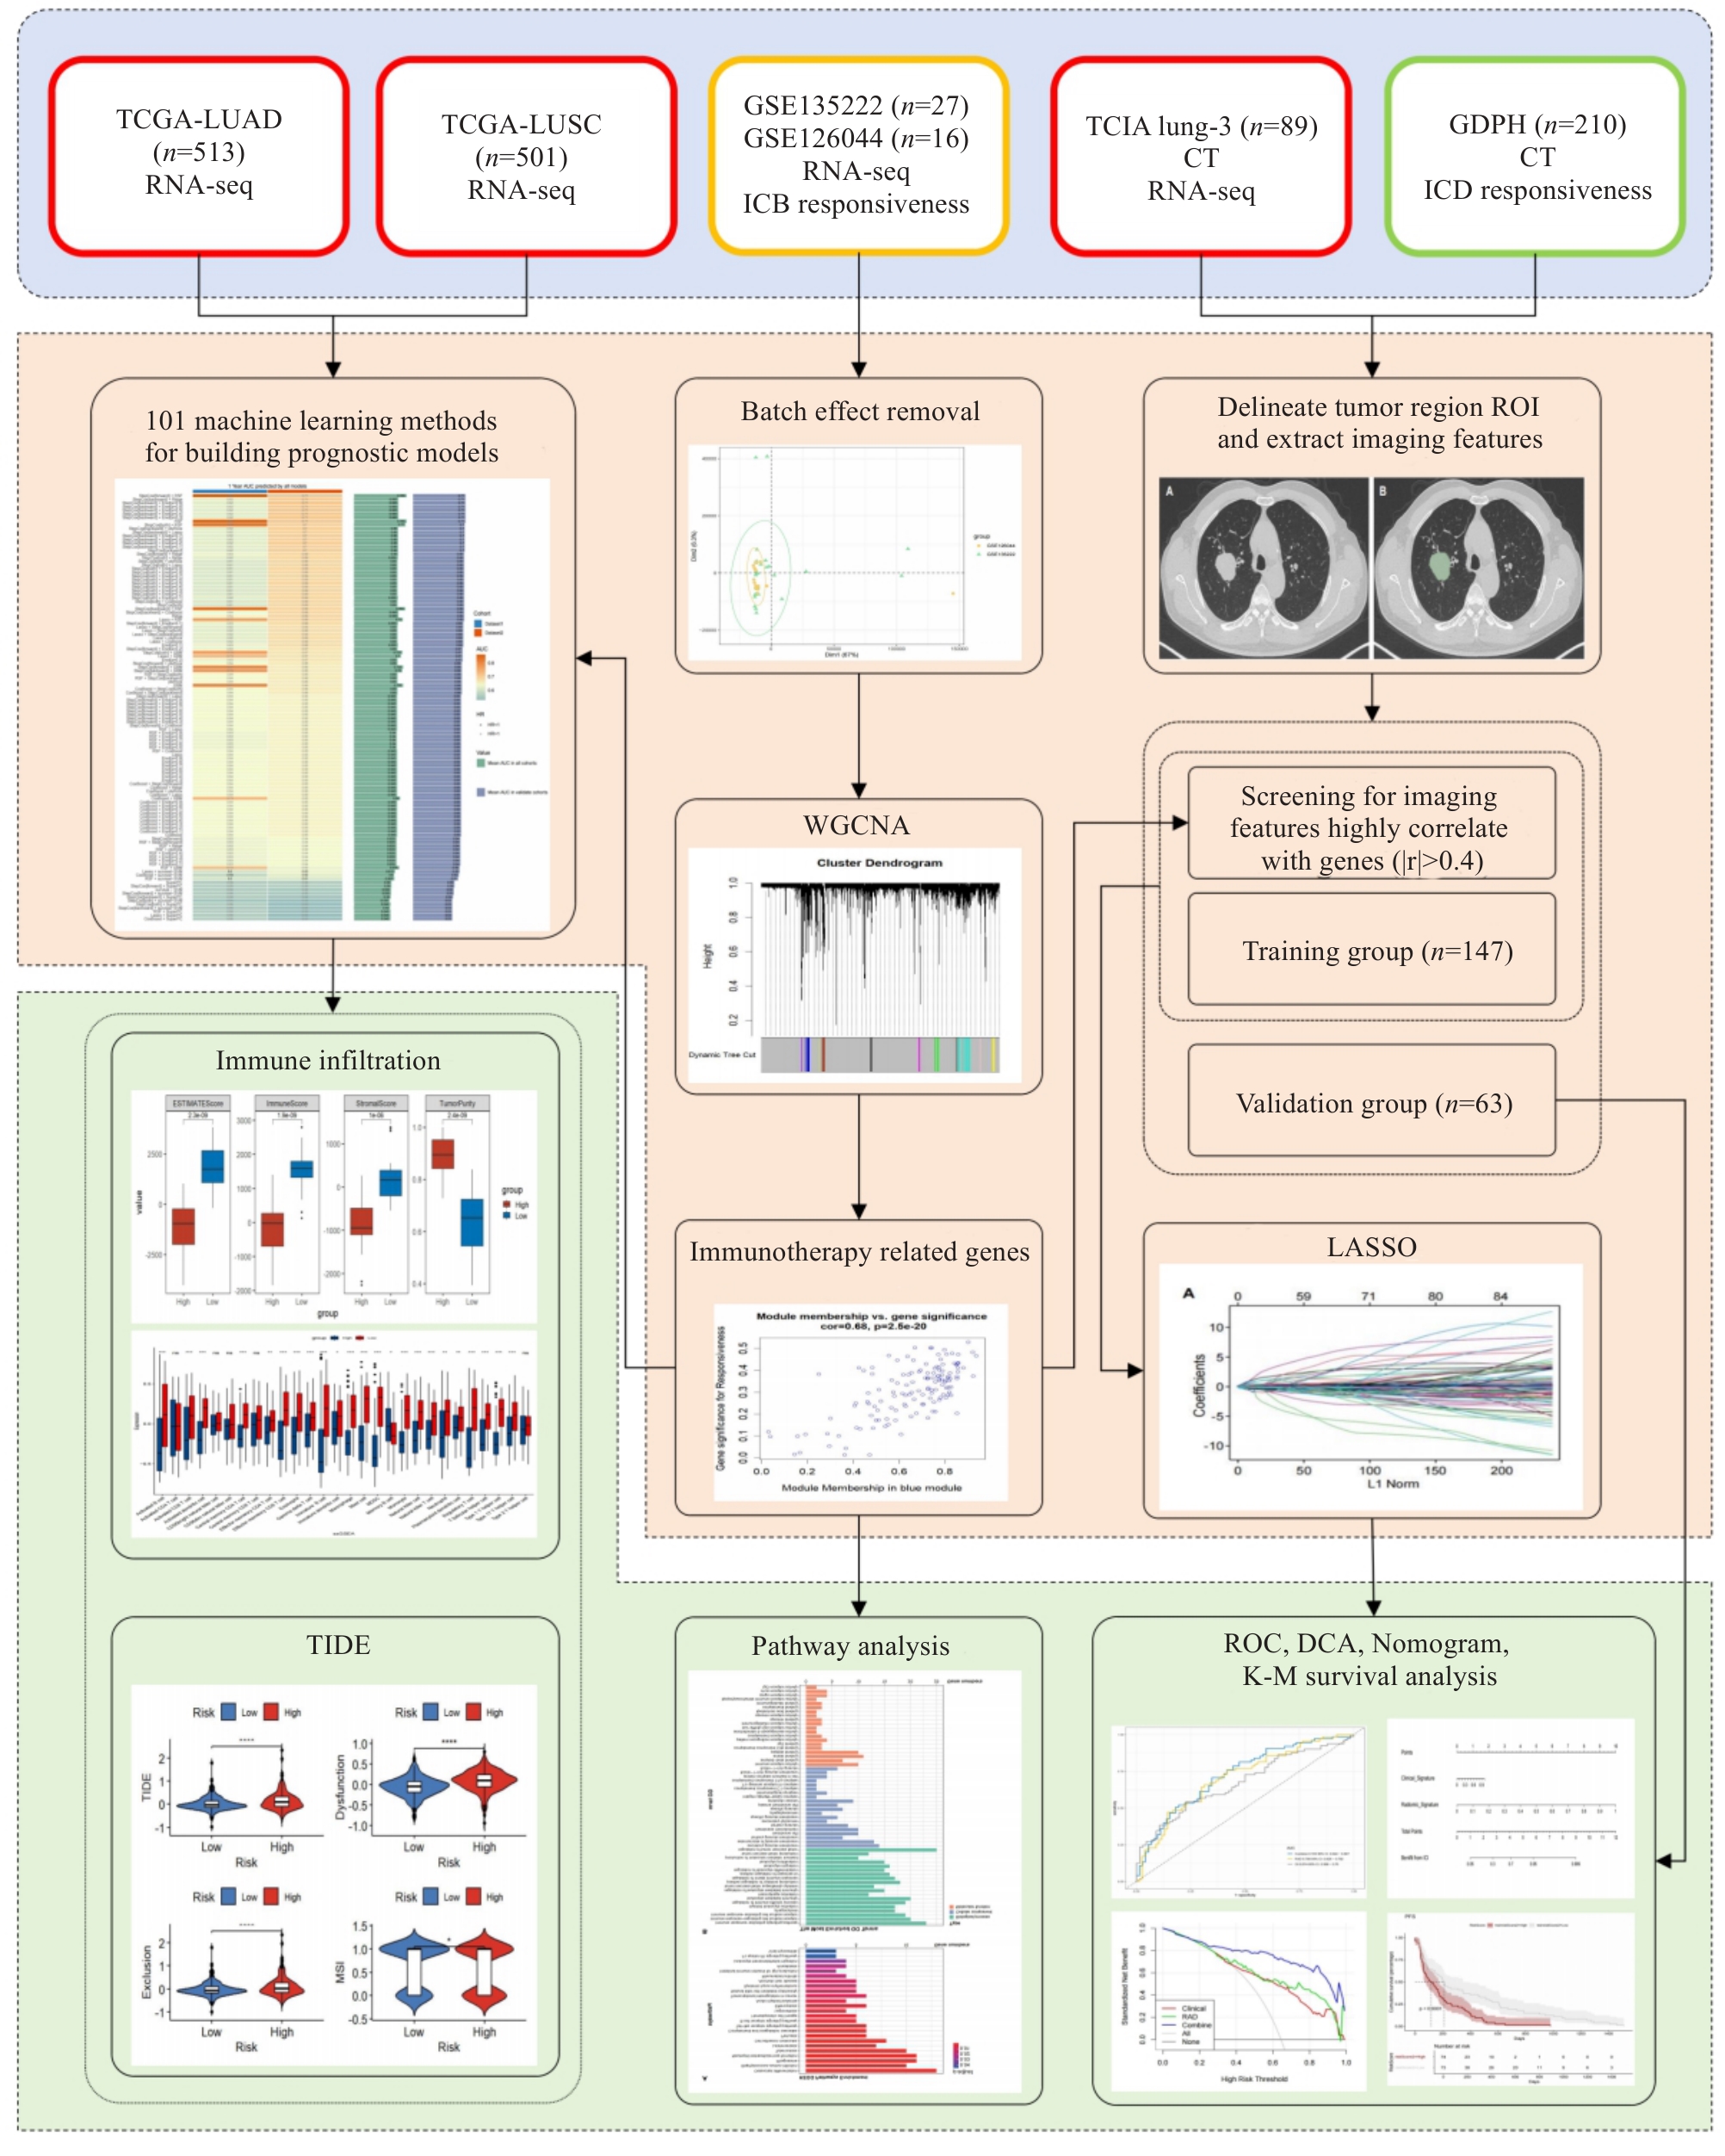
Fig.1 Flowchart of the study. We integrated the transcriptomic and CT imaging data from the TCGA, GEO, and TCIA databases and used weighted gene co-expression network analysis (WGCNA) to identify immune checkpoint inhibitors (ICIs)-related genes (IRGs) in the GEO cohort. A machine learning prognostic model was constructed in TCGA, and the tumor immune microenvironment characteristics of the patients in high- and low-risk groups were explored based on these IRGs. We extracted radiomic features from the lung_3 and identified 94 features significantly correlated with IRGs (|r|>0.4). We retrospectively analyzed 210 patients with advanced non-small cell lung cancer (aNSCLC), who were divided into the training group and validation group in a 7:3 ratio. In the training group, we used LASSO to select the imaging features and combined them with logistic regression to construct a clinical-radiomics nomogram for predicting ICIs efficacy. The performance of the model was evaluated using ROC curves, calibration curves, and decision curves.
| Variable | Total (n=43) | GSE126044 (n=16) | GSE135222 (n=27) | Z/χ² | P |
|---|---|---|---|---|---|
| Age [year, Median (Q₁, Q₃)] | 64.00 (56.50, 68.00) | 64.50 (55.75, 68.25) | 62.00 (58.00, 68.00) | 0.00 | >0.999 |
| PFS [month, Median (Q₁, Q₃)] | 2.17 (1.05, 7.08) | 2.55 (0.95, 8.87) | 1.97 (1.18, 6.32) | -0.26 | 0.792 |
| Gender [n (%)] | 0.01 | 0.929 | |||
| Female | 7 (16.28) | 2 (12.50) | 5 (18.52) | ||
| Male | 36 (83.72) | 14 (87.50) | 22 (81.48) | ||
| Histology [n (%)] | - | <0.001 | |||
| LUAD | 7 (16.28) | 7 (43.75) | 0 (0.00) | ||
| LUSC | 9 (20.93) | 9 (56.25) | 0 (0.00) | ||
| N/A | 27 (62.79) | 0 (0.00) | 27 (100.00) | ||
| Drug [n(%)] | 43.00 | <0.001 | |||
| N/A | 27 (62.79) | 0 (0.00) | 27 (100.00) | ||
| Nivolumab | 16 (37.21) | 16 (100.00) | 0 (0.00) | ||
| PD-L1 expression [n (%)] | - | <0.001 | |||
| N/A | 29 (67.44) | 2 (12.50) | 27 (100.00) | ||
| No | 9 (20.93) | 9 (56.25) | 0 (0.00) | ||
| Yes | 5 (11.63) | 5 (31.25) | 0 (0.00) |
Tab.1 Clinical information of GEO patients
| Variable | Total (n=43) | GSE126044 (n=16) | GSE135222 (n=27) | Z/χ² | P |
|---|---|---|---|---|---|
| Age [year, Median (Q₁, Q₃)] | 64.00 (56.50, 68.00) | 64.50 (55.75, 68.25) | 62.00 (58.00, 68.00) | 0.00 | >0.999 |
| PFS [month, Median (Q₁, Q₃)] | 2.17 (1.05, 7.08) | 2.55 (0.95, 8.87) | 1.97 (1.18, 6.32) | -0.26 | 0.792 |
| Gender [n (%)] | 0.01 | 0.929 | |||
| Female | 7 (16.28) | 2 (12.50) | 5 (18.52) | ||
| Male | 36 (83.72) | 14 (87.50) | 22 (81.48) | ||
| Histology [n (%)] | - | <0.001 | |||
| LUAD | 7 (16.28) | 7 (43.75) | 0 (0.00) | ||
| LUSC | 9 (20.93) | 9 (56.25) | 0 (0.00) | ||
| N/A | 27 (62.79) | 0 (0.00) | 27 (100.00) | ||
| Drug [n(%)] | 43.00 | <0.001 | |||
| N/A | 27 (62.79) | 0 (0.00) | 27 (100.00) | ||
| Nivolumab | 16 (37.21) | 16 (100.00) | 0 (0.00) | ||
| PD-L1 expression [n (%)] | - | <0.001 | |||
| N/A | 29 (67.44) | 2 (12.50) | 27 (100.00) | ||
| No | 9 (20.93) | 9 (56.25) | 0 (0.00) | ||
| Yes | 5 (11.63) | 5 (31.25) | 0 (0.00) |
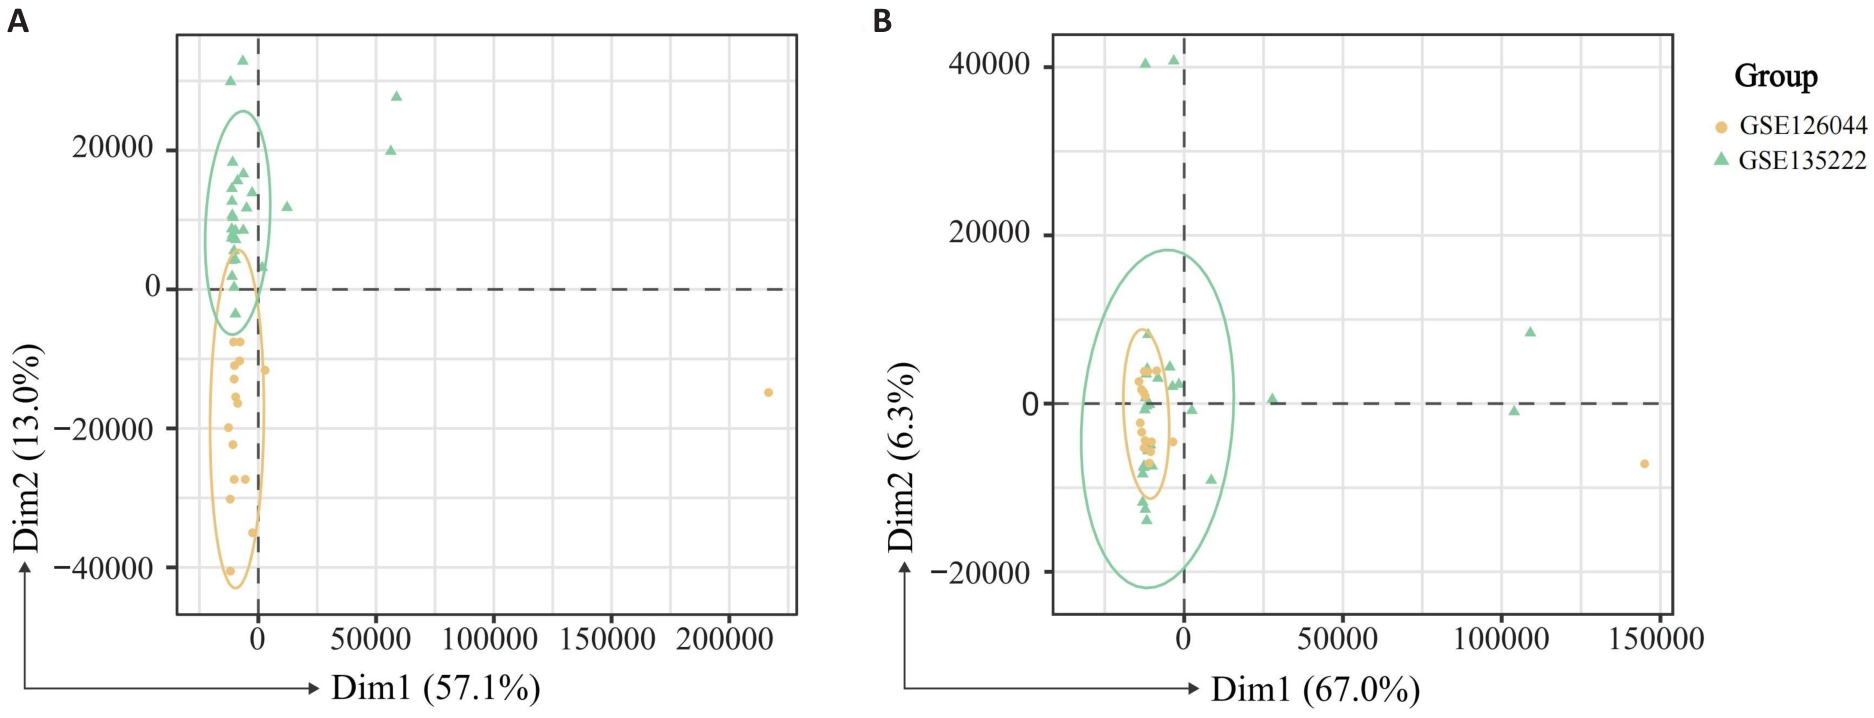
Fig.2 Principal component analysis (PCA) of mRNA-sequencing data before (A) and after (B) batch effect correction.
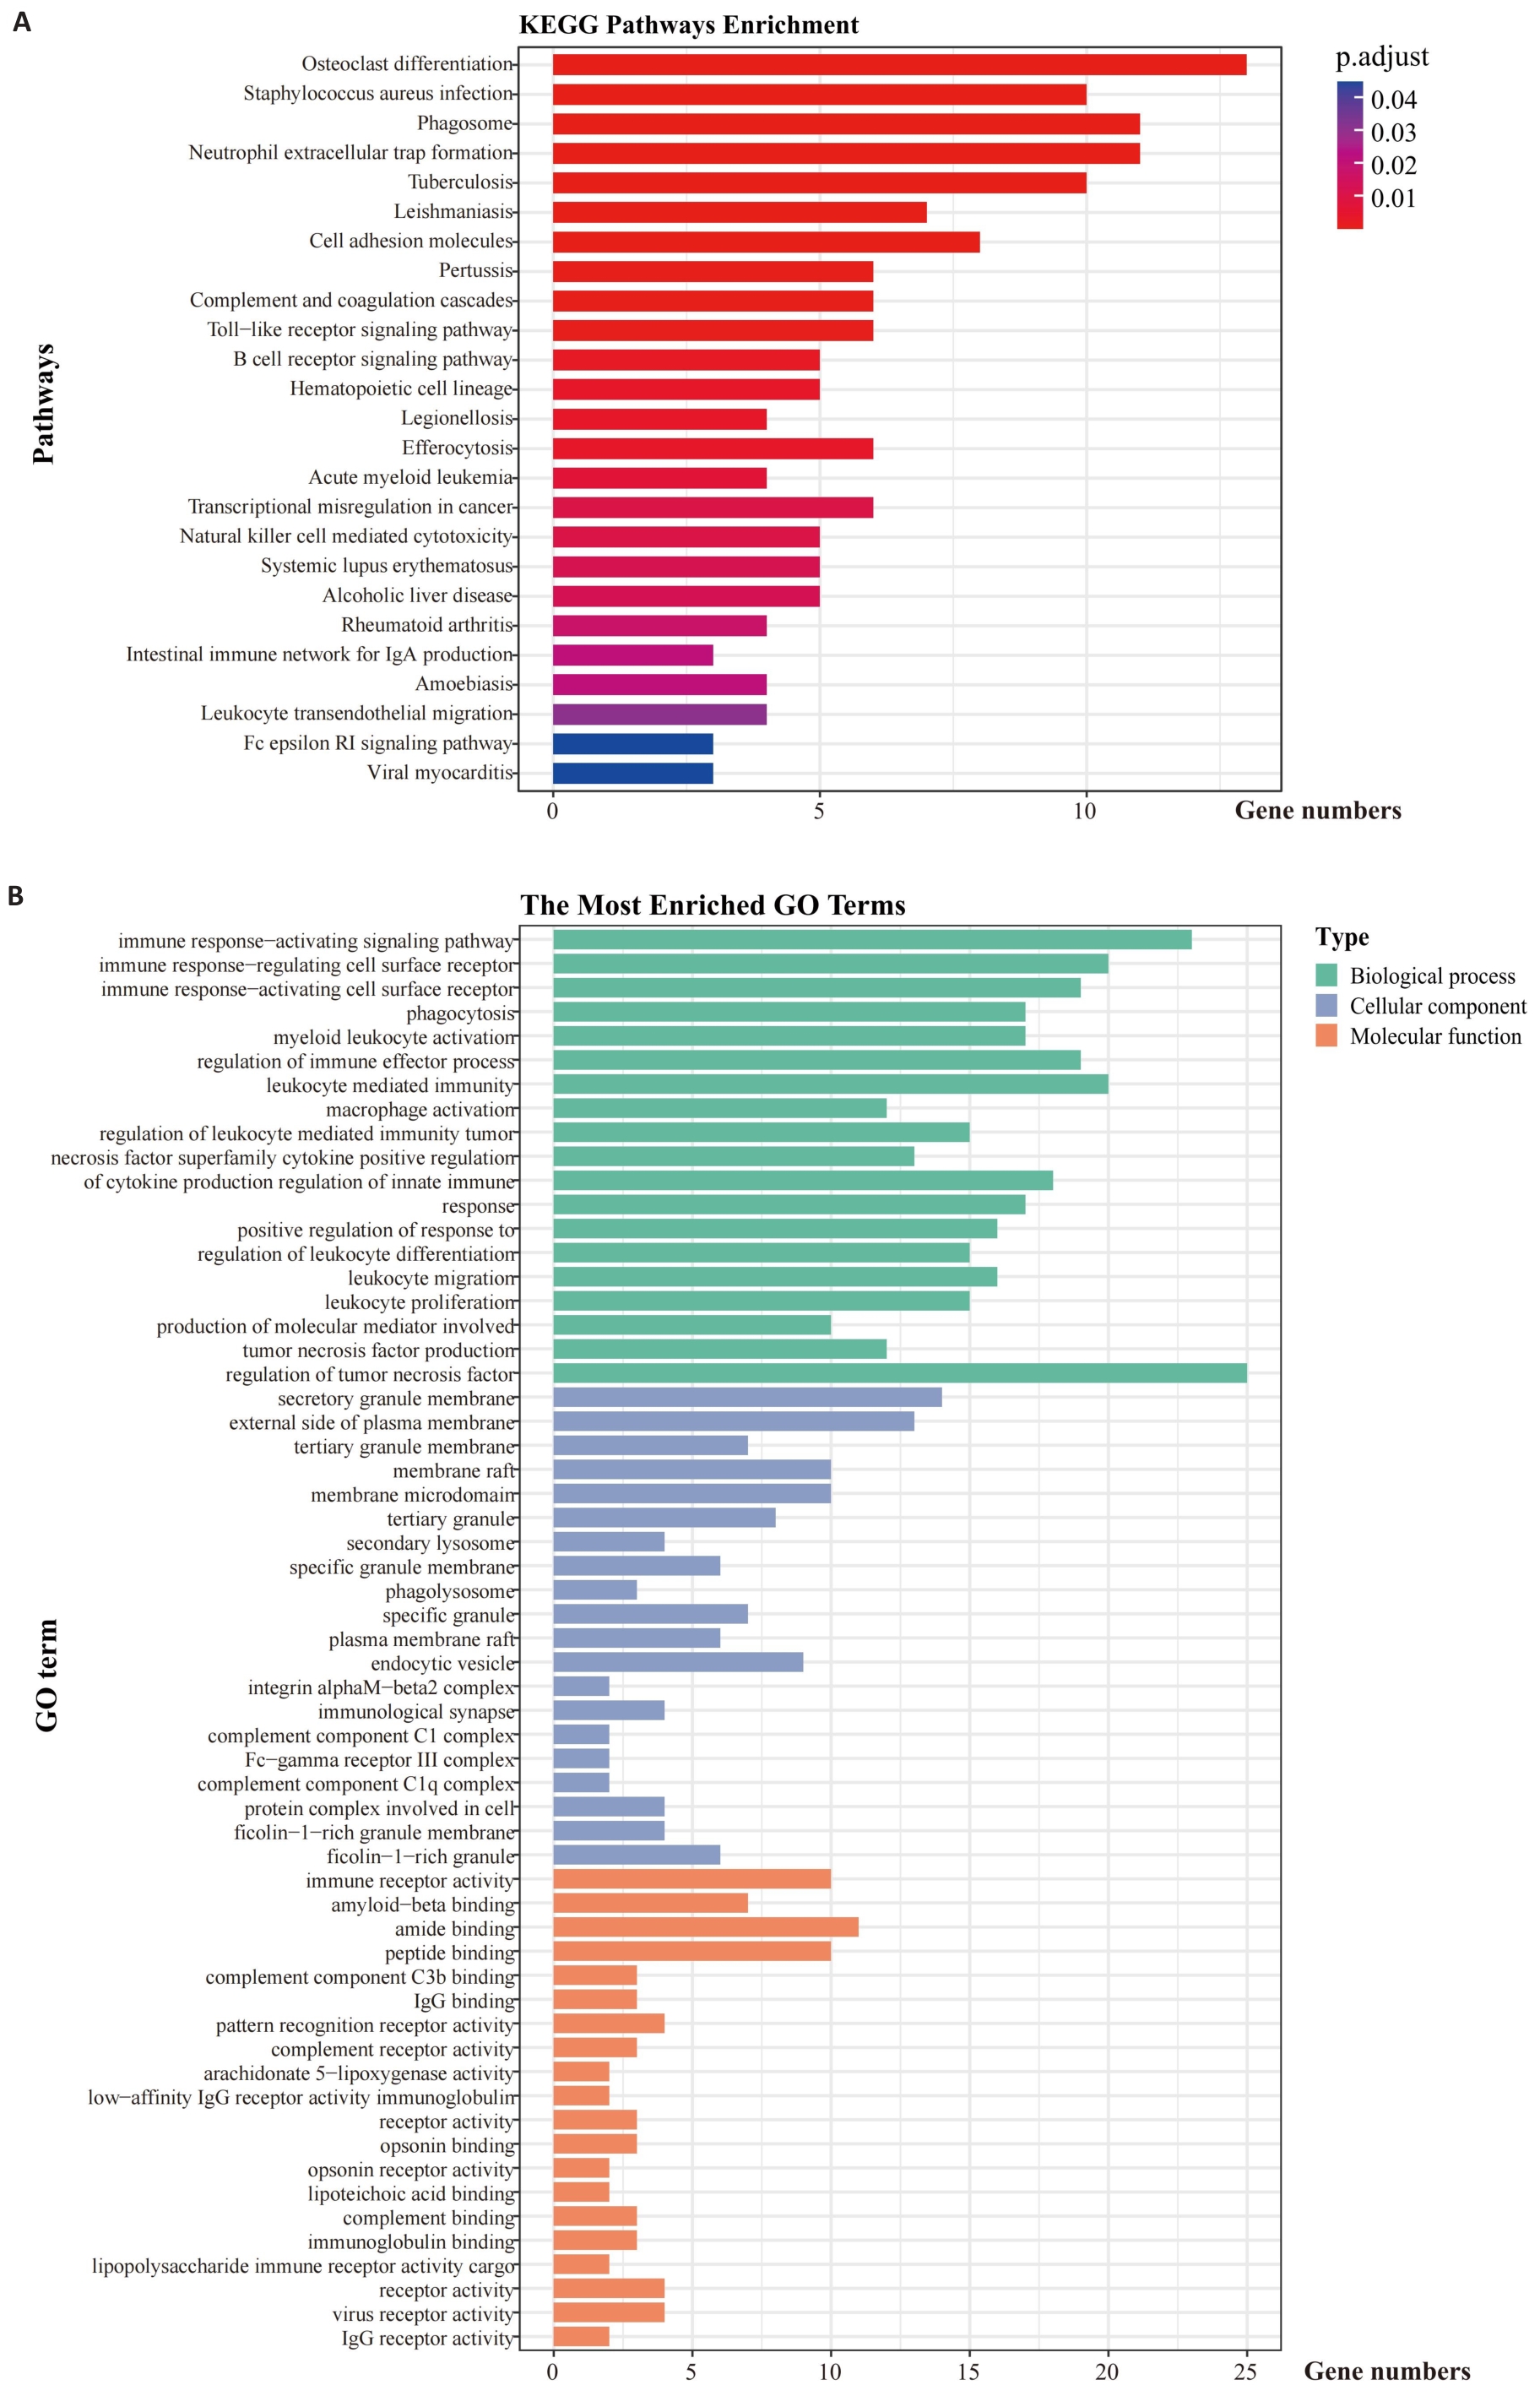
Fig.4 Kyoto Encyclopedia of Genes and Genomes (A) and Gene Ontology (B) pathway analysis of the IRGs.
| Variable | Training group (n=698) | Testing group (n=298) | t/χ² | P |
|---|---|---|---|---|
| Age (year, Mean±SD) | 65.34±11.77 | 64.94±13.48 | 0.47 | 0.636 |
| OS (day, Mean±SD) | 964.50±963.00 | 887.70±841.20 | 1.20 | 0.232 |
| Gender [n (%)] | 1.73 | 0.188 | ||
| Female | 271 (38.83) | 129 (43.29) | ||
| Male | 427 (61.17) | 169 (56.71) | ||
| Status [n (%)] | 0.59 | 0.443 | ||
| Alive | 428 (61.32) | 175 (58.72) | ||
| Dead | 270 (38.68) | 123 (41.28) | ||
| T stage [n (%)] | 0.58 | 0.965 | ||
| T1 | 194 (27.79) | 88 (29.53) | ||
| T2 | 391 (56.02) | 164 (55.03) | ||
| T3 | 83 (11.89) | 32 (10.74) | ||
| T4 | 28 (4.01) | 13 (4.36) | ||
| Tx | 2 (0.29) | 1 (0.34) | ||
| M stage [n (%)] | 0.26 | 0.877 | ||
| M0 | 518 (74.21) | 222 (74.50) | ||
| M1 | 23 (3.30) | 8 (2.68) | ||
| Mx | 157 (22.49) | 68 (22.82) | ||
| N stage [n (%)] | - | 0.733 | ||
| N0 | 456 (65.33) | 186 (62.42) | ||
| N1 | 149 (21.35) | 73 (24.50) | ||
| N2 | 75 (10.74) | 34 (11.41) | ||
| N3 | 6 (0.86) | 1 (0.34) | ||
| Nx | 12 (1.72) | 4 (1.34) | ||
| Histology [n (%)] | 0.04 | 0.835 | ||
| LUAD | 351 (50.29) | 152 (51.01) | ||
| LUSC | 347 (49.71) | 146 (48.99) |
Tab.2 Baseline data of the patient cohorts from the TCGA database
| Variable | Training group (n=698) | Testing group (n=298) | t/χ² | P |
|---|---|---|---|---|
| Age (year, Mean±SD) | 65.34±11.77 | 64.94±13.48 | 0.47 | 0.636 |
| OS (day, Mean±SD) | 964.50±963.00 | 887.70±841.20 | 1.20 | 0.232 |
| Gender [n (%)] | 1.73 | 0.188 | ||
| Female | 271 (38.83) | 129 (43.29) | ||
| Male | 427 (61.17) | 169 (56.71) | ||
| Status [n (%)] | 0.59 | 0.443 | ||
| Alive | 428 (61.32) | 175 (58.72) | ||
| Dead | 270 (38.68) | 123 (41.28) | ||
| T stage [n (%)] | 0.58 | 0.965 | ||
| T1 | 194 (27.79) | 88 (29.53) | ||
| T2 | 391 (56.02) | 164 (55.03) | ||
| T3 | 83 (11.89) | 32 (10.74) | ||
| T4 | 28 (4.01) | 13 (4.36) | ||
| Tx | 2 (0.29) | 1 (0.34) | ||
| M stage [n (%)] | 0.26 | 0.877 | ||
| M0 | 518 (74.21) | 222 (74.50) | ||
| M1 | 23 (3.30) | 8 (2.68) | ||
| Mx | 157 (22.49) | 68 (22.82) | ||
| N stage [n (%)] | - | 0.733 | ||
| N0 | 456 (65.33) | 186 (62.42) | ||
| N1 | 149 (21.35) | 73 (24.50) | ||
| N2 | 75 (10.74) | 34 (11.41) | ||
| N3 | 6 (0.86) | 1 (0.34) | ||
| Nx | 12 (1.72) | 4 (1.34) | ||
| Histology [n (%)] | 0.04 | 0.835 | ||
| LUAD | 351 (50.29) | 152 (51.01) | ||
| LUSC | 347 (49.71) | 146 (48.99) |
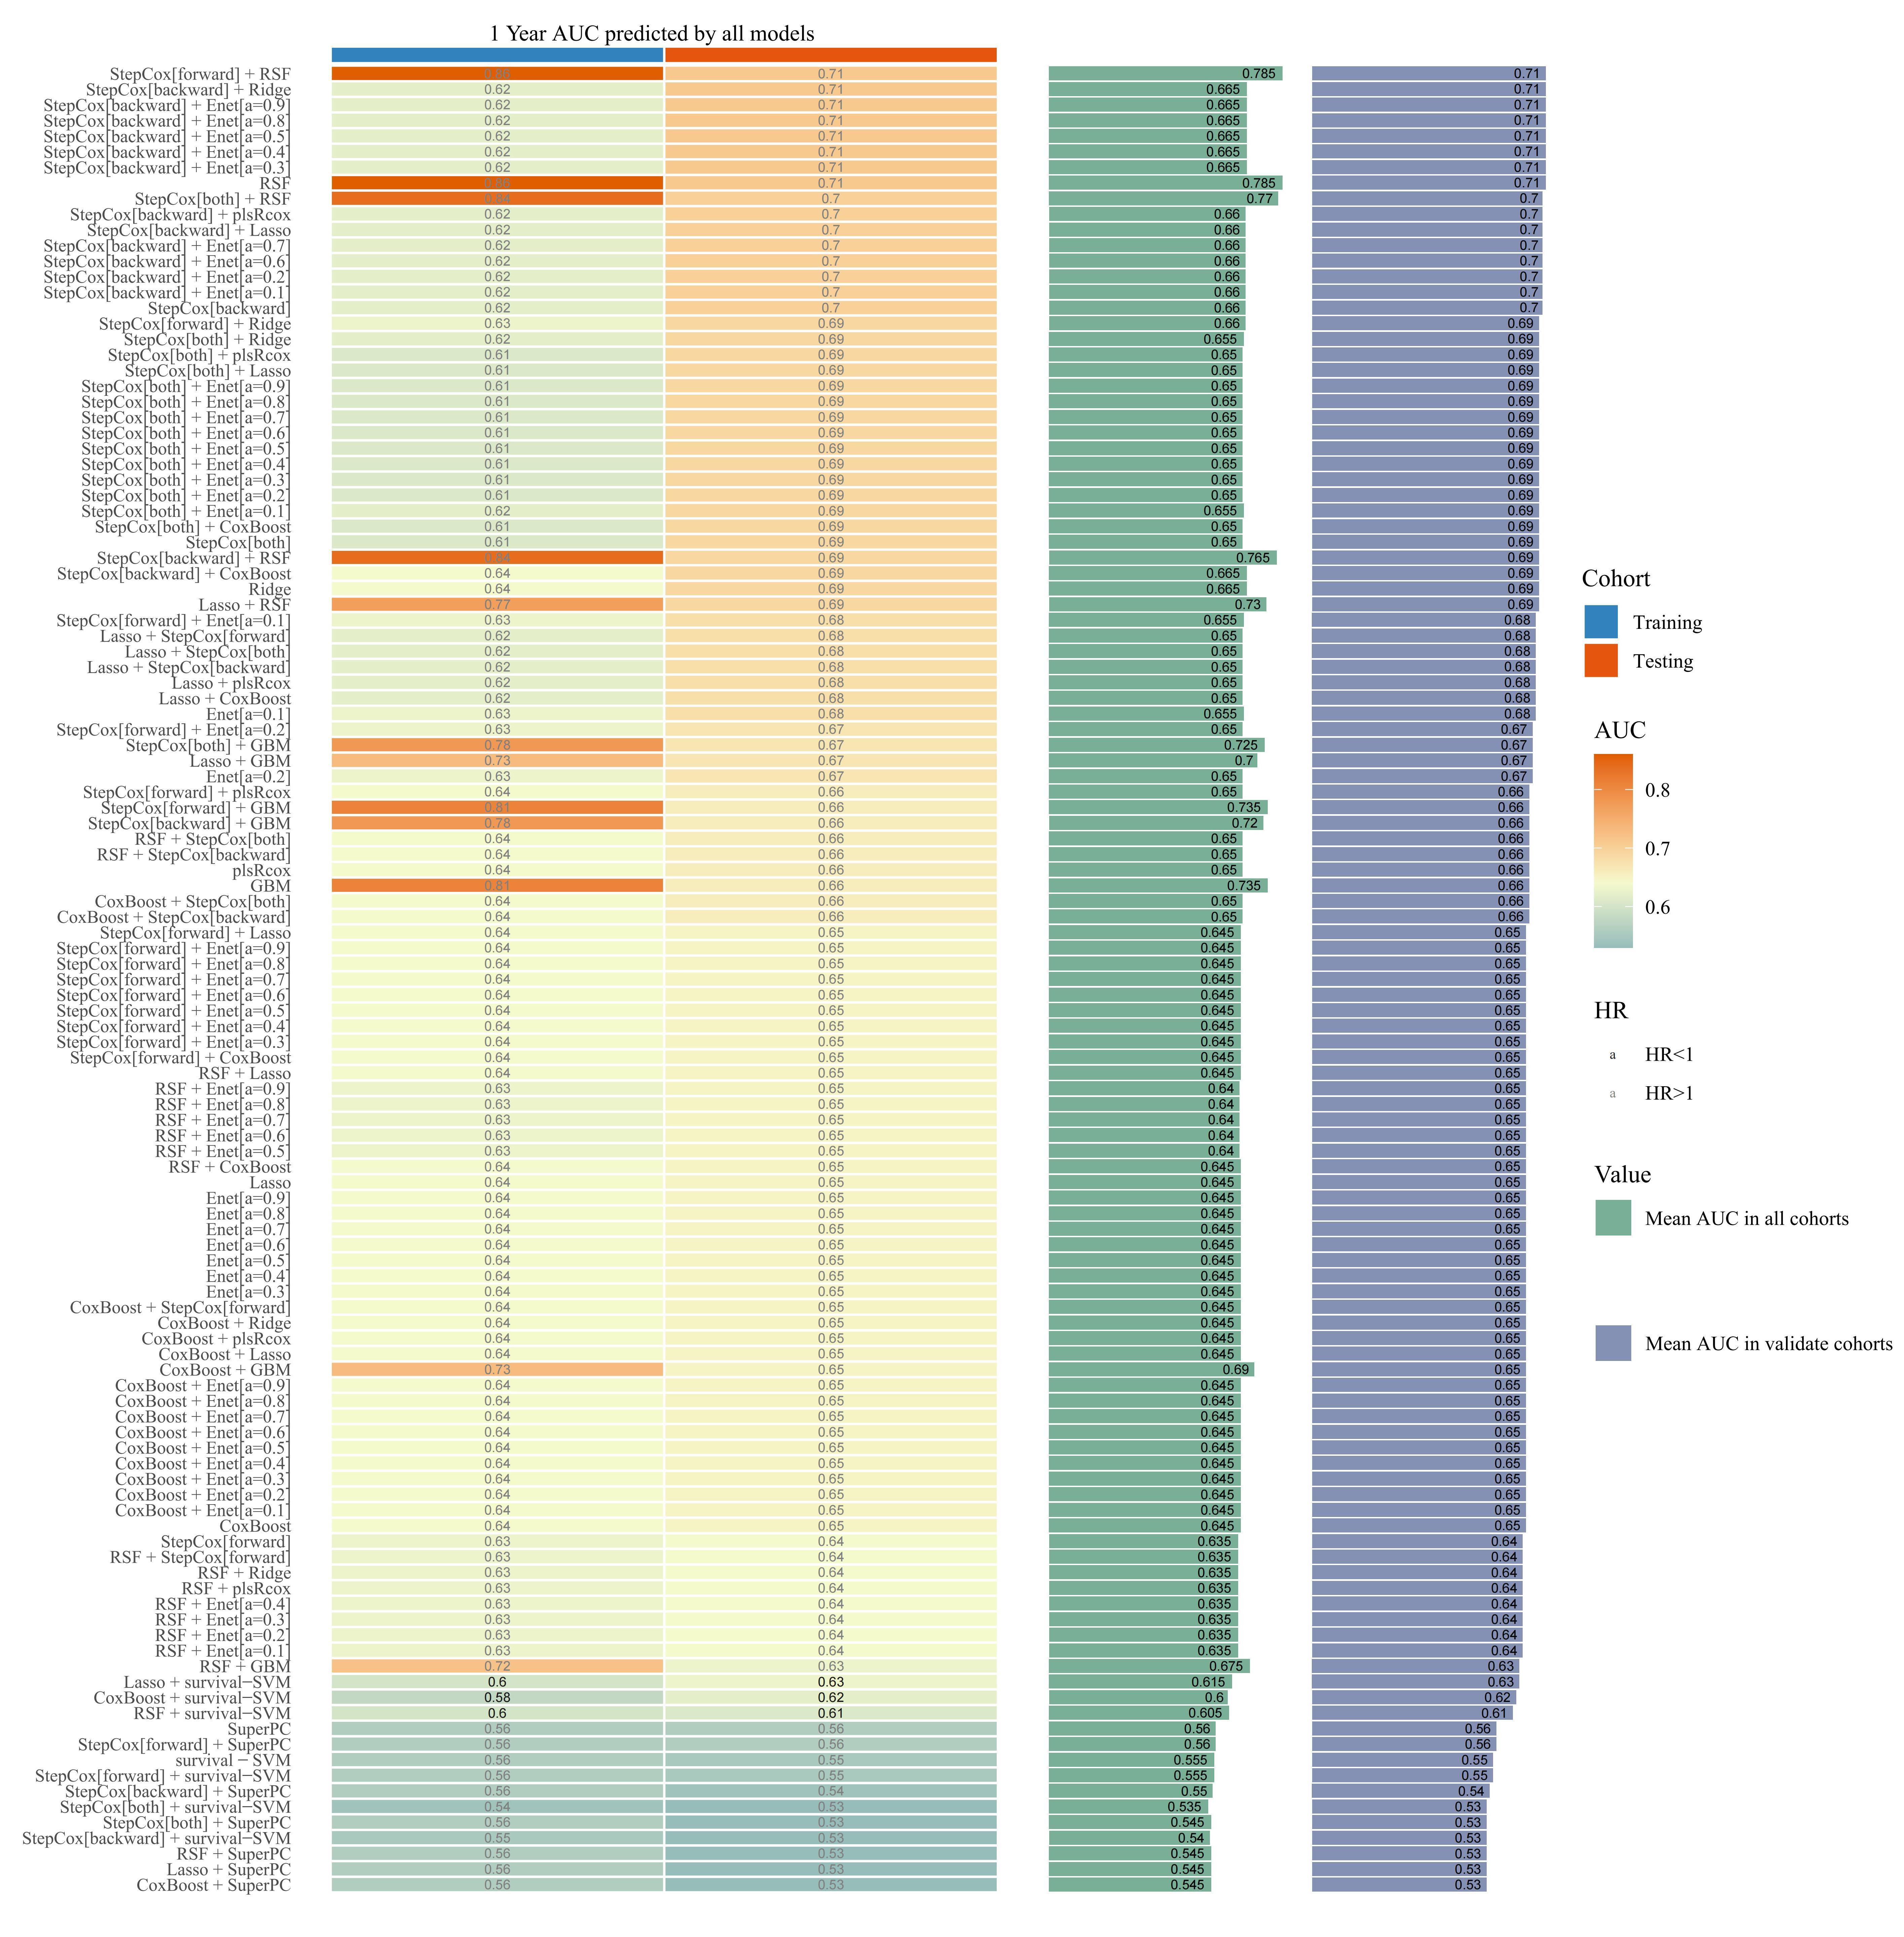
Fig.5 Predictive models constructed using 101 kinds of machine learning.
Fig.7 Distribution of TME immune infiltration components. A: Distribution of TME immune cell infiltration components of the training set by ssGSEA. B: Distribution of TME immune cell infiltration components of the validation set by ssGSEA. C: ESTIMATE scores of the training set. D: ESTIMATE scores of the validation set. E: TIDE in the training set. F: TIDE in the validation set (B). *P<0.05, **P<0.01, ***P<0.001, ****P<0.0001.
| Variables | Training group | Testing group | ||||||
|---|---|---|---|---|---|---|---|---|
| R (n=69) | nR (n=78) | t/χ² | P | R (n=28) | nR (n=35) | t/χ² | P | |
| Age (year, Mean±SD) | 60.55±10.48 | 60.46±9.78 | 0.05 | 0.958 | 59.86±9.34 | 60.34±8.72 | -0.21 | 0.832 |
| OS (day, Mean±SD) | 681.16±322.46 | 318.42±302.09 | 6.99 | <0.001 | 719.86±348.41 | 283.91±237.60 | 5.65 | <0.001 |
| PFS (day, Mean±SD) | 515.13±60.73 | 81.87±49.70 | 9.89 | <0.001 | 623.96±340.28 | 89.74±111.86 | 7.97 | <0.001 |
| Gender [n (%)] | 10.55 | 0.001 | 0.56 | 0.456 | ||||
| Male | 65 (94.20) | 58 (74.36) | 23 (82.14) | 26 (74.29) | ||||
| Female | 4 (5.80) | 20 (25.64) | 5 (17.86) | 9 (25.71) | ||||
| ECOG [n (%)] | 0.97 | 0.324 | 3.35 | 0.067 | ||||
| 0-1 | 65 (94.20) | 70 (89.74) | 27 (100.00) | 29 (82.86) | ||||
| ≥2 | 4 (5.80) | 8 (10.26) | 0 (0.00) | 6 (17.14) | ||||
| Smoking status [n (%)] | - | 0.031 | 1.83 | 0.176 | ||||
| Never smoked | 25 (36.23) | 42 (53.85) | 12 (42.86) | 21 (60.00) | ||||
| Current or former smoker | 44 (63.77) | 35 (44.87) | 16 (57.14) | 14 (40.00) | ||||
| Missing | 0 (0.00) | 1 (1.28) | - | - | ||||
| Tumor histologic type [n (%)] | 0.05 | 0.825 | 1.24 | 0.265 | ||||
| LUAD | 52 (75.36) | 60 (76.92) | 24 (85.71) | 26 (74.29) | ||||
| LUSC | 17 (24.64) | 18 (23.08) | 4 (14.29) | 9 (25.71) | ||||
| Pathological stage [n (%)] | 5.85 | 0.054 | - | 0.121 | ||||
| III | 7 (10.14) | 7 (8.97) | 4 (14.29) | 3 (8.57) | ||||
| IVA | 31 (44.93) | 21 (26.92) | 13 (46.43) | 9 (25.71) | ||||
| IVB | 31 (44.93) | 50 (64.10) | 11 (39.29) | 23 (65.71) | ||||
| EGFR mutation [n (%)] | 1.24 | 0.265 | 0.45 | 0.504 | ||||
| 0 | 64 (92.75) | 68 (87.18) | 28 (93.33) | 28 (84.85) | ||||
| 1 | 5 (7.25) | 10 (12.82) | 2 (6.67) | 5 (15.15) | ||||
| PD-L1 [n(%)] | 2.68 | 0.444 | - | 0.294 | ||||
| <1% | 5 (7.25) | 7 (8.97) | 1 (3.57) | 4 (11.43) | ||||
| 1%-49% | 13 (18.84) | 10 (12.82) | 1 (3.57) | 4 (11.43) | ||||
| ≥50% | 20 (28.99) | 17 (21.79) | 8 (28.57) | 5 (14.29) | ||||
| NA | 31 (44.93) | 44 (56.41) | 18 (64.29) | 22 (62.86) | ||||
| LOT [n (%)] | 7.10 | 0.008 | 3.96 | 0.047 | ||||
| First line | 27 (39.13) | 15 (19.23) | 14 (50.00) | 9 (25.71) | ||||
| Second line or more | 42 (60.87) | 63 (80.77) | 14 (50.00) | 26 (74.29) | ||||
| ICIs [n (%)] | 1.50 | 0.221 | 1.16 | 0.282 | ||||
| Anti PD-1 | 55 (79.71) | 68 (87.18) | 21 (75.00) | 30 (85.71) | ||||
| Anti PD-L1 | 14 (20.29) | 10 (12.82) | 7 (25.00) | 5 (14.29) | ||||
Tab.3 Baseline characteristics of the real-world cohort
| Variables | Training group | Testing group | ||||||
|---|---|---|---|---|---|---|---|---|
| R (n=69) | nR (n=78) | t/χ² | P | R (n=28) | nR (n=35) | t/χ² | P | |
| Age (year, Mean±SD) | 60.55±10.48 | 60.46±9.78 | 0.05 | 0.958 | 59.86±9.34 | 60.34±8.72 | -0.21 | 0.832 |
| OS (day, Mean±SD) | 681.16±322.46 | 318.42±302.09 | 6.99 | <0.001 | 719.86±348.41 | 283.91±237.60 | 5.65 | <0.001 |
| PFS (day, Mean±SD) | 515.13±60.73 | 81.87±49.70 | 9.89 | <0.001 | 623.96±340.28 | 89.74±111.86 | 7.97 | <0.001 |
| Gender [n (%)] | 10.55 | 0.001 | 0.56 | 0.456 | ||||
| Male | 65 (94.20) | 58 (74.36) | 23 (82.14) | 26 (74.29) | ||||
| Female | 4 (5.80) | 20 (25.64) | 5 (17.86) | 9 (25.71) | ||||
| ECOG [n (%)] | 0.97 | 0.324 | 3.35 | 0.067 | ||||
| 0-1 | 65 (94.20) | 70 (89.74) | 27 (100.00) | 29 (82.86) | ||||
| ≥2 | 4 (5.80) | 8 (10.26) | 0 (0.00) | 6 (17.14) | ||||
| Smoking status [n (%)] | - | 0.031 | 1.83 | 0.176 | ||||
| Never smoked | 25 (36.23) | 42 (53.85) | 12 (42.86) | 21 (60.00) | ||||
| Current or former smoker | 44 (63.77) | 35 (44.87) | 16 (57.14) | 14 (40.00) | ||||
| Missing | 0 (0.00) | 1 (1.28) | - | - | ||||
| Tumor histologic type [n (%)] | 0.05 | 0.825 | 1.24 | 0.265 | ||||
| LUAD | 52 (75.36) | 60 (76.92) | 24 (85.71) | 26 (74.29) | ||||
| LUSC | 17 (24.64) | 18 (23.08) | 4 (14.29) | 9 (25.71) | ||||
| Pathological stage [n (%)] | 5.85 | 0.054 | - | 0.121 | ||||
| III | 7 (10.14) | 7 (8.97) | 4 (14.29) | 3 (8.57) | ||||
| IVA | 31 (44.93) | 21 (26.92) | 13 (46.43) | 9 (25.71) | ||||
| IVB | 31 (44.93) | 50 (64.10) | 11 (39.29) | 23 (65.71) | ||||
| EGFR mutation [n (%)] | 1.24 | 0.265 | 0.45 | 0.504 | ||||
| 0 | 64 (92.75) | 68 (87.18) | 28 (93.33) | 28 (84.85) | ||||
| 1 | 5 (7.25) | 10 (12.82) | 2 (6.67) | 5 (15.15) | ||||
| PD-L1 [n(%)] | 2.68 | 0.444 | - | 0.294 | ||||
| <1% | 5 (7.25) | 7 (8.97) | 1 (3.57) | 4 (11.43) | ||||
| 1%-49% | 13 (18.84) | 10 (12.82) | 1 (3.57) | 4 (11.43) | ||||
| ≥50% | 20 (28.99) | 17 (21.79) | 8 (28.57) | 5 (14.29) | ||||
| NA | 31 (44.93) | 44 (56.41) | 18 (64.29) | 22 (62.86) | ||||
| LOT [n (%)] | 7.10 | 0.008 | 3.96 | 0.047 | ||||
| First line | 27 (39.13) | 15 (19.23) | 14 (50.00) | 9 (25.71) | ||||
| Second line or more | 42 (60.87) | 63 (80.77) | 14 (50.00) | 26 (74.29) | ||||
| ICIs [n (%)] | 1.50 | 0.221 | 1.16 | 0.282 | ||||
| Anti PD-1 | 55 (79.71) | 68 (87.18) | 21 (75.00) | 30 (85.71) | ||||
| Anti PD-L1 | 14 (20.29) | 10 (12.82) | 7 (25.00) | 5 (14.29) | ||||
Fig.8 An example of tumor segmentation. A: Primary tumor lesion in pre-segmentation state. B: Axial image single-layer regions of interest manually outlined using 3D Slicer software.
| Feature | Coefficient |
|---|---|
| Intercept | 0.298 |
| wavelet-HLL-firstorder-Mean | 0.483 |
| wavelet-HHH-gldm-LargeDependenceHighGrayLevelEmphasis | 0.391 |
| wavelet-HHH-glszm-SmallAreaEmphasis | 0.292 |
| wavelet-HHL-gldm-LargeDependenceHighGrayLevelEmphasis | 0.289 |
| wavelet-HHL-firstorder-Kurtosis | 0.936 |
| wavelet-HHL-glszm-SmallAreaLowGrayLevelEmphasis | 0.588 |
| wavelet-LLL-ngtdm-Busyness | 0.390 |
Tab.4 List of radiomics features and coefficients
| Feature | Coefficient |
|---|---|
| Intercept | 0.298 |
| wavelet-HLL-firstorder-Mean | 0.483 |
| wavelet-HHH-gldm-LargeDependenceHighGrayLevelEmphasis | 0.391 |
| wavelet-HHH-glszm-SmallAreaEmphasis | 0.292 |
| wavelet-HHL-gldm-LargeDependenceHighGrayLevelEmphasis | 0.289 |
| wavelet-HHL-firstorder-Kurtosis | 0.936 |
| wavelet-HHL-glszm-SmallAreaLowGrayLevelEmphasis | 0.588 |
| wavelet-LLL-ngtdm-Busyness | 0.390 |
Fig.9 LASSO regression model identifies 7 radiomics features. A: Relationship between L1 norm and model coefficients. B: MSE corresponding to different regularization parameter λ [Log (λ)] during cross-validation.
| Variables | Univariate | Multivariate | ||
|---|---|---|---|---|
| P | OR (95% CI) | P | OR (95% CI) | |
| Age | 0.878 | 1.00 (0.98-1.03) | - | - |
| Gender | 0.003 | 0.29 (0.13-0.65) | 0.137 | 0.48 (0.18-1.26) |
| Smoking status | 0.009 | 2.05 (1.19-3.51) | 0.346 | 1.39 (0.70-2.78) |
| ECOG | 0.028 | 0.35 (0.13-0.89) | 0.164 | 0.41 (0.12-1.43) |
| EGFR mutation | 0.598 | 0.79 (0.34-1.88) | - | - |
| Clinical stage | 0.007 | 0.56 (0.37-0.85) | 0.128 | 0.69 (0.43-1.11) |
| Lines of therapy | 0.002 | 0.67 (0.52-0.86) | 0.438 | 0.89 (0.65-1.20) |
| NLR pre | 0.398 | 0.98 (0.93-1.03) | - | - |
| NLR post | <0.001 | 0.84 (0.76-0.93) | 0.003 | 0.85 (0.77-0.95) |
Tab.5 Clinical information analyzed by univariate and multivariate logistic regression
| Variables | Univariate | Multivariate | ||
|---|---|---|---|---|
| P | OR (95% CI) | P | OR (95% CI) | |
| Age | 0.878 | 1.00 (0.98-1.03) | - | - |
| Gender | 0.003 | 0.29 (0.13-0.65) | 0.137 | 0.48 (0.18-1.26) |
| Smoking status | 0.009 | 2.05 (1.19-3.51) | 0.346 | 1.39 (0.70-2.78) |
| ECOG | 0.028 | 0.35 (0.13-0.89) | 0.164 | 0.41 (0.12-1.43) |
| EGFR mutation | 0.598 | 0.79 (0.34-1.88) | - | - |
| Clinical stage | 0.007 | 0.56 (0.37-0.85) | 0.128 | 0.69 (0.43-1.11) |
| Lines of therapy | 0.002 | 0.67 (0.52-0.86) | 0.438 | 0.89 (0.65-1.20) |
| NLR pre | 0.398 | 0.98 (0.93-1.03) | - | - |
| NLR post | <0.001 | 0.84 (0.76-0.93) | 0.003 | 0.85 (0.77-0.95) |
Fig.10 Evaluation of the multimodal model. A,B: ROC curves of the multimodal model in training group (A) and validation group (B). C: Nomogram for predicting the efficacy of ICIs treatment in aNSCLC. D,E: Calibration curves for the Nomogram in training group (D) and validation group (E). F,G: Decision curve analysis for the multimodal model in training group (F) and validation group (G).
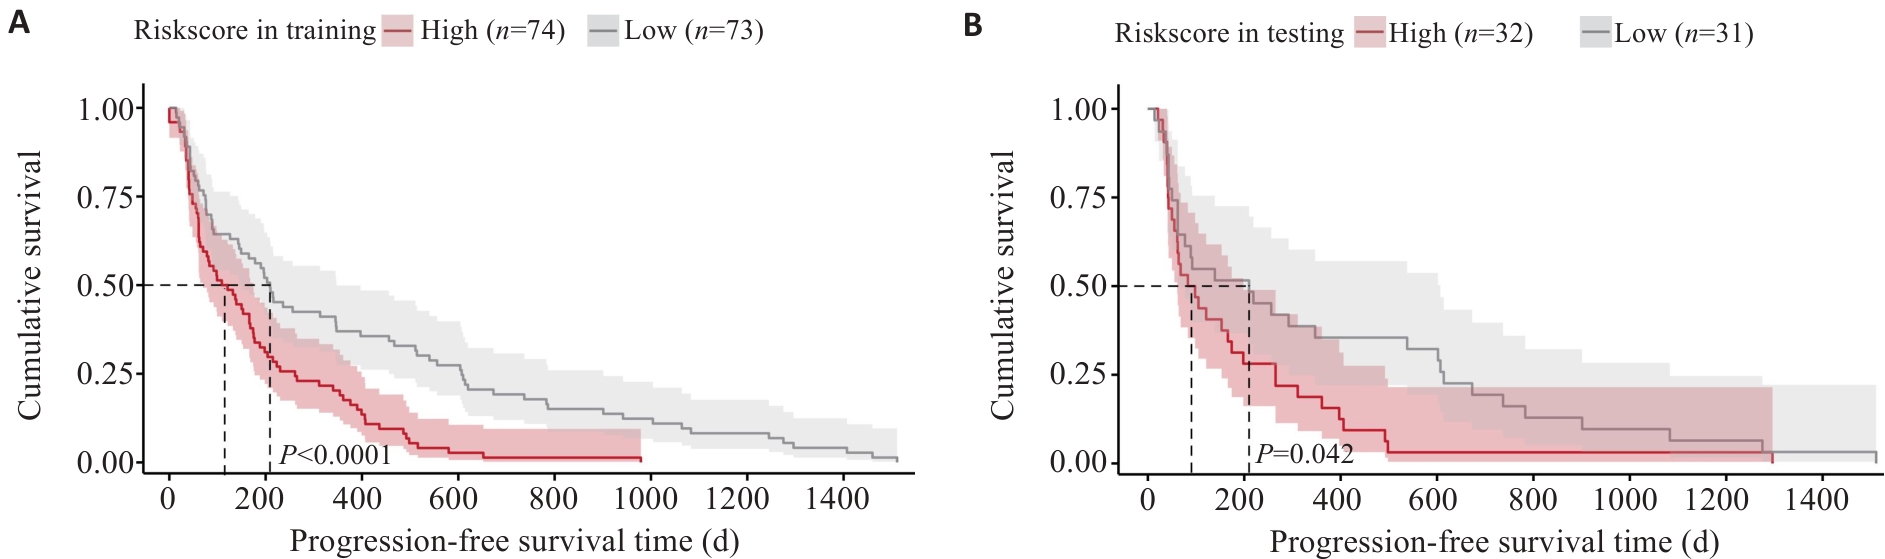
Fig.11 Kaplan-Meier progression-free survival curve analysis for the radiomics model in the training group (A) and validation group (B).
| [1] | Siegel RL, Giaquinto AN, Jemal A. Cancer statistics, 2024[J]. CA A Cancer J Clinicians, 2024, 74(1): 12-49. doi:10.3322/caac.21820 |
| [2] | Mok TSK, Wu YL, Kudaba I, et al. Pembrolizumab versus chemotherapy for previously untreated, PD-L1-expressing, locally advanced or metastatic non-small-cell lung cancer (KEYNOTE-042): a randomised, open-label, controlled, phase 3 trial[J]. Lancet, 2019, 393(10183): 1819-30. |
| [3] | Wu YL, Zhang L, Fan Y, et al. Randomized clinical trial of pembrolizumab vs chemotherapy for previously untreated Chinese patients with PD-L1-positive locally advanced or metastatic non-small-cell lung cancer: KEYNOTE-042 China Study[J]. Int J Cancer, 2021, 148(9): 2313-20. doi:10.1002/ijc.33399 |
| [4] | Gray J, Rodríguez-Abreu D, Powell SF, et al. FP13.02 pembrolizumab + pemetrexed-platinum vs pemetrexed-platinum for metastatic NSCLC: 4-year follow-up from KEYNOTE-189[J]. J Thorac Oncol, 2021, 16(3): S224. doi:10.1016/j.jtho.2021.01.141 |
| [5] | Robinson AG, Vicente D, Tafreshi A, et al. 97O First-line pembrolizumab plus chemotherapy for patients with advanced squamous NSCLC: 3-year follow-up from KEYNOTE-407[J]. J Thorac Oncol, 2021, 16(4): S748-9. doi:10.1016/s1556-0864(21)01939-0 |
| [6] | André T, Shiu KK, Kim TW, et al. Pembrolizumab in microsatellite-instability-high advanced colorectal cancer[J]. N Engl J Med, 2020, 383(23): 2207-18. doi:10.1056/nejmoa2017699 |
| [7] | Samstein RM, Lee CH, Shoushtari AN, et al. Tumor mutational load predicts survival after immunotherapy across multiple cancer types[J]. Nat Genet, 2019, 51(2): 202-6. doi:10.1038/s41588-018-0312-8 |
| [8] | Kim K, Khang D. Past, present, and future of anticancer nanomedicine[J]. Int J Nanomedicine, 2020, 15: 5719-43. doi:10.2147/ijn.s254774 |
| [9] | Freitas-Dias C, Gonçalves F, Martins F, et al. Interaction between NSCLC cells, CD8+ T-cells and immune checkpoint inhibitors potentiates coagulation and promotes metabolic remodeling-new cues on CAT-VTE[J]. Cells, 2024, 13(4): 305. doi:10.3390/cells13040305 |
| [10] | He BX, Dong D, She YL, et al. Predicting response to immunotherapy in advanced non-small-cell lung cancer using tumor mutational burden radiomic biomarker[J]. J Immunother Cancer, 2020, 8(2): e000550. doi:10.1136/jitc-2020-000550 |
| [11] | Sun R, Limkin EJ, Vakalopoulou M, et al. A radiomics approach to assess tumour-infiltrating CD8 cells and response to anti-PD-1 or anti-PD-L1 immunotherapy: an imaging biomarker, retrospective multicohort study[J]. Lancet Oncol, 2018, 19(9): 1180-91. doi:10.1016/s1470-2045(18)30413-3 |
| [12] | Tomassini S, Falcionelli N, Bruschi G, et al. On-cloud decision-support system for non-small cell lung cancer histology characterization from Thorax computed tomography scans[J]. Comput Med Imaging Graph, 2023, 110: 102310. doi:10.1016/j.compmedimag.2023.102310 |
| [13] | Clark K, Vendt B, Smith K, et al. The cancer imaging archive (TCIA): maintaining and operating a public information repository[J]. J Digit Imag, 2013, 26(6): 1045-57. doi:10.1007/s10278-013-9622-7 |
| [14] | Rizvi NA, Hellmann MD, Snyder A, et al. Cancer immunology. Mutational landscape determines sensitivity to PD-1 blockade in non-small cell lung cancer[J]. Science, 2015, 348(6230): 124-8. doi:10.1126/science.aaa1348 |
| [15] | Leek JT, Johnson WE, Parker HS, et al. The sva package for removing batch effects and other unwanted variation in high-throughput experiments[J]. Bioinformatics, 2012, 28(6): 882-3. doi:10.1093/bioinformatics/bts034 |
| [16] | Langfelder P, Horvath S. WGCNA: an R package for weighted correlation network analysis[J]. BMC Bioinformatics, 2008, 9: 559. doi:10.1186/1471-2105-9-559 |
| [17] | Langfelder P, Horvath S. Fast R functions for robust correlations and hierarchical clustering[J]. J Stat Softw, 2012, 46(11): i11. doi:10.18637/jss.v046.i11 |
| [18] | Liu HW, Zhang W, Zhang YH, et al. Mime: a flexible machine-learning framework to construct and visualize models for clinical characteristics prediction and feature selection[J]. Comput Struct Biotechnol J, 2024, 23: 2798-810. doi:10.1016/j.csbj.2024.06.035 |
| [19] | Wu TZ, Hu EQ, Xu SB, et al. clusterProfiler 4.0: a universal enrichment tool for interpreting omics data[J]. Innovation (Camb), 2021, 2(3): 100141. doi:10.1016/j.xinn.2021.100141 |
| [20] | Hänzelmann S, Castelo R, Guinney J. GSVA gene set variation analysis for microarray and RNA-seq data[J]. BMC Bioinformatics, 2013, 14: 7. doi:10.1186/1471-2105-14-7 |
| [21] | Yoshihara K, Shahmoradgoli M, Martínez E, et al. Inferring tumour purity and stromal and immune cell admixture from expression data[J]. Nat Commun, 2013, 4: 2612. doi:10.1038/ncomms3612 |
| [22] | Jiang P, Gu SQ, Pan D, et al. Signatures of T cell dysfunction and exclusion predict cancer immunotherapy response[J]. Nat Med, 2018, 24(10): 1550-8. doi:10.1038/s41591-018-0136-1 |
| [23] | Vickers AJ, Cronin AM, Elkin EB, et al. Extensions to decision curve analysis, a novel method for evaluating diagnostic tests, prediction models and molecular markers[J]. BMC Med Inform Decis Mak, 2008, 8: 53. doi:10.1186/1472-6947-8-53 |
| [24] | Meng XJ, Huang ZQ, Teng FF, et al. Predictive biomarkers in PD-1/PD-L1 checkpoint blockade immunotherapy[J]. Cancer Treat Rev, 2015, 41(10): 868-76. doi:10.1016/j.ctrv.2015.11.001 |
| [25] | Scholler N, Perbost R, Locke FL, et al. Tumor immune contexture is a determinant of anti-CD19 CAR T cell efficacy in large B cell lymphoma[J]. Nat Med, 2022, 28(9): 1872-82. doi:10.1038/s41591-022-01916-x |
| [26] | Huang YH, Wei LH, Hu YL, et al. Multi-parametric MRI-based radiomics models for predicting molecular subtype and androgen receptor expression in breast cancer[J]. Front Oncol, 2021, 11: 706733. doi:10.3389/fonc.2021.706733 |
| [27] | Wang GZ, Ding FE, Chen KG, et al. CT-based radiomics nomogram to predict proliferative hepatocellular carcinoma and explore the tumor microenvironment[J]. J Transl Med, 2024, 22(1): 683. doi:10.1186/s12967-024-05393-3 |
| [28] | Campesato LF, Barroso-Sousa R, Jimenez L, et al. Comprehensive cancer-gene panels can be used to estimate mutational load and predict clinical benefit to PD-1 blockade in clinical practice[J]. Oncotarget, 2015, 6(33): 34221-7. doi:10.18632/oncotarget.5950 |
| [29] | Zhou ZH, Guo WJ, Liu DQ, et al. Multiparameter prediction model of immune checkpoint inhibitors combined with chemotherapy for non-small cell lung cancer based on support vector machine learning[J]. Sci Rep, 2023, 13(1): 4469. doi:10.1038/s41598-023-31189-4 |
| [30] | Yang B, Zhou L, Zhong J, et al. Combination of computed tomography imaging-based radiomics and clinicopathological characteristics for predicting the clinical benefits of immune checkpoint inhibitors in lung cancer[J]. Respir Res, 2021, 22(1): 189. doi:10.1186/s12931-021-01780-2 |
| [31] | Liu YP, Jiao Y, He D, et al. Deriving time-varying cellular motility parameters via wavelet analysis[J]. Phys Biol, 2021, 18(4): 046007. doi:10.1088/1478-3975/abfcad |
| [32] | McNamara MG, Templeton AJ, Maganti M, et al. Neutrophil/lymphocyte ratio as a prognostic factor in biliary tract cancer[J]. Eur J Cancer, 2014, 50(9): 1581-9. doi:10.1016/j.ejca.2014.02.015 |
| [33] | Viers BR, Boorjian SA, Frank I, et al. Pretreatment neutrophil-to-lymphocyte ratio is associated with advanced pathologic tumor stage and increased cancer-specific mortality among patients with urothelial carcinoma of the bladder undergoing radical cystectomy[J]. Eur Urol, 2014, 66(6): 1157-64. doi:10.1016/j.eururo.2014.02.042 |
| [34] | Valero C, Lee M, Hoen D, et al. Pretreatment neutrophil-to-lymphocyte ratio and mutational burden as biomarkers of tumor response to immune checkpoint inhibitors[J]. Nat Commun, 2021, 12(1): 729. doi:10.1038/s41467-021-20935-9 |
| [35] | Bryant AK, Sankar K, Strohbehn GW, et al. Prognostic and predictive value of neutrophil-to-lymphocyte ratio with adjuvant immunotherapy in stage III non-small-cell lung cancer[J]. Lung Cancer, 2022, 163: 35-41. doi:10.1016/j.lungcan.2021.11.021 |
| [1] | Zixian CHEN, Jiawei ZHOU, Lei TAN, Zhipeng HUANG, Kangyi XUE, Mingkun CHEN. A risk prediction model for prognosis and immunotherapy response in prostate cancer patients based on immunosuppressive neutrophil Neu_2 subsets [J]. Journal of Southern Medical University, 2025, 45(8): 1643-1653. |
| [2] | Lijun HE, Xiaofei CHEN, Chenxin YAN, Lin SHI. Inhibitory effect of Fuzheng Huaji Decoction against non-small cell lung cancer cells in vitro and the possible molecular mechanism [J]. Journal of Southern Medical University, 2025, 45(6): 1143-1152. |
| [3] | Dandan LI, Jiaxin CHU, Yan YAN, Wenjun XU, Xingchun ZHU, Yun SUN, Haofeng DING, Li REN, Bo ZHU. Curcumin inhibits lipid metabolism in non-small cell lung cancer by downregulating the HIF-1α pathway [J]. Journal of Southern Medical University, 2025, 45(5): 1039-1046. |
| [4] | Xiaojuan GUO, Ruijuan DU, Liping CHEN, Kelei GUO, Biao ZHOU, Hua BIAN, Li HAN. WW domain-containing ubiquitin E3 ligase 1 regulates immune infiltration in tumor microenvironment of ovarian cancer [J]. Journal of Southern Medical University, 2025, 45(5): 1063-1073. |
| [5] | Meimei CHEN, Yang WANG, Huangwei LEI, Fei ZHANG, Ruina HUANG, Zhaoyang YANG. Construction of recognition models for subthreshold depression based on multiple machine learning algorithms and vocal emotional characteristics [J]. Journal of Southern Medical University, 2025, 45(4): 711-717. |
| [6] | Na ZHONG, Huijie WANG, Wenying ZHAO, Zhengui SUN, Biao GENG. High RNF7 expression enhances PD-1 resistance of non-small cell lung cancer cells by promoting CXCL1 expression and myeloid-derived suppressor cell recruitment via activating NF-κB signaling [J]. Journal of Southern Medical University, 2024, 44(9): 1704-1711. |
| [7] | Lili CHEN, Tianyu WU, Ming ZHANG, Zixia DING, Yan ZHANG, Yiqing YANG, Jiaqian ZHENG, Xiaonan ZHANG. Identification of potential biomarkers and immunoregulatory mechanisms of rheumatoid arthritis based on multichip co-analysis of GEO database [J]. Journal of Southern Medical University, 2024, 44(6): 1098-1108. |
| [8] | Caiyu SHEN, Shuai WANG, Ruiying ZHOU, Yuhe WANG, Qin GAO, Xingzhi CHEN, Shu YANG. Prediction of risk of in-hospital death in patients with chronic heart failure complicated by lung infections using interpretable machine learning [J]. Journal of Southern Medical University, 2024, 44(6): 1141-1148. |
| [9] | Feifan LI, Junxin XIANG, Jiahui LIU, Xiaojing WANG, Hao JIANG. Overexpression of lncRNA FEZF1-AS1 promotes progression of non-small cell lung cancer via the miR-130a-5p/CCND1 axis [J]. Journal of Southern Medical University, 2024, 44(5): 841-850. |
| [10] | Zhiwei ZUO, Qingliang MENG, Jiakang CUI, Kelei GUO, Hua BIAN. An artificial neural network diagnostic model for scleroderma and immune cell infiltration analysis based on mitochondria-associated genes [J]. Journal of Southern Medical University, 2024, 44(5): 920-929. |
| [11] | SHAO Shan, BAI Weichao, ZHOU Pengcheng, LUO Minna, ZHAO Xinhan, LEI Jianjun. Metformin suppresses hypoxia-inducible factor-1α expression in cancer-associated fibroblasts to block tumor-stromal cross-talk in breast cancer [J]. Journal of Southern Medical University, 2024, 44(3): 428-436. |
| [12] | HAN Qiqi, YE Mengran, JIN Qili. Demethylzeylasteral inhibits proliferation, migration and invasion and promotes apoptosis of non-small cell lung cancer cells by inhibiting the AKT/CREB signaling pathway [J]. Journal of Southern Medical University, 2024, 44(2): 280-288. |
| [13] | LIU Yunze, LI Chengrun, GUO Juntang, LIU Yang. A clinical-radiomics nomogram for differentiating focal organizing pneumonia and lung adenocarcinoma [J]. Journal of Southern Medical University, 2024, 44(2): 397-404. |
| [14] | Xuerou LIU, Yumei YANG, Wei LIU, Zhen ZHANG, Xingqi ZHOU, Wenyu XIE, Lin SHEN, Mengxiao ZHANG, Xian LI, Jialan ZANG, Shanshan LI. Euphorbia helioscopia inhibits proliferation, invasion, and migration and promotes apoptosis of non-small cell lung cancer cells [J]. Journal of Southern Medical University, 2024, 44(10): 1918-1925. |
| [15] | Yumei YANG, Xuerou LIU, Wei LIU, Xingqi ZHOU, Zhen ZHANG, Yan HU, Peipei LIU, Xian LI, Hao LIU, Shanshan LI. Aumolertinib combined with anlotinib inhibits proliferation of non-small cell lung cancer cells by down-regulating the PI3K/AKT pathway [J]. Journal of Southern Medical University, 2024, 44(10): 1965-1975. |
| Viewed | ||||||
|
Full text |
|
|||||
|
Abstract |
|
|||||