南方医科大学学报 ›› 2026, Vol. 46 ›› Issue (2): 239-246.doi: 10.12122/j.issn.1673-4254.2026.02.01
• •
梁笑笑1( ), 栾慧林1, 马鹏珍2, 邓文珠1, 金佳欣1, 全晨阳1, 陈婷婷3, 杨友财1, 谢颖桢1()
收稿日期:2025-06-10
出版日期:2026-02-20
发布日期:2026-03-10
通讯作者:
谢颖桢
E-mail:lxx13286242364@163.com;xyz_3191@aliyun.com
作者简介:梁笑笑,在读博士研究生,E-mail: lxx13286242364@163.com
基金资助:
Xiaoxiao LIANG1(), Huilin LUAN1, Pengzhen MA2, Wenzhu DENG1, Jiaxin JIN1, Chenyang QUAN1, Tingting CHEN3, Youcai YANG1, Yingzhen XIE1()
Received:2025-06-10
Online:2026-02-20
Published:2026-03-10
Contact:
Yingzhen XIE
E-mail:lxx13286242364@163.com;xyz_3191@aliyun.com
摘要:
目的 探讨基于生命八要素(LE8)的心血管健康评分对急性缺血性脑卒中(AIS)患者90 d功能预后的影响,探究相关实验室指标在其中的中介作用。 方法 采用多中心前瞻性队列研究设计,纳入发病72 h内的急性缺血性脑卒中患者。收集患者临床资料,依据美国心脏协会定义的LE8标准计算心血管健康评分。通过电话随访及评估患者发病后90 d的功能预后。及改良Rankin量表(mRS)评分。应用多重线性回归分析LE8总评分及各单项评分与90 d mRS评分的关系。采用Lasso回归筛选与90 d mRS评分相关的实验室指标,并通过Bootstrap法进行中介效应分析,探究筛选出的指标在LE8评分与卒中预后关系中的中介作用。 结果 共纳入599例患者,校正混杂因素后,LE8总评分与90 d mRS评分呈负相关(β=-0.05,95% CI:-0.06,-0.041,P<0.001);LE8各单项评分:运动、饮食质量、尼古丁暴露、睡眠、体质量指数、胆固醇、血压均与90 d mRS评分呈负相关(P<0.05)。影响90 d mRS的检验指标中,纤维蛋白原(FIB)水平(β=0.215;95% CI:0.068,0.361;P=0.0041)与90 d mRS评分呈正相关,MCHC(β=-0.012;95% CI:-0.022,-0.002;P=0.0229)及HRR(β=-0.007;95% CI:-0.013,0.00;P=0.042)与90 d mRS评分呈负相关。中介效应分析显示,FIB在 LE8评分与90 d mRS评分的关系中起显著中介作用,间接效应为-0.0019(95% CI:-0.00381,0.00,P=0.006),中介效应比例为3.778%(95% CI:0.00869,0.08)。 结论 基于LE8评分的心血管健康评分与AIS患者90 d功能预后呈负相关,提示维持良好的心血管健康水平对改善卒中预后至关重要。血凝及炎症相关指标FIB及红细胞参数MCHC、HRR与预后不良相关,其中FIB在LE8评分影响卒中预后的过程中发挥部分中介作用,为卒中二级预防提供依据。
梁笑笑, 栾慧林, 马鹏珍, 邓文珠, 金佳欣, 全晨阳, 陈婷婷, 杨友财, 谢颖桢. 基于生命八要素的心血管健康评分与缺血性脑卒中预后相关性及临床检验指标的中介效应:一项多中心前瞻性队列研究[J]. 南方医科大学学报, 2026, 46(2): 239-246.
Xiaoxiao LIANG, Huilin LUAN, Pengzhen MA, Wenzhu DENG, Jiaxin JIN, Chenyang QUAN, Tingting CHEN, Youcai YANG, Yingzhen XIE. Correlation between cardiovascular health score based on eight life factors and prognosis of ischemic stroke and mediating effect of clinical test indicators: a multicenter prospective cohort study[J]. Journal of Southern Medical University, 2026, 46(2): 239-246.
| Characteristics | LE8 quartile grouping | |||||
|---|---|---|---|---|---|---|
| 1 (n=152) | 2 (n=152) | 3 (n=155) | 4 (n=140) | t/c2/Z | P | |
| Age (year) | 67 (59,73)b | 62 (54, 73)a | 64.26 (58, 72) | 63.5 (58, 71)a | 8.826 | 0.032 |
| Male [n (%)] | 101 (66.4) | 115 (75.7) | 108 (69.7) | 100 (71.4) | 3.248 | 0.355 |
| Drinking [n (%)] | 69 (45.4) | 72 (47.4) | 67 (43.2) | 71 (50.7) | 1.786 | 0.618 |
| Alcohol abuse [n (%)] | 92 (60.5) | 104 (68.4) | 85 (54.8) | 80 (57.1) | 6.703 | 0.082 |
| BMI [kg/m², Median (P25, P75)] | 29 (25.53, 32.40)b | 26.95 (23.56, 30.90)ac | 25.70 (222.40, 29.20)ab | 24.49 (23.00, 27.18)ab | 66.077 | <0.001 |
| Hypertension [n (%)] | 108 (71.1) | 117 (77.0) | 127 (81.9) | 97 (69.3)c | 7.984 | 0.046 |
| Diabetes [n (%)] | 58 (38.2) | 71 (46.7) | 72 (46.5) | 68 (48.6) | 3.908 | 0.272 |
| Hyperlipemia [n (%)] | 64 (42.1) | 57 (37.5) | 73 (47.1) | 48 (34.3) | 5.775 | 0.123 |
| Coronary heart disease [n (%)] | 39 (25.7) | 31 (20.4) | 37 (23.9) | 25 (17.9) | 3.126 | 0.373 |
| Atrial fibrillation [n (%)] | 7 (4.6) | 8 (5.3) | 10 (6.5) | 7 (5.0) | 0.575 | 0.902 |
| Stroke [n (%)] | 55 (36.2) | 47 (30.9) | 48 (31.0) | 41 (29.3) | 1.854 | 0.603 |
| NIHSS (score) | 3 (1.87, 7)c | 3 (2, 5)c | 2 (1, 4)ab | 2 (1, 4)ab | 24.211 | <0.001 |
| mRS (score) | 2.50 (1, 4)b | 1 (0, 2)c | 1 (0, 2)ab | 1 (0, 1)ab | 105.189 | <0.001 |
表1 LE8评分四分位组人群基本情况比较
Tab.1 Comparison of general data of the patients in the LE8 score quartile groups
| Characteristics | LE8 quartile grouping | |||||
|---|---|---|---|---|---|---|
| 1 (n=152) | 2 (n=152) | 3 (n=155) | 4 (n=140) | t/c2/Z | P | |
| Age (year) | 67 (59,73)b | 62 (54, 73)a | 64.26 (58, 72) | 63.5 (58, 71)a | 8.826 | 0.032 |
| Male [n (%)] | 101 (66.4) | 115 (75.7) | 108 (69.7) | 100 (71.4) | 3.248 | 0.355 |
| Drinking [n (%)] | 69 (45.4) | 72 (47.4) | 67 (43.2) | 71 (50.7) | 1.786 | 0.618 |
| Alcohol abuse [n (%)] | 92 (60.5) | 104 (68.4) | 85 (54.8) | 80 (57.1) | 6.703 | 0.082 |
| BMI [kg/m², Median (P25, P75)] | 29 (25.53, 32.40)b | 26.95 (23.56, 30.90)ac | 25.70 (222.40, 29.20)ab | 24.49 (23.00, 27.18)ab | 66.077 | <0.001 |
| Hypertension [n (%)] | 108 (71.1) | 117 (77.0) | 127 (81.9) | 97 (69.3)c | 7.984 | 0.046 |
| Diabetes [n (%)] | 58 (38.2) | 71 (46.7) | 72 (46.5) | 68 (48.6) | 3.908 | 0.272 |
| Hyperlipemia [n (%)] | 64 (42.1) | 57 (37.5) | 73 (47.1) | 48 (34.3) | 5.775 | 0.123 |
| Coronary heart disease [n (%)] | 39 (25.7) | 31 (20.4) | 37 (23.9) | 25 (17.9) | 3.126 | 0.373 |
| Atrial fibrillation [n (%)] | 7 (4.6) | 8 (5.3) | 10 (6.5) | 7 (5.0) | 0.575 | 0.902 |
| Stroke [n (%)] | 55 (36.2) | 47 (30.9) | 48 (31.0) | 41 (29.3) | 1.854 | 0.603 |
| NIHSS (score) | 3 (1.87, 7)c | 3 (2, 5)c | 2 (1, 4)ab | 2 (1, 4)ab | 24.211 | <0.001 |
| mRS (score) | 2.50 (1, 4)b | 1 (0, 2)c | 1 (0, 2)ab | 1 (0, 1)ab | 105.189 | <0.001 |
| Variable | Model 1 | Model 2 | Model 3 | ||||||
|---|---|---|---|---|---|---|---|---|---|
| β | 95%CI | P | β | 95% CI | P | β | 95% CI | P | |
| Physical activity score | -0.011 | -0.015, -0.008 | <0.001 | -0.01 | -0.013,-0.007 | <0.001 | -0.009 | -0.012, -0.005 | <0.001 |
| Dash diet score | -0.017 | -0.022, -0.012 | <0.001 | -0.016 | -0.02,-0.011 | <0.001 | -0.014 | -0.019, -0.009 | <0.001 |
| Nicotine exposure score | -0.004 | -0.007, 0.00 | 0.0429 | -0.006 | -0.01,-0.002 | <0.001 | -0.005 | -0.008, -0.001 | 0.0057 |
| Sleep health score | -0.016 | -0.019, -0.012 | <0.001 | -0.015 | -0.019, -0.012 | <0.001 | -0.014 | -0.017, -0.01 | <0.001 |
| Body mass index score | -0.005 | -0.009, -0.001 | 0.0115 | -0.005 | -0.008, -0.001 | 0.0122 | -0.006 | -0.009, -0.002 | 0.0012 |
| Blood lipid score | -0.009 | -0.013, -0.005 | <0.001 | -0.009 | -0.013, -0.005 | <0.001 | -0.007 | -0.011, -0.003 | <0.001 |
| Blood glucose score | -0.003 | -0.006, 0.001 | 0.1543 | -0.002 | -0.005,0.002 | 0.3338 | 0.000 | -0.004, 0.003 | 0.924 |
| Blood pressure score | -0.009 | -0.013, -0.004 | <0.001 | -0.009 | -0.013, -0.004 | <0.001 | -0.007 | -0.012, -0.003 | <0.001 |
表3 LE8单个因素评分与mRS评分的线性回归分析
Tab.3 Linear regression analysis of LE8 single factor score and mRS score
| Variable | Model 1 | Model 2 | Model 3 | ||||||
|---|---|---|---|---|---|---|---|---|---|
| β | 95%CI | P | β | 95% CI | P | β | 95% CI | P | |
| Physical activity score | -0.011 | -0.015, -0.008 | <0.001 | -0.01 | -0.013,-0.007 | <0.001 | -0.009 | -0.012, -0.005 | <0.001 |
| Dash diet score | -0.017 | -0.022, -0.012 | <0.001 | -0.016 | -0.02,-0.011 | <0.001 | -0.014 | -0.019, -0.009 | <0.001 |
| Nicotine exposure score | -0.004 | -0.007, 0.00 | 0.0429 | -0.006 | -0.01,-0.002 | <0.001 | -0.005 | -0.008, -0.001 | 0.0057 |
| Sleep health score | -0.016 | -0.019, -0.012 | <0.001 | -0.015 | -0.019, -0.012 | <0.001 | -0.014 | -0.017, -0.01 | <0.001 |
| Body mass index score | -0.005 | -0.009, -0.001 | 0.0115 | -0.005 | -0.008, -0.001 | 0.0122 | -0.006 | -0.009, -0.002 | 0.0012 |
| Blood lipid score | -0.009 | -0.013, -0.005 | <0.001 | -0.009 | -0.013, -0.005 | <0.001 | -0.007 | -0.011, -0.003 | <0.001 |
| Blood glucose score | -0.003 | -0.006, 0.001 | 0.1543 | -0.002 | -0.005,0.002 | 0.3338 | 0.000 | -0.004, 0.003 | 0.924 |
| Blood pressure score | -0.009 | -0.013, -0.004 | <0.001 | -0.009 | -0.013, -0.004 | <0.001 | -0.007 | -0.012, -0.003 | <0.001 |
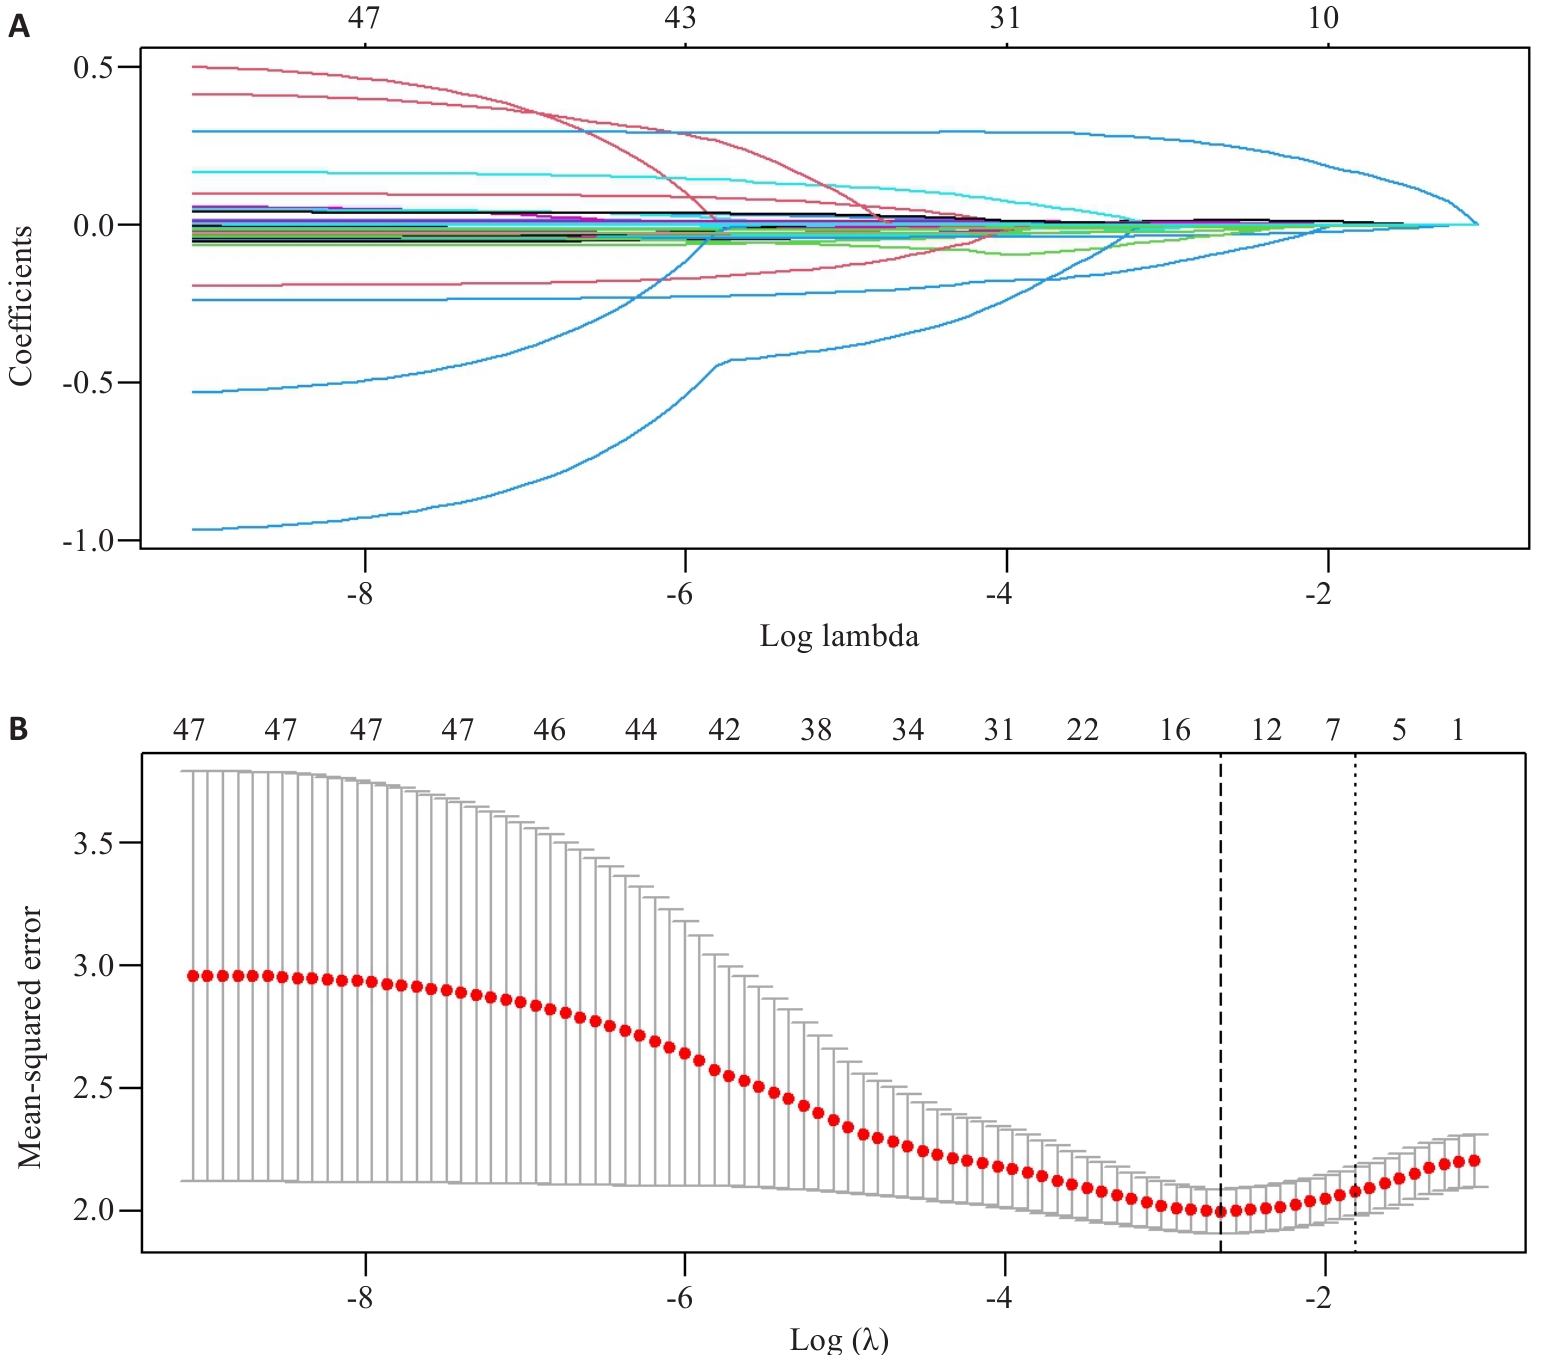
图1 基于Lasso回归的变量选择
Fig.1 Variable selection based on Lasso regression. A: Lasso coefficients for 47 clinical features. B: Ten-fold cross-validation of the Lasso regression model.
| Variable | Univariate analysis | Multivariate analysis | ||||
|---|---|---|---|---|---|---|
| β | 95% CI | P | β | 95% CI | P | |
| WBC (×109/L) | 0.023 | -0.022, 0.067 | 0.3152 | |||
| RBC (×1012/L) | -0.04 | -0.113, 0.033 | 0.2847 | |||
| MCHC (g/L) | -0.02 | -0.031, -0.009 | <0.001 | -0.012 | -0.022, -0.002 | 0.0229 |
| MCH (pg) | -0.051 | -0.105, 0.003 | 0.063 | |||
| HGB (g/L) | -0.014 | -0.02, -0.008 | <0.001 | |||
| RDW (%) | 0.019 | -0.02, 0.057 | 0.3385 | |||
| NE% (%) | 0.031 | 0.019, 0.043 | <0.001 | 0.007 | -0.023, 0.036 | 0.6578 |
| NE# (×109/L) | 0.078 | 0.027, 0.129 | 0.0028 | |||
| LY% (%) | -0.036 | -0.05, -0.022 | <0.001 | -0.01 | -0.044, 0.023 | 0.5555 |
| LY# (×109/L) | -0.271 | -0.413, -0.129 | <0.001 | |||
| MO% (%) | -0.038 | -0.097, 0.02 | 0.1959 | |||
| MO# (×109/L) | 0.053 | -0.385, 0.491 | 0.812 | |||
| PLT (×109/L) | 0.000 | -0.002, 0.002 | 0.8917 | |||
| NLR | 0.063 | 0.028, 0.098 | <0.001 | |||
| HRR (g/dL) | -0.015 | -0.021, -0.009 | <0.001 | -0.007 | -0.013, 0 | 0.042 |
| K (mmol/L) | -0.062 | -0.39, 0.265 | 0.7087 | |||
| NA (mmol/L) | 0.00 | -0.041, 0.04 | 0.9869 | |||
| CL (mmol/L) | 0.00 | -0.035, 0.034 | 0.998 | |||
| UREA (mmol/L) | 0.076 | 0.014, 0.138 | 0.0166 | |||
| Cr (μmol/L) | 0.007 | 0.002, 0.011 | 0.0074 | |||
| UA (μmol/L) | -0.001 | -0.002, 0.001 | 0.3646 | |||
| TP (g/L) | 0.004 | -0.001, 0.009 | 0.1576 | |||
| ALB (g/L) | -0.067 | -0.093, -0.041 | <0.001 | -0.02 | -0.047, 0.007 | 0.1469 |
| Glb (g/L) | 0.006 | -0.019, 0.031 | 0.6243 | |||
| A/G | -0.588 | -0.977, -0.20 | 0.0031 | |||
| AST (U/L) | -0.003 | -0.012, 0.006 | 0.5436 | |||
| ALT (U/L) | -0.002 | -0.01, 0.005 | 0.5344 | |||
| GGT (U/L) | -0.002 | -0.005, 0.001 | 0.2419 | |||
| ALP (U/L) | 0.004 | -0.002, 0.01 | 0.1965 | |||
| TBIL (μmol/L) | -0.005 | -0.021, 0.011 | 0.5389 | |||
| DBIL (μmol/L) | 0.013 | -0.038, 0.065 | 0.6095 | |||
| IBIL (μmol/L) | -0.01 | -0.03, 0.01 | 0.3184 | |||
| TC (mmol/L) | 0.022 | -0.09, 0.134 | 0.6954 | |||
| TG (mmol/L) | -0.145 | -0.273, -0.016 | 0.0273 | |||
| HDL-C (mmol/L) | -0.057 | -0.531, 0.418 | 0.8151 | |||
| LDL-C (mmol/L) | 0.051 | -0.092, 0.194 | 0.4821 | |||
| HCY (μmol/L) | 0.009 | 0.001, 0.018 | 0.0297 | |||
| FBG (mmol/L) | 0.015 | -0.02, 0.049 | 0.4078 | |||
| TyG | -0.152 | -0.332, 0.029 | 0.1005 | |||
| Non-HDL-C (mmol/L) | 0.027 | -0.095, 0.149 | 0.6686 | |||
| PTA (%) | 0.001 | -0.007, 0.01 | 0.7792 | |||
| D-D (μg/L) | 0.00 | 0.00, 0.00 | 0.0759 | |||
| PT (s) | 0.032 | -0.052, 0.116 | 0.4544 | |||
| INR | 0.303 | -0.883, 1.489 | 0.6161 | |||
| APTT (s) | -0.023 | -0.05, 0.004 | 0.0997 | |||
| FIB (g/L) | 0.441 | 0.292, 0.591 | <0.001 | 0.215 | 0.068, 0.361 | 0.0041 |
| TT (s) | -0.005 | -0.023, 0.013 | 0.6089 | |||
表4 各项指标与mRS评分的单因素、多因素分析
Tab.4 Univariate and multivariate analysis of various laboratory parameters and mRS scores of the patients
| Variable | Univariate analysis | Multivariate analysis | ||||
|---|---|---|---|---|---|---|
| β | 95% CI | P | β | 95% CI | P | |
| WBC (×109/L) | 0.023 | -0.022, 0.067 | 0.3152 | |||
| RBC (×1012/L) | -0.04 | -0.113, 0.033 | 0.2847 | |||
| MCHC (g/L) | -0.02 | -0.031, -0.009 | <0.001 | -0.012 | -0.022, -0.002 | 0.0229 |
| MCH (pg) | -0.051 | -0.105, 0.003 | 0.063 | |||
| HGB (g/L) | -0.014 | -0.02, -0.008 | <0.001 | |||
| RDW (%) | 0.019 | -0.02, 0.057 | 0.3385 | |||
| NE% (%) | 0.031 | 0.019, 0.043 | <0.001 | 0.007 | -0.023, 0.036 | 0.6578 |
| NE# (×109/L) | 0.078 | 0.027, 0.129 | 0.0028 | |||
| LY% (%) | -0.036 | -0.05, -0.022 | <0.001 | -0.01 | -0.044, 0.023 | 0.5555 |
| LY# (×109/L) | -0.271 | -0.413, -0.129 | <0.001 | |||
| MO% (%) | -0.038 | -0.097, 0.02 | 0.1959 | |||
| MO# (×109/L) | 0.053 | -0.385, 0.491 | 0.812 | |||
| PLT (×109/L) | 0.000 | -0.002, 0.002 | 0.8917 | |||
| NLR | 0.063 | 0.028, 0.098 | <0.001 | |||
| HRR (g/dL) | -0.015 | -0.021, -0.009 | <0.001 | -0.007 | -0.013, 0 | 0.042 |
| K (mmol/L) | -0.062 | -0.39, 0.265 | 0.7087 | |||
| NA (mmol/L) | 0.00 | -0.041, 0.04 | 0.9869 | |||
| CL (mmol/L) | 0.00 | -0.035, 0.034 | 0.998 | |||
| UREA (mmol/L) | 0.076 | 0.014, 0.138 | 0.0166 | |||
| Cr (μmol/L) | 0.007 | 0.002, 0.011 | 0.0074 | |||
| UA (μmol/L) | -0.001 | -0.002, 0.001 | 0.3646 | |||
| TP (g/L) | 0.004 | -0.001, 0.009 | 0.1576 | |||
| ALB (g/L) | -0.067 | -0.093, -0.041 | <0.001 | -0.02 | -0.047, 0.007 | 0.1469 |
| Glb (g/L) | 0.006 | -0.019, 0.031 | 0.6243 | |||
| A/G | -0.588 | -0.977, -0.20 | 0.0031 | |||
| AST (U/L) | -0.003 | -0.012, 0.006 | 0.5436 | |||
| ALT (U/L) | -0.002 | -0.01, 0.005 | 0.5344 | |||
| GGT (U/L) | -0.002 | -0.005, 0.001 | 0.2419 | |||
| ALP (U/L) | 0.004 | -0.002, 0.01 | 0.1965 | |||
| TBIL (μmol/L) | -0.005 | -0.021, 0.011 | 0.5389 | |||
| DBIL (μmol/L) | 0.013 | -0.038, 0.065 | 0.6095 | |||
| IBIL (μmol/L) | -0.01 | -0.03, 0.01 | 0.3184 | |||
| TC (mmol/L) | 0.022 | -0.09, 0.134 | 0.6954 | |||
| TG (mmol/L) | -0.145 | -0.273, -0.016 | 0.0273 | |||
| HDL-C (mmol/L) | -0.057 | -0.531, 0.418 | 0.8151 | |||
| LDL-C (mmol/L) | 0.051 | -0.092, 0.194 | 0.4821 | |||
| HCY (μmol/L) | 0.009 | 0.001, 0.018 | 0.0297 | |||
| FBG (mmol/L) | 0.015 | -0.02, 0.049 | 0.4078 | |||
| TyG | -0.152 | -0.332, 0.029 | 0.1005 | |||
| Non-HDL-C (mmol/L) | 0.027 | -0.095, 0.149 | 0.6686 | |||
| PTA (%) | 0.001 | -0.007, 0.01 | 0.7792 | |||
| D-D (μg/L) | 0.00 | 0.00, 0.00 | 0.0759 | |||
| PT (s) | 0.032 | -0.052, 0.116 | 0.4544 | |||
| INR | 0.303 | -0.883, 1.489 | 0.6161 | |||
| APTT (s) | -0.023 | -0.05, 0.004 | 0.0997 | |||
| FIB (g/L) | 0.441 | 0.292, 0.591 | <0.001 | 0.215 | 0.068, 0.361 | 0.0041 |
| TT (s) | -0.005 | -0.023, 0.013 | 0.6089 | |||
| Mediator variable | Indirect effect | Direct effect | Proportion of intermediary effect [% (95% CI)] | ||
|---|---|---|---|---|---|
| 95% CI | P | 95% CI | P | ||
| MCHC (g/L) | -0.0005 (-0.0018, 0.00) | 0.310 | -0.0498 (-0.0595, -0.04) | <0.001 | 0.0103 (-0.0091, 0.04) |
| HRR (g/dL) | 0.0002 (-0.0013, 0.00) | 0.800 | -0.0505 (-0.0603, -0.04) | <0.001 | -0.0036 (-0.0345, 0.03) |
| FIB (g/L) | -0.0019 (-0.0038, 0.00) | 0.006 | -0.0484 (-0.0582, -0.04) | <0.001 | 0.0378 (0.0087, 0.08) |
表5 指标在LE8评分-mRS评分中的中介效应分析
Tab.5 Analysis of mediating effect of the selected laboratory parameters in LE8 score‑mRS score relationship
| Mediator variable | Indirect effect | Direct effect | Proportion of intermediary effect [% (95% CI)] | ||
|---|---|---|---|---|---|
| 95% CI | P | 95% CI | P | ||
| MCHC (g/L) | -0.0005 (-0.0018, 0.00) | 0.310 | -0.0498 (-0.0595, -0.04) | <0.001 | 0.0103 (-0.0091, 0.04) |
| HRR (g/dL) | 0.0002 (-0.0013, 0.00) | 0.800 | -0.0505 (-0.0603, -0.04) | <0.001 | -0.0036 (-0.0345, 0.03) |
| FIB (g/L) | -0.0019 (-0.0038, 0.00) | 0.006 | -0.0484 (-0.0582, -0.04) | <0.001 | 0.0378 (0.0087, 0.08) |
| [1] | Feigin VL, Stark BA, Johnson CO, et al. Global, regional, and national burden of stroke and its risk factors, 1990–2019: a systematic analysis for the Global Burden of Disease Study 2019[J]. Lancet Neurol, 2021, 20(10): 795-820. |
| [2] | 北京高血压防治协会, 北京糖尿病防治协会, 北京慢性病防治与健康教育研究会, 等. 基层心血管病综合管理实践指南2020[J]. 中国医学前沿杂志(电子版), 2020, 12(8): 1-73. |
| [3] | 王蓉蓉, 王守宝, 杜冠华. 线粒体相关内质网膜在缺血性脑卒中的作用[J]. 中国药理学通报, 2019, 35(6): 761-5. |
| [4] | Sayre NL, Sifuentes M, Holstein D, et al. Stimulation of astrocyte fatty acid oxidation by thyroid hormone is protective against ischemic stroke-induced damage[J]. J Cereb Blood Flow Metab, 2017, 37(2): 514-27. doi:10.1177/0271678x16629153 |
| [5] | Zhang JR, Dong DW, Zeng Y, et al. The association between stress hyperglycemia and unfavorable outcomes in patients with anterior circulation stroke after mechanical thrombectomy[J]. Front Aging Neurosci, 2023, 14: 1071377. doi:10.3389/fnagi.2022.1071377 |
| [6] | Shimoyama T, Shibazaki K, Kimura K, et al. Admission hyperglycemia causes infarct volume expansion in patients with ICA or MCA occlusion: association of collateral grade on conventional angiography[J]. Eur J Neurol, 2013, 20(1): 109-16. doi:10.1111/j.1468-1331.2012.03801.x |
| [7] | Lloyd-Jones DM, Allen NB, Anderson CAM, et al. Life's essential 8: updating and enhancing the American heart association's construct of cardiovascular health: a presidential advisory from the American heart association[J]. Circulation, 2022, 146(5): e18-43. doi:10.1161/cir.0000000000001078 |
| [8] | Ma RC, Song JT, Ding YC. Associations between Life's Essential 8 and post-stroke depression and all-cause mortality among US adults[J]. Eur J Med Res, 2024, 29(1): 229. doi:10.1186/s40001-024-01834-3 |
| [9] | Liu Y, Qin X, Jiang J, et al. Life's essential 8 trajectories and risk of stroke: a prospective cohort study[J]. Stroke, 2024, 55(11): 2611-21. doi:10.1161/strokeaha.124.046352 |
| [10] | 中华医学会神经病学分会, 中华医学会神经病学分会脑血管病学组. 中国急性缺血性卒中诊治指南2023[J]. 中华神经科杂志, 2024,57(6): 523-59. |
| [11] | Wu S, Wu Z, Yu D, et al. Life's essential 8 and risk of stroke: a prospective community-based study[J]. Stroke, 2023, 54(9): 2369-79. doi:10.1161/strokeaha.123.042525 |
| [12] | Yan B, Jin Y, Mao S, et al. Association of Life's essential 8 score with the risk of all-cause mortality and cardio-cerebrovascular mortality in patients with stroke[J]. BMC Cardiovasc Disord, 2024, 24(1): 320. doi:10.1186/s12872-024-03947-3 |
| [13] | Xing A, Tian X, Wang Y, et al. 'Life's Essential 8' cardiovascular health with premature cardiovascular disease and all-cause mortality in young adults: the Kailuan prospective cohort study[J]. Eur J Prev Cardiol, 2023, 30(7): 593-600. doi:10.1093/eurjpc/zwad033 |
| [14] | 林奕蝶, 张柏杨, 胡美婧, 等. 体育锻炼与缺血性卒中复发风险存在因果关系:基于潜在结果理论[J].南方医科大学学报, 2021, 41(8):1191-7. |
| [15] | Hamburg NM, McMackin CJ, Huang AL, et al. Physical inactivity rapidly induces insulin resistance and microvascular dysfunction in healthy volunteers[J]. Arterioscler Thromb Vasc Biol, 2007, 27(12): 2650-6. doi:10.1161/atvbaha.107.153288 |
| [16] | Schmidt-Trucksäss A, Lichtenstein AH, von Känel R. Lifestyle factors as determinants of atherosclerotic cardiovascular health[J]. Atherosclerosis, 2024, 395: 117577. doi:10.1016/j.atherosclerosis.2024.117577 |
| [17] | Alkadhi KA. Exercise as a positive modulator of brain function[J]. Mol Neurobiol, 2018, 55(4): 3112-30. doi:10.1007/s12035-017-0516-4 |
| [18] | Boehme AK, Esenwa C, Elkind MS. Stroke risk factors, genetics, and prevention[J]. Circ Res, 2017, 120(3): 472-95. doi:10.1161/circresaha.116.308398 |
| [19] | Glantz SA, Parmley WW. Passive smoking and heart disease. Epidemiology, physiology, and biochemistry[J]. Circulation, 1991, 83(1): 1-12. doi:10.1161/01.cir.83.1.1 |
| [20] | 陈晶晶, 徐格林. 吸烟与卒中[J]. 医学研究生学报, 2020, 33(5):454-9. |
| [21] | Tsereteli N, Vallat R, Fernandez-Tajes J, et al. Impact of insufficient sleep on dysregulated blood glucose control under standardised meal conditions[J]. Diabetologia, 2022, 65(2): 356-65. doi:10.1007/s00125-021-05608-y |
| [22] | St-Onge MP, Grandner MA, Brown D, et al. Sleep duration and quality: impact on lifestyle behaviors and cardiometabolic health: a scientific statement from the American heart association[J]. Circulation, 2016, 134(18): e367-86. doi:10.1161/cir.0000000000000444 |
| [23] | Tobaldini E, Fiorelli EM, Solbiati M, et al. Short sleep duration and cardiometabolic risk: from pathophysiology to clinical evidence[J]. Nat Rev Cardiol, 2019, 16(4): 213-24. doi:10.1038/s41569-018-0109-6 |
| [24] | Casas R, Castro-Barquero S, Estruch R, et al. Nutrition and cardiovascular health[J]. Int J Mol Sci, 2018, 19(12): 3988. doi:10.3390/ijms19123988 |
| [25] | Appel LJ, Moore TJ, Obarzanek E, et al. A clinical trial of the effects of dietary patterns on blood pressure. DASH Collaborative Research Group[J]. N Engl J Med, 1997, 336(16): 1117-24. doi:10.1056/nejm199704173361601 |
| [26] | 臧 丽, 杨 雁. 成人肥胖相关代谢共病的管理:共识声明和内分泌专家建议[J].中国实用内科杂志, 2025, 45(8): 656-70. |
| [27] | Klein S, Gastaldelli A, Yki-Järvinen H, et al. Why does obesity cause diabetes[J]? Cell Metab, 2022, 34(1): 11-20. doi:10.1016/j.cmet.2021.12.012 |
| [28] | Wu SM, Wu B, Liu M, et al. Stroke in China: advances and challenges in epidemiology, prevention, and management[J]. Lancet Neurol, 2019, 18(4): 394-405. doi:10.1016/s1474-4422(18)30500-3 |
| [29] | Chen Y, Han L, Zhu DS, et al. Fibrinogen and neuroinflammation in the neurovascular unit in stroke[J]. J Inflamm Res, 2025, 18: 4567-84. doi:10.2147/jir.s496433 |
| [30] | 栗 静,田 婷, 石正洪, 等. 纤维蛋白原、C反应蛋白及同型半胱氨酸与大动脉粥样硬化型卒中患者颈动脉易损性斑块的相关性分析[J].解放军医学杂志, 2017, 42(1): 41-6. |
| [31] | Du D, Zhang L, Wen X, et al. Machine learning model and hemoglobin to red cell distribution width ratio evaluates all-cause mortality in pulmonary embolism[J]. Sci Rep, 2025, 15: 23070. doi:10.1038/s41598-025-07431-6 |
| [32] | Feng XR, Zhang YD, Li QZ, et al. Hemoglobin to red cell distribution width ratio as a prognostic marker for ischemic stroke after mechanical thrombectomy[J]. Front Aging Neurosci, 2023, 15: 1259668. doi:10.3389/fnagi.2023.1259668 |
| [33] | Xiong Y, Xie S, Yao YC, et al. Hemoglobin-to-red blood cell distribution width ratio is negatively associated with stroke: a cross-sectional study from NHANES[J]. Sci Rep, 2024, 14: 28098. doi:10.1038/s41598-024-79520-x |
| [34] | Luan X, Cheng H, Chen Y, et al. High levels of plasma fibrinogen and prothrombin time are related to post-stroke emotional impairment[J]. Brain Res, 2020, 1748: 147017. doi:10.1016/j.brainres.2020.147017 |
| [35] | Ząbczyk M, RASAriëns, Undas A. Fibrin clot properties in cardiovascular disease: from basic mechanisms to clinical practice[J]. Cardiovasc Res, 2023, 119(1): 94-111. doi:10.1093/cvr/cvad017 |
| [36] | 李晓利, 范 利, 王 强, 等.老年患者远期缺血性动脉血栓事件和死亡事件重要危险因素筛查[J].中华老年心脑血管病杂志, 2018, 20(10): 1032-6. |
| [37] | McCabe JJ, Walsh C, Gorey S, et al. Plasma fibrinogen and risk of vascular recurrence after ischaemic stroke: an individual participant and summary-level data meta-analysis of 11 prospective studies[J]. Eur Stroke J, 2024, 9(3): 704-13. doi:10.1177/23969873241246489 |
| [38] | Liu J, Yang C, Cheng WK, et al. Exploring the synergistic effects of Life’s Essential 8, insulin resistance, and CRP on cardiometabolic multimorbidity risk[J]. Front Nutr, 2025, 12: 1598659. doi:10.3389/fnut.2025.1598659 |
| [39] | Ryu JK, Yan ZQ, Montano M, et al. Fibrin drives thrombo-inflammation and neuropathology in COVID-19[J]. Nature, 2024, 633(8031): 905-13. doi:10.1038/s41586-024-07873-4 |
| [1] | 赵新丽, 王豪杰, 宋银春, 袁帅, 张振, 周星琦, 李姗姗, 李娴, 李锋. ERI3在肝癌中高表达并与患者不良预后相关[J]. 南方医科大学学报, 2026, 46(1): 175-182. |
| [2] | 沙桐, 王文研, 宣佳斌, 吴洁, 石能贤, 何劲, 胡鸿彬, 张耀元. 基于Th1/Th2细胞因子检测的脓毒症免疫状态分型及预后分析:一项回顾性研究[J]. 南方医科大学学报, 2026, 46(1): 6-22. |
| [3] | 王莹, 李静, 王伊迪, 华明钰, 胡玮彬, 张晓智. 原发性肝癌患者的临床结局与治疗反应预测模型:基于失巢凋亡和免疫基因[J]. 南方医科大学学报, 2025, 45(9): 1967-1979. |
| [4] | 张瑜, 李海涛, 潘玉卿, 曹杰贤, 翟丽, 张曦. MZB1基因在泛癌中的表达及其与免疫浸润及预后的关系[J]. 南方医科大学学报, 2025, 45(9): 2006-2018. |
| [5] | 王子良, 陈孝华, 杨晶晶, 严晨, 张志郅, 黄炳轶, 赵萌, 刘嵩, 葛思堂, 左芦根, 陈德利. 高表达SURF4通过抑制紧密连接蛋白表达促进胃癌细胞的恶性生物学行为[J]. 南方医科大学学报, 2025, 45(8): 1732-1742. |
| [6] | 庞金龙, 赵新丽, 张振, 王豪杰, 周星琦, 杨玉梅, 李姗姗, 常小强, 李锋, 李娴. 皮肤黑色素瘤中MMRN2高表达促进肿瘤细胞的侵袭和迁移并与不良预后相关[J]. 南方医科大学学报, 2025, 45(7): 1479-1489. |
| [7] | 吴璇, 方家敏, 韩玮玮, 陈琳, 孙菁, 金齐力. 高表达PRELID1促进胃癌细胞上皮间质转化并与不良预后相关[J]. 南方医科大学学报, 2025, 45(7): 1535-1542. |
| [8] | 王康, 李海宾, 余靖, 孟源, 张虹丽. ELFN1高表达是结肠癌的预后生物标志物并促进结肠癌细胞的增殖转移[J]. 南方医科大学学报, 2025, 45(7): 1543-1553. |
| [9] | 张毅, 沈昱, 万志强, 陶嵩, 柳亚魁, 王栓虎. CDKN3高表达促进胃癌细胞的迁移和侵袭:基于调控p53/NF-κB信号通路和抑制胃癌细胞凋亡[J]. 南方医科大学学报, 2025, 45(4): 853-861. |
| [10] | 黄晴晴, 张文静, 张小凤, 王炼, 宋雪, 耿志军, 左芦根, 王月月, 李静, 胡建国. 高表达MYO1B促进胃癌细胞增殖、迁移和侵袭并与患者的不良预后有关[J]. 南方医科大学学报, 2025, 45(3): 622-631. |
| [11] | 李华莉, 宋婷, 刘嘉雯, 李永宝, 姜兆静, 窦文, 周凌宏. 预后导向的肺癌调强放疗计划优化新方法[J]. 南方医科大学学报, 2025, 45(3): 643-649. |
| [12] | 宋雪, 陈悦, 张敏, 张诺, 左芦根, 李静, 耿志军, 张小凤, 王月月, 王炼, 胡建国. GPSM2在胃癌组织中高表达并通过促进肿瘤细胞的增殖影响患者预后[J]. 南方医科大学学报, 2025, 45(2): 229-238. |
| [13] | 唐天威, 李路安, 陈源汉, 张丽, 徐丽霞, 李志莲, 冯仲林, 张辉林, 华瑞芳, 叶智明, 梁馨苓, 李锐钊. 高血清胱抑素C水平是IgA肾病不良预后的独立危险因素[J]. 南方医科大学学报, 2025, 45(2): 379-386. |
| [14] | 周仁杰, 杨晶晶, 宋博文, 陈孝华, 王炼, 王月月, 左芦根, 朱冰. 高表达PSMD11促进胃癌细胞上皮-间质转化进程并影响患者预后[J]. 南方医科大学学报, 2025, 45(12): 2747-2755. |
| [15] | 宋博文, 周仁杰, 徐盈, 施金冉, 张志郅, 李静, 耿志军, 宋雪, 王炼, 王月月, 左芦根. TMCO1在胃癌中高表达与患者不良预后相关并通过抑制调亡促进肿瘤恶性进展[J]. 南方医科大学学报, 2025, 45(11): 2385-2393. |
| 阅读次数 | ||||||
|
全文 |
|
|||||
|
摘要 |
|
|||||