南方医科大学学报 ›› 2025, Vol. 45 ›› Issue (2): 379-386.doi: 10.12122/j.issn.1673-4254.2025.02.19
• • 上一篇
唐天威1( ), 李路安2, 陈源汉2, 张丽2, 徐丽霞2, 李志莲2, 冯仲林2, 张辉林3, 华瑞芳3, 叶智明2, 梁馨苓2, 李锐钊1()
收稿日期:2024-08-17
出版日期:2025-02-20
发布日期:2025-03-03
通讯作者:
李锐钊
E-mail:tw122666@163.com;liruizhao1979@126.com
作者简介:唐天威,在读硕士研究生,E-mail: tw122666@163.com
基金资助:
Tianwei TANG1(), Luan LI2, Yuanhan CHEN2, Li ZHANG2, Lixia XU2, Zhilian LI2, Zhonglin FENG2, Huilin ZHANG3, Ruifang HUA3, Zhiming YE2, Xinling LIANG2, Ruizhao LI1()
Received:2024-08-17
Online:2025-02-20
Published:2025-03-03
Contact:
Ruizhao LI
E-mail:tw122666@163.com;liruizhao1979@126.com
摘要:
目的 探讨血清胱抑素C(CysC)水平评估IgA肾病(IgAN)患者肾脏预后的价值。 方法 回顾性收集2014年1月~2018年12月在广东省人民医院通过肾穿刺活检诊断为IgAN患者的临床资料。根据基线血清CysC值将患者分为高血清CysC组(CysC>1.03 mg/L)和正常血清CysC组(CysC≤1.03 mg/L)。估算肾小球滤过率(eGFR)下降≥50%,和/或进入终末期肾病(ESRD)作为肾脏不良预后的随访复合终点事件。采用lasso回归和多因素Cox回归筛选独立危险因素,并基于这些独立危险因素构建多因素Cox回归预测模型。采用Kaplan⁃Meier生存分析比较两组之间的肾脏生存率差异。平滑曲线拟合及阈值效应探究血清CysC水平与结局之间的关系。通过Bootstrap法内部验证预测模型并使用一致性指数、校正曲线、受试者工作特征(ROC)曲线及其曲线下面积(AUC)对模型预测效能进行评价,并通过列线图可视化。 结果 本研究共纳入356例IgAN患者,平均随访时间为(4.65±0.93)年,74例发生肾脏不良预后的复合终点事件。高血清CysC被筛选为IgAN肾脏不良预后的独立危险因素(HR=2.142,95% CI:1.222~3.755),且血清CysC水平高的患者肾脏生存率较低(Log-rank检验χ2=47.970,P<0.001)。阈值效应分析显示,当患者血清CysC≤2.12 mg/L时,血清CysC水平越高,肾脏不良预后风险越大(β=3.487,95% CI:2.561~4.413,P<0.001);当患者的血清CysC>2.12 mg/L时,肾脏不良预后的发生风险仍有上升但差异无统计学意义(β=0.676,95% CI:-0.642~1.995,P=0.315)。基于血清 CysC及其他3个独立危险因素构建的多因素Cox回归预测模型经内部验证表现良好,其一致性指数为0.873(95% CI:0.839~0.907),AUC为0.909(95% CI:0.873~0.945)。 结论 血清CysC水平与IgAN患者肾脏预后相关,高血清CysC是IgA肾病不良预后的独立危险因素。
唐天威, 李路安, 陈源汉, 张丽, 徐丽霞, 李志莲, 冯仲林, 张辉林, 华瑞芳, 叶智明, 梁馨苓, 李锐钊. 高血清胱抑素C水平是IgA肾病不良预后的独立危险因素[J]. 南方医科大学学报, 2025, 45(2): 379-386.
Tianwei TANG, Luan LI, Yuanhan CHEN, Li ZHANG, Lixia XU, Zhilian LI, Zhonglin FENG, Huilin ZHANG, Ruifang HUA, Zhiming YE, Xinling LIANG, Ruizhao LI. High serum cystatin C is an independent risk factor for poor renal prognosis in IgA nephropathy[J]. Journal of Southern Medical University, 2025, 45(2): 379-386.
| Pathological parameters and score | Content |
|---|---|
| Mesangial hypercellularity (M) | |
| M0 | Mesangial score ≤0.5 |
| M1 | Mesangial score >0.5 |
| Endocapillary hypercellularity (E) | |
| E0 | Absent |
| E1 | Present |
| Segmental glomerulosclerosis (S) | |
| S0 | Absent |
| S1 | Present |
| Tubular atrophy/interstitial fibrosis (T) | |
| T0 | 0-25% |
| T1 | 26%-50% |
| T2 | >50% |
| Cellular/fibrocellular crescents (C) | |
| C0 | Absent |
| C1 | Crescents in a least 1 glomerulus and <25% of glomeruli |
| C2 | Crescents in ≥25% of glomeruli |
表1 IgAN牛津分型(MEST-C评分)
Tab.1 Oxford Classification of IgA nephropathy (MEST-C score)
| Pathological parameters and score | Content |
|---|---|
| Mesangial hypercellularity (M) | |
| M0 | Mesangial score ≤0.5 |
| M1 | Mesangial score >0.5 |
| Endocapillary hypercellularity (E) | |
| E0 | Absent |
| E1 | Present |
| Segmental glomerulosclerosis (S) | |
| S0 | Absent |
| S1 | Present |
| Tubular atrophy/interstitial fibrosis (T) | |
| T0 | 0-25% |
| T1 | 26%-50% |
| T2 | >50% |
| Cellular/fibrocellular crescents (C) | |
| C0 | Absent |
| C1 | Crescents in a least 1 glomerulus and <25% of glomeruli |
| C2 | Crescents in ≥25% of glomeruli |
| Variables | Overall (n=356) | Normal serum CysC group (n=130) | High serum CysC group (n=226) | t/Z/χ2 | P |
|---|---|---|---|---|---|
| Age (year) | 36 (29, 45) | 32 (26, 39) | 39 (32, 47) | -5.245 | <0.001 |
| Male [n (%)] | 149 (41.9) | 33(25.4) | 116 (51.3) | 21.770 | <0.001 |
| Hypertension [n (%)] | 139 (39.0) | 28 (21.5) | 111 (49.1) | 25.224 | <0.001 |
| Hyperuricaemia [n (%)] | 31 ( 8.7) | 5 (3.8) | 26 (11.5) | 5.163 | 0.023 |
| Mean arterial pressure (mmHg) | 100.34 (91, 112.34) | 94.67 (87.33, 104.33) | 105 (94.67, 115.25) | -5.989 | <0.001 |
| Weight (kg) | 59.8 (52.39, 68) | 58 (51, 65.81) | 61.48 (53.78, 69.48) | -2.766 | 0.006 |
| Serum uric acid (μmol/L) | 423.5 (342, 517.5) | 345 (293, 409) | 470.1 (392.25, 565) | -9.559 | <0.001 |
| Serum sodium (mmol/L) | 139 (137.7, 140.5) | 138.9 (137.7, 140.2) | 139.1 (137.8, 140.7) | -0.794 | 0.427 |
| Serum potassium (mmol/L) | 3.72 (3.49, 3.95) | 3.58 (3.4, 3.77) | 3.84 (3.58, 4.07) | -6.489 | <0.001 |
| Serum albumin (g/L) | 36.7 (33.78, 39.8) | 37.35 (34.53, 40.78) | 36.3 (32.4, 39.1) | 3.049 | 0.002 |
| Triglyceride (mmol/L) | 1.59 (1.11, 2.49) | 1.38 (0.98, 2.02) | 1.78 (1.25, 2.57) | -3.577 | <0.001 |
| Cholesterol (mmol/L) | 5.3 (4.4, 6.04) | 5.15 (4.25, 5.68) | 5.36 (4.56, 6.29) | -2.544 | 0.011 |
| Low density lipoprotein cholesterol (mmol/L) | 3.19 (2.62, 3.89) | 3.1 (2.49, 3.53) | 3.27 (2.65, 4.04) | -2.777 | 0.005 |
| High density lipoprotein cholesterol (mmol/L) | 1.15 (0.96, 1.41) | 1.23 (1.01, 1.48) | 1.13 (0.93, 1.38) | 2.306 | 0.021 |
| Transferrin (g/L) | 1.96 (1.76, 2.25) | 2.11 (1.85, 2.36) | 1.91 (1.73, 2.17) | 4.300 | <0.001 |
| Serum IgA (g/L) | 3.4 (2.5, 4.09) | 3.23 (2.49, 3.79) | 3.47 (2.55, 4.45) | -1.908 | 0.056 |
| Serum IgM (g/L) | 1.16 (0.83, 1.68) | 1.21 (0.88, 1.67) | 1.14 (0.8, 1.68) | 1.154 | 0.249 |
| Serum IgG (g/L) | 11.5 (9.74, 13.1) | 11.4 (10.1, 12.6) | 11.55 (9.6, 13.5) | -0.551 | 0.582 |
| Complement C3 (mg/L) | 878 (773.75, 1010) | 889 (769.25, 1010) | 868 (776.5, 1000) | 0.592 | 0.555 |
| Complement C4 (mg/L) | 226 (178, 275) | 215.5 (166.25, 250.5) | 233 (184.5, 284) | -2.971 | 0.003 |
| Hemoglobin (g/L) | 124.56±18.02 | 126.68±16.16 | 123.34±18.92 | 1.765 | 0.079 |
| White blood cell (×109/L) | 7.48 (6.41, 8.69) | 7.37 (6.31, 8.59) | 7.59 (6.51, 8.75) | -1.049 | 0.295 |
| Platelet (×109/L) | 251 (209, 289.25) | 256.5 (218, 296) | 249 (204, 285.75) | 1.685 | 0.092 |
| Fibrinogen (g/L) | 3.56 (3.08, 4.31) | 3.31 (2.91, 3.85) | 3.73 (3.16, 4.54) | -4.052 | <0.001 |
| D-Dimer(ng/mL) | 330 (270, 472.5) | 290 (270, 390) | 350 (270, 520) | -3.168 | 0.001 |
| Hematuria [n (%)] | 151 (42.4) | 78 (60.0) | 73 (32.3) | 24.802 | <0.001 |
| 24 h urine protein (g) | 1.14 (0.51, 2.16) | 0.70 (0.33, 1.40) | 1.38 (0.69, 2.67) | -5.977 | <0.001 |
| eGFR[mL·min-1·(1.73 m2)-1] | 65.62 (39.43, 100.51) | 106.39 (88.53, 119.9) | 44.84 (31.57, 64.36) | 13.664 | <0.001 |
| Serum IgA/Complement C3 | 3.68 (2.83, 4.76) | 3.61 (2.75, 4.34) | 3.8 (2.86, 5.09) | -1.785 | 0.074 |
| RAAS-inhibitor [n (%)] | 294 (82.6) | 125 (96.2) | 169 (74.8) | 24.752 | <0.001 |
| Immunosuppressive agents [n (%)] | 217 (61.0) | 64 (49.2) | 153 (67.7) | 11.064 | 0.001 |
| Percentage of global glomerulosclerosis | 0.23 (0.09, 0.46) | 0.1 (0.03, 0.18) | 0.36 (0.17, 0.55) | -9.405 | <0.001 |
| M1 [n (%)] | 291 (81.7) | 110 (84.6) | 181 (80.1) | 0.850 | 0.357 |
| E1 [n (%)] | 54 (15.2) | 22 (16.9) | 32 (14.2) | 0.299 | 0.585 |
| S1 [n (%)] | 167 (46.9) | 49 (37.7) | 118 (52.2) | 6.416 | 0.011 |
| T [n (%)] | 92.316 | <0.001 | |||
| 0 | 209 (58.7) | 119 (91.5) | 90 (39.8) | ||
| 1 | 91 (25.6) | 10 (7.7) | 81 (35.8) | ||
| 2 | 56 (15.7) | 1 (0.8) | 55 (24.3) | ||
| C [n (%)] | 7.860 | 0.020 | |||
| 0 | 152 (42.7) | 49 (37.7) | 103 (45.6) | ||
| 1 | 168 (47.2) | 73 (56.2) | 95 (42.0) | ||
| 2 | 36 (10.1) | 8 (6.2) | 28 (12.4) |
表2 两组患者的基线资料
Tab.2 Baseline data of the patients with normal and high serum CysC levels
| Variables | Overall (n=356) | Normal serum CysC group (n=130) | High serum CysC group (n=226) | t/Z/χ2 | P |
|---|---|---|---|---|---|
| Age (year) | 36 (29, 45) | 32 (26, 39) | 39 (32, 47) | -5.245 | <0.001 |
| Male [n (%)] | 149 (41.9) | 33(25.4) | 116 (51.3) | 21.770 | <0.001 |
| Hypertension [n (%)] | 139 (39.0) | 28 (21.5) | 111 (49.1) | 25.224 | <0.001 |
| Hyperuricaemia [n (%)] | 31 ( 8.7) | 5 (3.8) | 26 (11.5) | 5.163 | 0.023 |
| Mean arterial pressure (mmHg) | 100.34 (91, 112.34) | 94.67 (87.33, 104.33) | 105 (94.67, 115.25) | -5.989 | <0.001 |
| Weight (kg) | 59.8 (52.39, 68) | 58 (51, 65.81) | 61.48 (53.78, 69.48) | -2.766 | 0.006 |
| Serum uric acid (μmol/L) | 423.5 (342, 517.5) | 345 (293, 409) | 470.1 (392.25, 565) | -9.559 | <0.001 |
| Serum sodium (mmol/L) | 139 (137.7, 140.5) | 138.9 (137.7, 140.2) | 139.1 (137.8, 140.7) | -0.794 | 0.427 |
| Serum potassium (mmol/L) | 3.72 (3.49, 3.95) | 3.58 (3.4, 3.77) | 3.84 (3.58, 4.07) | -6.489 | <0.001 |
| Serum albumin (g/L) | 36.7 (33.78, 39.8) | 37.35 (34.53, 40.78) | 36.3 (32.4, 39.1) | 3.049 | 0.002 |
| Triglyceride (mmol/L) | 1.59 (1.11, 2.49) | 1.38 (0.98, 2.02) | 1.78 (1.25, 2.57) | -3.577 | <0.001 |
| Cholesterol (mmol/L) | 5.3 (4.4, 6.04) | 5.15 (4.25, 5.68) | 5.36 (4.56, 6.29) | -2.544 | 0.011 |
| Low density lipoprotein cholesterol (mmol/L) | 3.19 (2.62, 3.89) | 3.1 (2.49, 3.53) | 3.27 (2.65, 4.04) | -2.777 | 0.005 |
| High density lipoprotein cholesterol (mmol/L) | 1.15 (0.96, 1.41) | 1.23 (1.01, 1.48) | 1.13 (0.93, 1.38) | 2.306 | 0.021 |
| Transferrin (g/L) | 1.96 (1.76, 2.25) | 2.11 (1.85, 2.36) | 1.91 (1.73, 2.17) | 4.300 | <0.001 |
| Serum IgA (g/L) | 3.4 (2.5, 4.09) | 3.23 (2.49, 3.79) | 3.47 (2.55, 4.45) | -1.908 | 0.056 |
| Serum IgM (g/L) | 1.16 (0.83, 1.68) | 1.21 (0.88, 1.67) | 1.14 (0.8, 1.68) | 1.154 | 0.249 |
| Serum IgG (g/L) | 11.5 (9.74, 13.1) | 11.4 (10.1, 12.6) | 11.55 (9.6, 13.5) | -0.551 | 0.582 |
| Complement C3 (mg/L) | 878 (773.75, 1010) | 889 (769.25, 1010) | 868 (776.5, 1000) | 0.592 | 0.555 |
| Complement C4 (mg/L) | 226 (178, 275) | 215.5 (166.25, 250.5) | 233 (184.5, 284) | -2.971 | 0.003 |
| Hemoglobin (g/L) | 124.56±18.02 | 126.68±16.16 | 123.34±18.92 | 1.765 | 0.079 |
| White blood cell (×109/L) | 7.48 (6.41, 8.69) | 7.37 (6.31, 8.59) | 7.59 (6.51, 8.75) | -1.049 | 0.295 |
| Platelet (×109/L) | 251 (209, 289.25) | 256.5 (218, 296) | 249 (204, 285.75) | 1.685 | 0.092 |
| Fibrinogen (g/L) | 3.56 (3.08, 4.31) | 3.31 (2.91, 3.85) | 3.73 (3.16, 4.54) | -4.052 | <0.001 |
| D-Dimer(ng/mL) | 330 (270, 472.5) | 290 (270, 390) | 350 (270, 520) | -3.168 | 0.001 |
| Hematuria [n (%)] | 151 (42.4) | 78 (60.0) | 73 (32.3) | 24.802 | <0.001 |
| 24 h urine protein (g) | 1.14 (0.51, 2.16) | 0.70 (0.33, 1.40) | 1.38 (0.69, 2.67) | -5.977 | <0.001 |
| eGFR[mL·min-1·(1.73 m2)-1] | 65.62 (39.43, 100.51) | 106.39 (88.53, 119.9) | 44.84 (31.57, 64.36) | 13.664 | <0.001 |
| Serum IgA/Complement C3 | 3.68 (2.83, 4.76) | 3.61 (2.75, 4.34) | 3.8 (2.86, 5.09) | -1.785 | 0.074 |
| RAAS-inhibitor [n (%)] | 294 (82.6) | 125 (96.2) | 169 (74.8) | 24.752 | <0.001 |
| Immunosuppressive agents [n (%)] | 217 (61.0) | 64 (49.2) | 153 (67.7) | 11.064 | 0.001 |
| Percentage of global glomerulosclerosis | 0.23 (0.09, 0.46) | 0.1 (0.03, 0.18) | 0.36 (0.17, 0.55) | -9.405 | <0.001 |
| M1 [n (%)] | 291 (81.7) | 110 (84.6) | 181 (80.1) | 0.850 | 0.357 |
| E1 [n (%)] | 54 (15.2) | 22 (16.9) | 32 (14.2) | 0.299 | 0.585 |
| S1 [n (%)] | 167 (46.9) | 49 (37.7) | 118 (52.2) | 6.416 | 0.011 |
| T [n (%)] | 92.316 | <0.001 | |||
| 0 | 209 (58.7) | 119 (91.5) | 90 (39.8) | ||
| 1 | 91 (25.6) | 10 (7.7) | 81 (35.8) | ||
| 2 | 56 (15.7) | 1 (0.8) | 55 (24.3) | ||
| C [n (%)] | 7.860 | 0.020 | |||
| 0 | 152 (42.7) | 49 (37.7) | 103 (45.6) | ||
| 1 | 168 (47.2) | 73 (56.2) | 95 (42.0) | ||
| 2 | 36 (10.1) | 8 (6.2) | 28 (12.4) |
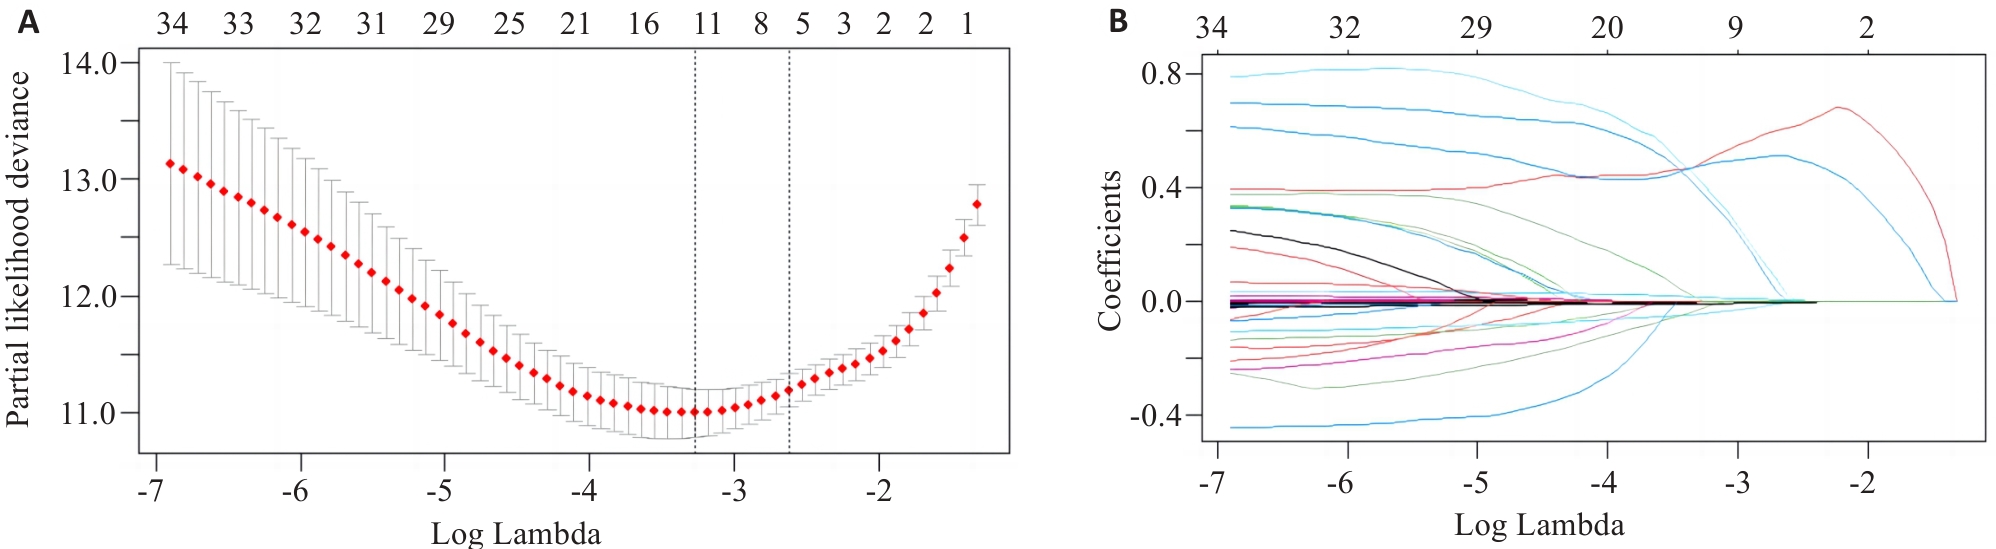
图1 Lasso回归模型筛选变量
Fig.1 Variable selection by Lasso regression model. A: Log Lambda versus partial likelihood deviance. B: Log Lambda versus coefficients.
| Variables | Lasso regression coefficients | Multivariate Cox regression | |
|---|---|---|---|
| HR (95% CI) | P | ||
| Mean arterial pressure (mmHg) | 4.23×10⁻³ | 1.015 (1.000-1.031) | 0.048 |
| Serum CysC (mg/L) | 6.10×10⁻¹ | 2.142 (1.222-3.755) | 0.008 |
| Serum albumin (g/L) | -4.57×10⁻³ | 0.934 (0.892-0.977) | 0.003 |
| 24-hour urine protein (g) | 2.88×10⁻⁵ | 1.000 (0.999-1.000) | 0.638 |
| eGFR[mL·min-1·(1.73 m2)-1] | -5.43×10⁻³ | 0.984 (0.965-1.003) | 0.107 |
| Percentage of global glomerulosclerosis | 1.81×10⁻² | 2.077 (0.518-8.327) | 0.302 |
| T [n (%)] | 5.10×10⁻¹ | 1.000 (Ref) | |
| T1 | 3.416 (1.424-8.192) | 0.006 | |
| T2 | 3.408 (1.144-10.150) | 0.028 | |
表3 Lasso回归及多因素Cox回归分析IgAN肾脏不良预后的危险因素
Tab.3 Lasso regression and multivariate Cox regression analysis of the risk factors for poor renal prognosis in IgAN
| Variables | Lasso regression coefficients | Multivariate Cox regression | |
|---|---|---|---|
| HR (95% CI) | P | ||
| Mean arterial pressure (mmHg) | 4.23×10⁻³ | 1.015 (1.000-1.031) | 0.048 |
| Serum CysC (mg/L) | 6.10×10⁻¹ | 2.142 (1.222-3.755) | 0.008 |
| Serum albumin (g/L) | -4.57×10⁻³ | 0.934 (0.892-0.977) | 0.003 |
| 24-hour urine protein (g) | 2.88×10⁻⁵ | 1.000 (0.999-1.000) | 0.638 |
| eGFR[mL·min-1·(1.73 m2)-1] | -5.43×10⁻³ | 0.984 (0.965-1.003) | 0.107 |
| Percentage of global glomerulosclerosis | 1.81×10⁻² | 2.077 (0.518-8.327) | 0.302 |
| T [n (%)] | 5.10×10⁻¹ | 1.000 (Ref) | |
| T1 | 3.416 (1.424-8.192) | 0.006 | |
| T2 | 3.408 (1.144-10.150) | 0.028 | |
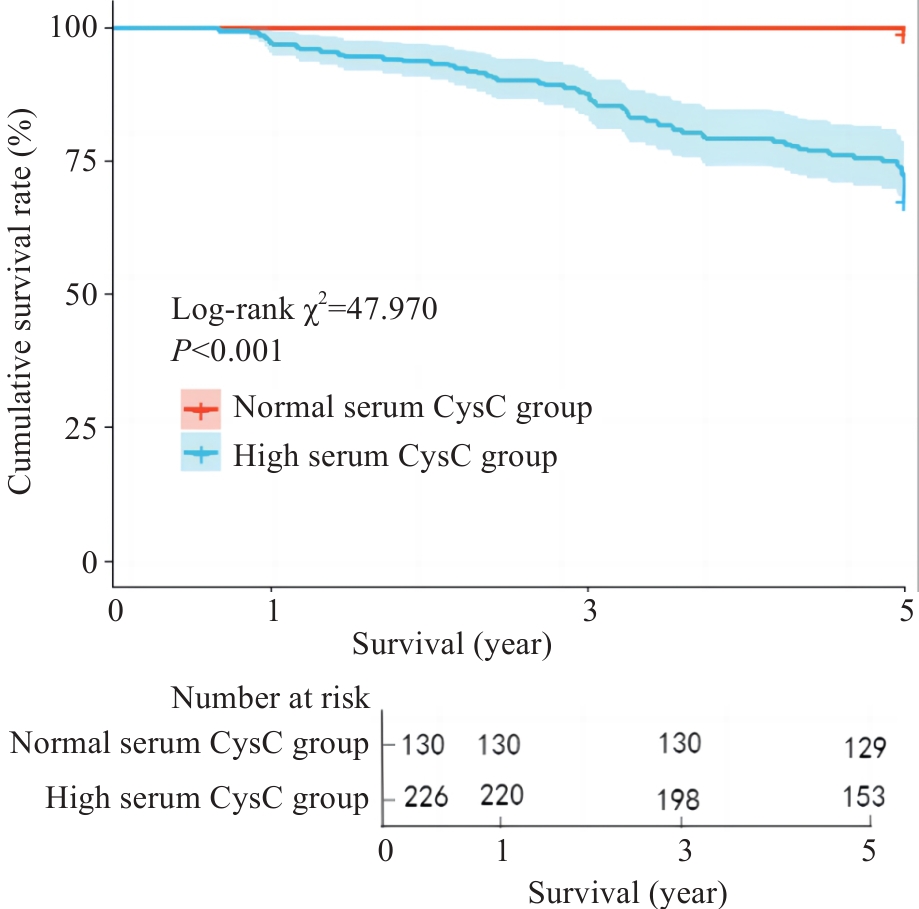
图2 Kaplan⁃Meier生存曲线分析血清CysC对IgAN患者5年肾脏生存率的影响
Fig.2 Kaplan-Meier survival curves for analyzing the effect of serum CysC on 5-year renal survival rate of IgAN patients.
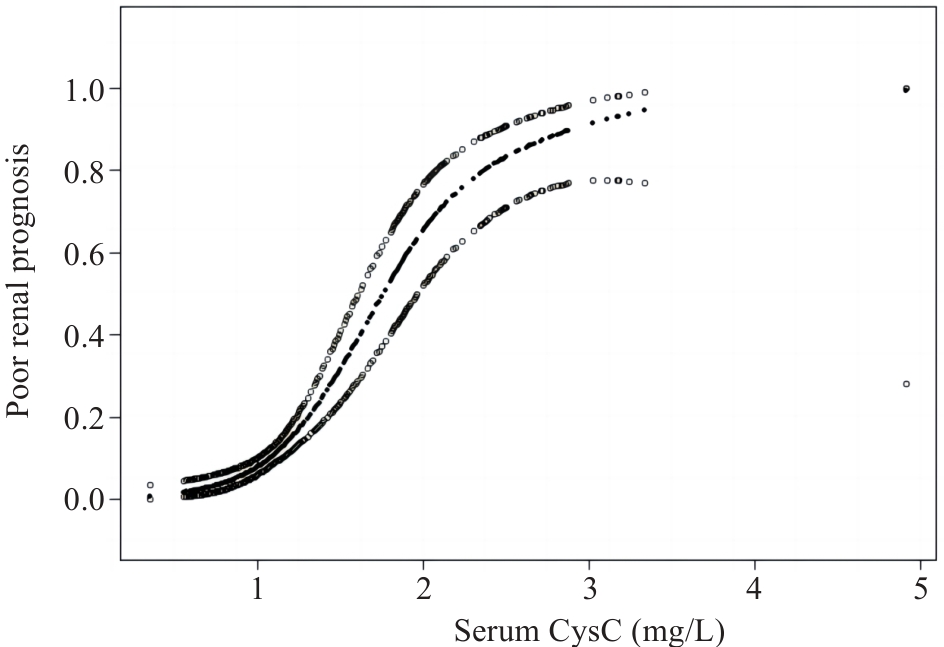
图3 广义加性模型描述血清CysC水平与IgAN肾脏不良预后之间的关系
Fig.3 Generalized additive models demonstrate the relationship between serum CysC level and poor renal prognosis of IgAN.
| Threshold effect | β (95% CI) | P |
|---|---|---|
| Fitting by GAMs | ||
| Serum CysC | 2.637 (2.034, 3.240) | <0.001 |
| Fitting by two-piecewise GAMs | ||
| Inflection point | 2.12 | |
| Serum CysC≤2.12 | 3.487 (2.561, 4.413) | <0.001 |
| Serum CysC>2.12 | 0.676 (-0.642, 1.995) | 0.315 |
| Log likelihood ratio | 0.008 |
表4 血清CysC水平与IgAN肾脏不良预后的阈值效应分析
Tab.4 Threshold effect analysis of serum CysC level and poor renal prognosis of IgAN
| Threshold effect | β (95% CI) | P |
|---|---|---|
| Fitting by GAMs | ||
| Serum CysC | 2.637 (2.034, 3.240) | <0.001 |
| Fitting by two-piecewise GAMs | ||
| Inflection point | 2.12 | |
| Serum CysC≤2.12 | 3.487 (2.561, 4.413) | <0.001 |
| Serum CysC>2.12 | 0.676 (-0.642, 1.995) | 0.315 |
| Log likelihood ratio | 0.008 |
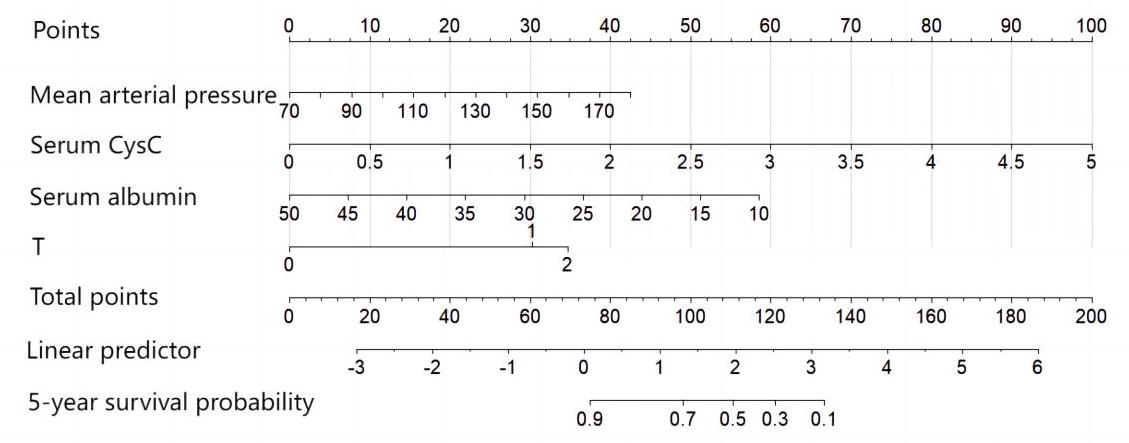
图4 IgAN患者预后的列线图模型
Fig.4 Nomogram prediction model of the prognosis of IgAN patients.
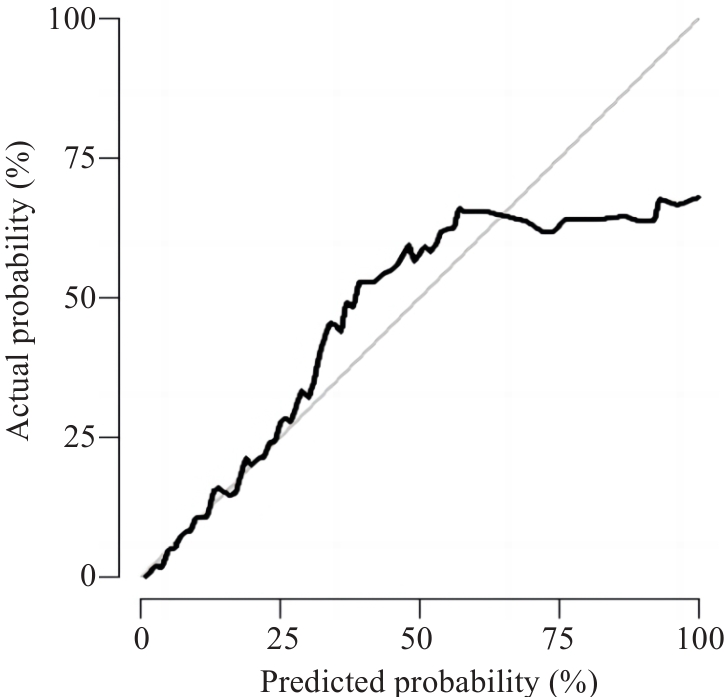
图5 列线图模型的校准曲线
Fig.5 Calibration curve of nomogram prediction model.
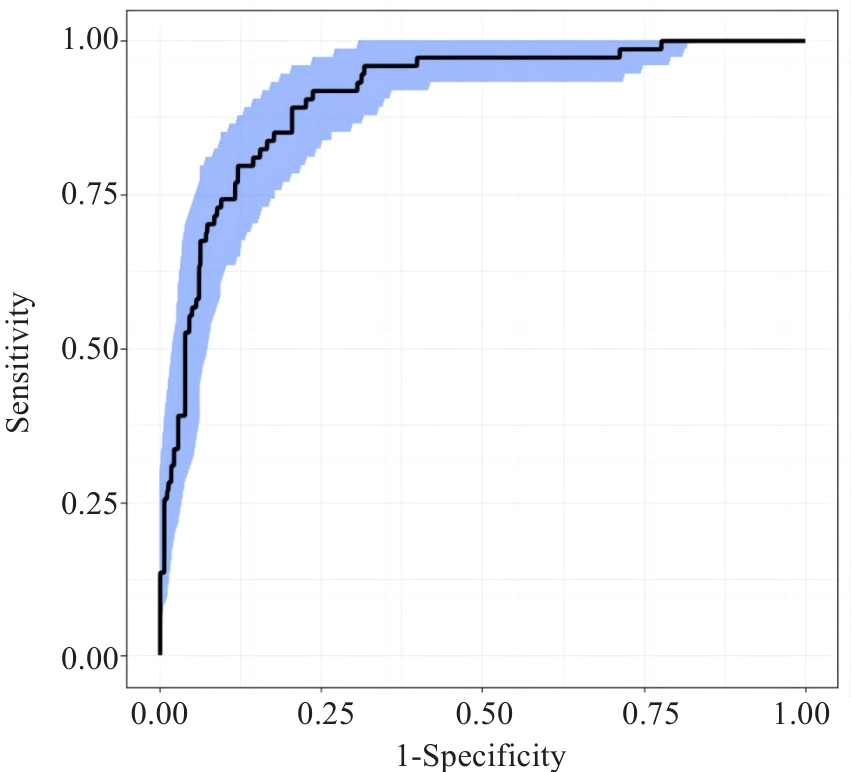
图6 列线图模型的ROC曲线
Fig.6 ROC curve of nomogram prediction model.
| 1 | Lai KN, Tang SC, Schena FP, et al. IgA nephropathy[J]. Nat Rev Dis Primers, 2016, 2: 16001. |
| 2 | DiseaseKidney: Improving Global Outcomes (KDIGO) Glomerular Diseases Work Group. KDIGO 2021 clinical practice guideline for the management of glomerular diseases[J]. Kidney Int, 2021, 100(4s): S1-276. |
| 3 | Spencer S, Desborough R, Bhandari S. Should cystatin C eGFR become routine clinical practice[J]. Biomolecules, 2023, 13(7): 1075. |
| 4 | Feng BY, Lu Y, Ye L, et al. Mendelian randomization study supports the causal association between serum cystatin C and risk of diabetic nephropathy[J]. Front Endocrinol, 2022, 13: 1043174. |
| 5 | Chen SH, Tang YZ, Zhou XY. Cystatin C for predicting all-cause mortality and rehospitalization in patients with heart failure: a meta-analysis[J]. Biosci Rep, 2019, 39(2): BSR20181761. |
| 6 | Inker LA, Eneanya ND, Coresh J, et al. New creatinine- and cystatin C-based equations to estimate GFR without race[J]. N Engl J Med, 2021, 385(19): 1737-49. |
| 7 | Trimarchi H, Barratt J, Cattran DC, et al. Oxford classification of IgA nephropathy 2016: an update from the IgA nephropathy classification working group[J]. Kidney Int, 2017, 91(5): 1014-21. |
| 8 | Dejenie TA, Abebe EC, Mengstie MA, et al. Dyslipidemia and serum cystatin C levels as biomarker of diabetic nephropathy in patients with type 2 diabetes mellitus[J]. Front Endocrinol, 2023, 14: 1124367. |
| 9 | Séronie-Vivien S, Delanaye P, Piéroni L, et al. Cystatin C: current position and future prospects[J]. Clin Chem Lab Med, 2008, 46(12): 1664-86. |
| 10 | Zou LX, Sun L, Nicholas SB, et al. Comparison of bias and accuracy using cystatin C and creatinine in CKD-EPI equations for GFR estimation[J]. Eur J Intern Med, 2020, 80: 29-34. |
| 11 | Liao XL, Zhu Y, Xue C. Diagnostic value of serum cystatin C for diabetic nephropathy: a meta-analysis[J]. BMC Endocr Disord, 2022, 22(1): 149. |
| 12 | 曾思权. 血清胱抑素C测定在原发性高血压早期肾损伤中的诊断价值[J]. 中国医学工程, 2016, 24(9): 40-2. |
| 13 | 蔡 萍. CysC水平变化在早期诊断急性肾损伤中的价值[J]. 四川医学, 2016, 37(4): 438-40. |
| 14 | Wali U, Hussain MM, Wali N, et al. Comparison of serum levels of Cystatin-C and traditional renal biomarkers for the early detection of pre-hypertensive nephropathy[J]. J Pak Med Assoc, 2019, 69(3): 313-9. |
| 15 | 蔡小凡, 符欣漪, 蔡秀峰, 等. 血清胱抑素C水平与IgA肾病临床及病理特征的相关性[J]. 中华检验医学杂志, 2022, 45(9): 957-62. |
| 16 | 陆 放, 张承宁, 段俗言, 等. 血清胱抑素C水平评估2型糖尿病患者肾病预后的价值[J]. 中华检验医学杂志, 2023, 46(4): 375-84. |
| 17 | Chen TY, Li X, Li YX, et al. Prediction and risk stratification of kidney outcomes in IgA nephropathy[J]. Am J Kidney Dis, 2019, 74(3): 300-9. |
| 18 | Xie JY, Lv JC, Wang WM, et al. Kidney failure risk prediction equations in IgA nephropathy: a multicenter risk assessment study in Chinese patients[J]. Am J Kidney Dis, 2018, 72(3): 371-80. |
| 19 | Zi MT, Xu YK. Involvement of cystatin C in immunity and apoptosis[J]. Immunol Lett, 2018, 196: 80-90. |
| 20 | Xu YK, Ding Y, Li XC, et al. Cystatin C is a disease-associated protein subject to multiple regulation[J]. Immunol Cell Biol, 2015, 93(5): 442-51. |
| 21 | 郭唯一, 安秀平, 孙丽君, 等. 伴肾小动脉硬化病变的IgA肾病的临床病理特点及预后[J]. 中华肾脏病杂志, 2023, 39(3): 209-14. |
| 22 | Sugiura N, Moriyama T, Miyabe Y, et al. Severity of arterial and/or arteriolar sclerosis in IgA nephropathy and the effects of renin-angiotensin system inhibitors on its prognosis[J]. J Pathol Clin Res, 2021, 7(6): 616-23. |
| 23 | Peng W, Tang Y, Tan L, et al. Crescents and global glomerulosclerosis in Chinese IgA nephropathy patients: a five-year follow-up[J]. Kidney Blood Press Res, 2019, 44(1): 103-12. |
| 24 | Lee K, Shin J, Park J, et al. First-year GFR slope and long-term renal outcome in IgA nephropathy[J]. Eur J Clin Invest, 2018, 48(6): e12936. |
| 25 | Le WB, Liang SS, Hu YL, et al. Long-term renal survival and related risk factors in patients with IgA nephropathy: results from a cohort of 1155 cases in a Chinese adult population[J]. Nephrol Dial Transplant, 2012, 27(4): 1479-85. |
| 26 | Bartosik LP, Lajoie G, Sugar L, et al. Predicting progression in IgA nephropathy[J]. Am J Kidney Dis, 2001, 38(4): 728-35. |
| 27 | 袁燕红, 王 琴, 张敏芳, 等. 血清白蛋白对IgA肾病患者肾脏预后的预测价值[J]. 中华肾脏病杂志, 2015, 31(2): 102-8. |
| 28 | 卢清梅, 潘 玲, 莫曼秋, 等. 同型半胱氨酸预测IgA肾病患者肾脏预后不良的价值[J]. 中华肾脏病杂志, 2022, 38(8): 718-21. |
| 29 | 唐天威, 叶智明, 李锐钊. IgA肾病预后的影响因素及相关评估模型的研究进展[J]. 中华肾脏病杂志, 2024, 40(6): 499-505. |
| 30 | Xie JY, Kiryluk K, Wang WM, et al. Predicting progression of IgA nephropathy: new clinical progression risk score[J]. PLoS One, 2012, 7(6): e38904. |
| 31 | Zhu XJ, Li HQ, Liu YX, et al. Tubular atrophy/interstitial fibrosis scores of Oxford classification combinded with proteinuria level at biopsy provides earlier risk prediction in lgA nephropathy[J]. Sci Rep, 2017, 7(1): 1100. |
| 32 | Coppo R, Troyanov S, Bellur S, et al. Validation of the Oxford classification of IgA nephropathy in cohorts with different presentations and treatments[J]. Kidney Int, 2014, 86(4): 828-36. |
| [1] | 宋雪, 陈悦, 张敏, 张诺, 左芦根, 李静, 耿志军, 张小凤, 王月月, 王炼, 胡建国. GPSM2在胃癌组织中高表达并通过促进肿瘤细胞的增殖影响患者预后[J]. 南方医科大学学报, 2025, 45(2): 229-238. |
| [2] | 陈晓睿, 魏青政, 张宗亮, 原江水, 宋卫青. 过表达带电多泡体蛋白2B基因抑制肾透明细胞癌细胞的增殖[J]. 南方医科大学学报, 2025, 45(1): 126-136. |
| [3] | 王耀彬, 陈柳燕, 罗伊凌, 申继清, 周素芳. NUF2对泛癌的预后和免疫治疗效果的预测价值[J]. 南方医科大学学报, 2025, 45(1): 137-149. |
| [4] | 周超, 张晶晶, 唐巧, 付双楠, 张宁, 何召云, 张瑾, 张田义, 刘鹏程, 宫嫚. 血清色氨酸用于乙肝相关慢加急性肝衰竭90 d死亡风险分层管理的潜在价值:一项多中心回顾性研究[J]. 南方医科大学学报, 2025, 45(1): 59-64. |
| [5] | 陈孝华, 鲁辉, 王子良, 王炼, 夏勇生, 耿志军, 张小凤, 宋雪, 王月月, 李静, 胡建国, 左芦根. ABI2在胃癌进展和预后中的作用及其调控机制[J]. 南方医科大学学报, 2024, 44(9): 1653-1661. |
| [6] | 叶梦楠, 武鸿美, 梅琰, 张庆玲. CREM在胃癌中高表达并与患者的不良预后相关[J]. 南方医科大学学报, 2024, 44(9): 1776-1782. |
| [7] | 纪凯, 于冠宇, 周乐其, 张天帅, 凌潜龙, 满文江, 朱冰, 张卫. HNRNPA1基因在结直肠癌组织中高表达及其潜在的诊断和治疗价值[J]. 南方医科大学学报, 2024, 44(9): 1685-1695. |
| [8] | 刘鹏程, 娄丽娟, 刘霞, 王建, 姜颖. M2巨噬细胞特征基因风险评分能准确预测HBV相关肝细胞癌患者的预后[J]. 南方医科大学学报, 2024, 44(5): 827-840. |
| [9] | 杨晶晶, 殷丽霞, 段婷, 牛民主, 何震东, 陈心蕊, 张小凤, 李静, 耿志军, 左芦根. 胃癌组织中高表达ATP5A1与患者术后的不良预后和肿瘤细胞的糖代谢有关[J]. 南方医科大学学报, 2024, 44(5): 974-980. |
| [10] | 高志强, 林 洁, 洪 鹏, 胡再宏, 董军君, 石秦林, 田小毛, 刘 丰, 魏光辉. 基于高通量 RNA 测序分析 Wilms 瘤中关键基因对预后及免疫应答的影响[J]. 南方医科大学学报, 2024, 44(4): 727-738. |
| [11] | 沈梦迪, 赵 娜, 邓晓晶, 邓 敏. COX6B2在胃癌组织中高表达并影响患者的远期预后:基于抑制p53信号调控胃癌细胞的增殖及细胞周期[J]. 南方医科大学学报, 2024, 44(2): 289-297. |
| [12] | 张 诺, 张 震, 张雨路, 宋 雪, 张小凤, 李 静, 左芦根, 胡建国. PCID2在胃癌组织中高表达并通过调控细胞周期进程和增殖影响患者预后[J]. 南方医科大学学报, 2024, 44(2): 324-332. |
| [13] | 张文静, 张 诺, 杨 子, 张小凤, 孙奥飞, 王 炼, 宋 雪, 耿志军, 李 静, 胡建国. BZW1 高表达促进胃癌细胞的侵袭和转移:基于调控Wnt//β-catenin通路和促进上皮间质转化[J]. 南方医科大学学报, 2024, 44(2): 354-362. |
| [14] | 谭茹雪, 包晓樟, 韩亮, 李朝晖, 田男. 基于HOXA9 DNA甲基化的两位点联合预测模型可用于脑膜瘤进展风险的早期筛查[J]. 南方医科大学学报, 2024, 44(11): 2110-2120. |
| [15] | 张震, 鲁辉, 陈孝华, 王炼, 王子良, 王月月, 葛思堂, 左芦根. CEP192过表达可作为胃癌患者不良预后的生物标志物并通过调控G2/M期关键蛋白的表达影响肿瘤细胞恶性增殖[J]. 南方医科大学学报, 2024, 44(11): 2137-2145. |
| 阅读次数 | ||||||
|
全文 |
|
|||||
|
摘要 |
|
|||||