南方医科大学学报 ›› 2026, Vol. 46 ›› Issue (1): 6-22.doi: 10.12122/j.issn.1673-4254.2026.01.02
沙桐1( ), 王文研2(), 宣佳斌1(), 吴洁1, 石能贤1, 何劲1, 胡鸿彬1(), 张耀元1()
收稿日期:2025-03-05
接受日期:2025-07-13
出版日期:2026-01-20
发布日期:2026-01-16
通讯作者:
胡鸿彬,张耀元
E-mail:shatong_smu@163.com;wwy9438@gmail.com;798524682@qq.com;hobewoos@163.com;243204661@qq.com
作者简介:沙 桐,博士,医师,E-mail: shatong_smu@163.com
Tong SHA1(), Wenyan WANG2(), Jiabin XUAN1(), Jie WU1, Nengxian SHI1, Jin HE1, Hongbin HU1(), Yaoyuan ZHANG1()
Received:2025-03-05
Accepted:2025-07-13
Online:2026-01-20
Published:2026-01-16
Contact:
Hongbin HU, Yaoyuan ZHANG
E-mail:shatong_smu@163.com;wwy9438@gmail.com;798524682@qq.com;hobewoos@163.com;243204661@qq.com
About author:First author contact:aThese authors contributed equally to this work and should be deemed as co-first authors.Supported by:摘要:
目的 通过Th1/Th2细胞因子数据识别具有不同炎症特征的脓毒症亚型以制定个性化治疗方案,改善患者预后。 方法 在南方医科大学南方医院数据库中检索2020年6月1日~2022年2月1日期间接受Th1/Th2细胞因子检测的脓毒症患者数据。通过无监督K-均值聚类方法,根据Th1/Th2细胞因子水平对研究对象进行分类,主要研究终点为入ICU后7 d死亡率。采用Cox比例风险模型和限制平均生存时间(RMST)分析不同类型患者的生存结局。 结果 共纳入321例脓毒症患者。IL-6(HR=1.69,95% CI:1.22~2.34)和IL-10(HR=1.81,95% CI:1.37~2.40)被确定为患者入ICU后7 d内死亡率的独立预测因子。无监督K-均值聚类分析识别出3种炎症/免疫亚组:亚组1(n=166,低炎症反应)、亚组2(n=99,中度炎症反应伴免疫抑制)、亚组3(n=56,强烈炎症和免疫抑制)。与亚组1相比,亚组2和亚组3的患者入ICU后7 d内死亡风险更高(14.4% vs 23.2%,HR=4.30,95% CI:1.51~12.26; 14.4% vs 35.7%, HR=7.32, 95% CI:2.57~20.79)。 结论 处于保护性免疫反应状态(亚组1)的脓毒症患者短期预后较好,提示准确识别患者的炎症/免疫状态对精准治疗和改善结局的重要性。
沙桐, 王文研, 宣佳斌, 吴洁, 石能贤, 何劲, 胡鸿彬, 张耀元. 基于Th1/Th2细胞因子检测的脓毒症免疫状态分型及预后分析:一项回顾性研究[J]. 南方医科大学学报, 2026, 46(1): 6-22.
Tong SHA, Wenyan WANG, Jiabin XUAN, Jie WU, Nengxian SHI, Jin HE, Hongbin HU, Yaoyuan ZHANG. Identification of immune status subtypes and prognostic analysis of septic patients based on Th1/Th2 cytokine assays[J]. Journal of Southern Medical University, 2026, 46(1): 6-22.
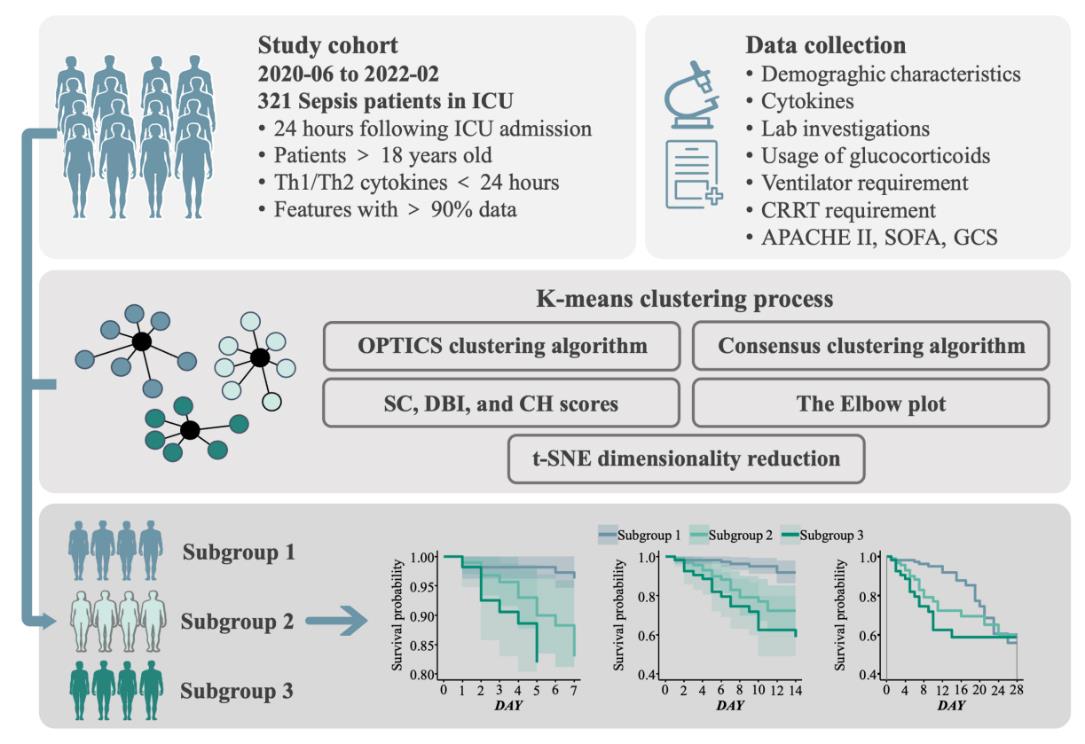
Fig.1 Flow sheet of patient inclusion, data processing and subgroup identification. OPTICS: Ordering points to identify the clustering structure; SC: Silhouette score; DBI: Davies-Bouldin index; CH: Calinski-Harabasz score; t-SNE: t-distributed Stochastic Neighbor Embedding.
| Characteristics | Median [IQR]) or n(%) |
|---|---|
| Age (year) | 58.0 [46.0, 69.0] |
| Male | 242 (75.4%) |
| Admission type (surgery) | 164 (51.1%) |
| SOFA score | 7.0 [4.0, 10.0] |
| APACHE II score | 19.0 [13.0, 26.0] |
| Hypertension | 96 (29.9%) |
| Diabetes mellitus | 72 (22.4%) |
| Congestive heart failure | 36 (11.2%) |
| COPD | 14 (4.4%) |
| CKD | 29 (9.0%) |
| Chronic liver insufficiency | 59 (18.4%) |
| Malignant tumors | 99 (30.8%) |
| Immune system disorders | 29 (9.0%) |
| Trauma | 33 (10.3%) |
| ARDS | 113 (35.2%) |
| Antibiotics | 273 (85.0%) |
| Vasopressors | 213 (66.4%) |
| Norepinephrine equivalent | 0.09 [0.00, 0.24] |
| Positive inotropic drugs | 27 (8.4%) |
| Glucocorticoid | 32 (10.0%) |
| Ventilation time (h) | 3.0 [1.0, 9.0] |
| RRT | 91 (28.3%) |
| WBC (×109/L) | 12.09 [7.62, 16.65] |
| NEU (%) | 86.9 [79.9, 92.3] |
| LYM (%) | 6.8 [3.5, 11.5] |
| MONO (%) | 4.8 [2.8, 7.2] |
| PLT (×109/L) | 139.0 [70.0, 220.0] |
| CRP (mg/L) | 80.80 [37.77, 170.89] |
| PCT (ng/mL) | 2.23 [0.40, 11.18] |
| IL-2 (pg/mL) | 0.86 [0.55, 1.38] |
| IL-4 (pg/mL) | 1.13 [0.72, 1.69] |
| Log(IL-6) (pg/mL) | 5.01 [4.04, 6.63] |
| Log(IL-10) (pg/mL) | 2.53 [1.78, 3.55] |
| TNF (pg/mL) | 1.23 [0.87, 1.75] |
| IFN (pg/mL) | 1.32 [0.85, 1.90] |
| Hospital mortality at ICU 67 (20.9%) | |
Tab.1 Baseline characteristics of all participants in this study (n=321)
| Characteristics | Median [IQR]) or n(%) |
|---|---|
| Age (year) | 58.0 [46.0, 69.0] |
| Male | 242 (75.4%) |
| Admission type (surgery) | 164 (51.1%) |
| SOFA score | 7.0 [4.0, 10.0] |
| APACHE II score | 19.0 [13.0, 26.0] |
| Hypertension | 96 (29.9%) |
| Diabetes mellitus | 72 (22.4%) |
| Congestive heart failure | 36 (11.2%) |
| COPD | 14 (4.4%) |
| CKD | 29 (9.0%) |
| Chronic liver insufficiency | 59 (18.4%) |
| Malignant tumors | 99 (30.8%) |
| Immune system disorders | 29 (9.0%) |
| Trauma | 33 (10.3%) |
| ARDS | 113 (35.2%) |
| Antibiotics | 273 (85.0%) |
| Vasopressors | 213 (66.4%) |
| Norepinephrine equivalent | 0.09 [0.00, 0.24] |
| Positive inotropic drugs | 27 (8.4%) |
| Glucocorticoid | 32 (10.0%) |
| Ventilation time (h) | 3.0 [1.0, 9.0] |
| RRT | 91 (28.3%) |
| WBC (×109/L) | 12.09 [7.62, 16.65] |
| NEU (%) | 86.9 [79.9, 92.3] |
| LYM (%) | 6.8 [3.5, 11.5] |
| MONO (%) | 4.8 [2.8, 7.2] |
| PLT (×109/L) | 139.0 [70.0, 220.0] |
| CRP (mg/L) | 80.80 [37.77, 170.89] |
| PCT (ng/mL) | 2.23 [0.40, 11.18] |
| IL-2 (pg/mL) | 0.86 [0.55, 1.38] |
| IL-4 (pg/mL) | 1.13 [0.72, 1.69] |
| Log(IL-6) (pg/mL) | 5.01 [4.04, 6.63] |
| Log(IL-10) (pg/mL) | 2.53 [1.78, 3.55] |
| TNF (pg/mL) | 1.23 [0.87, 1.75] |
| IFN (pg/mL) | 1.32 [0.85, 1.90] |
| Hospital mortality at ICU 67 (20.9%) | |
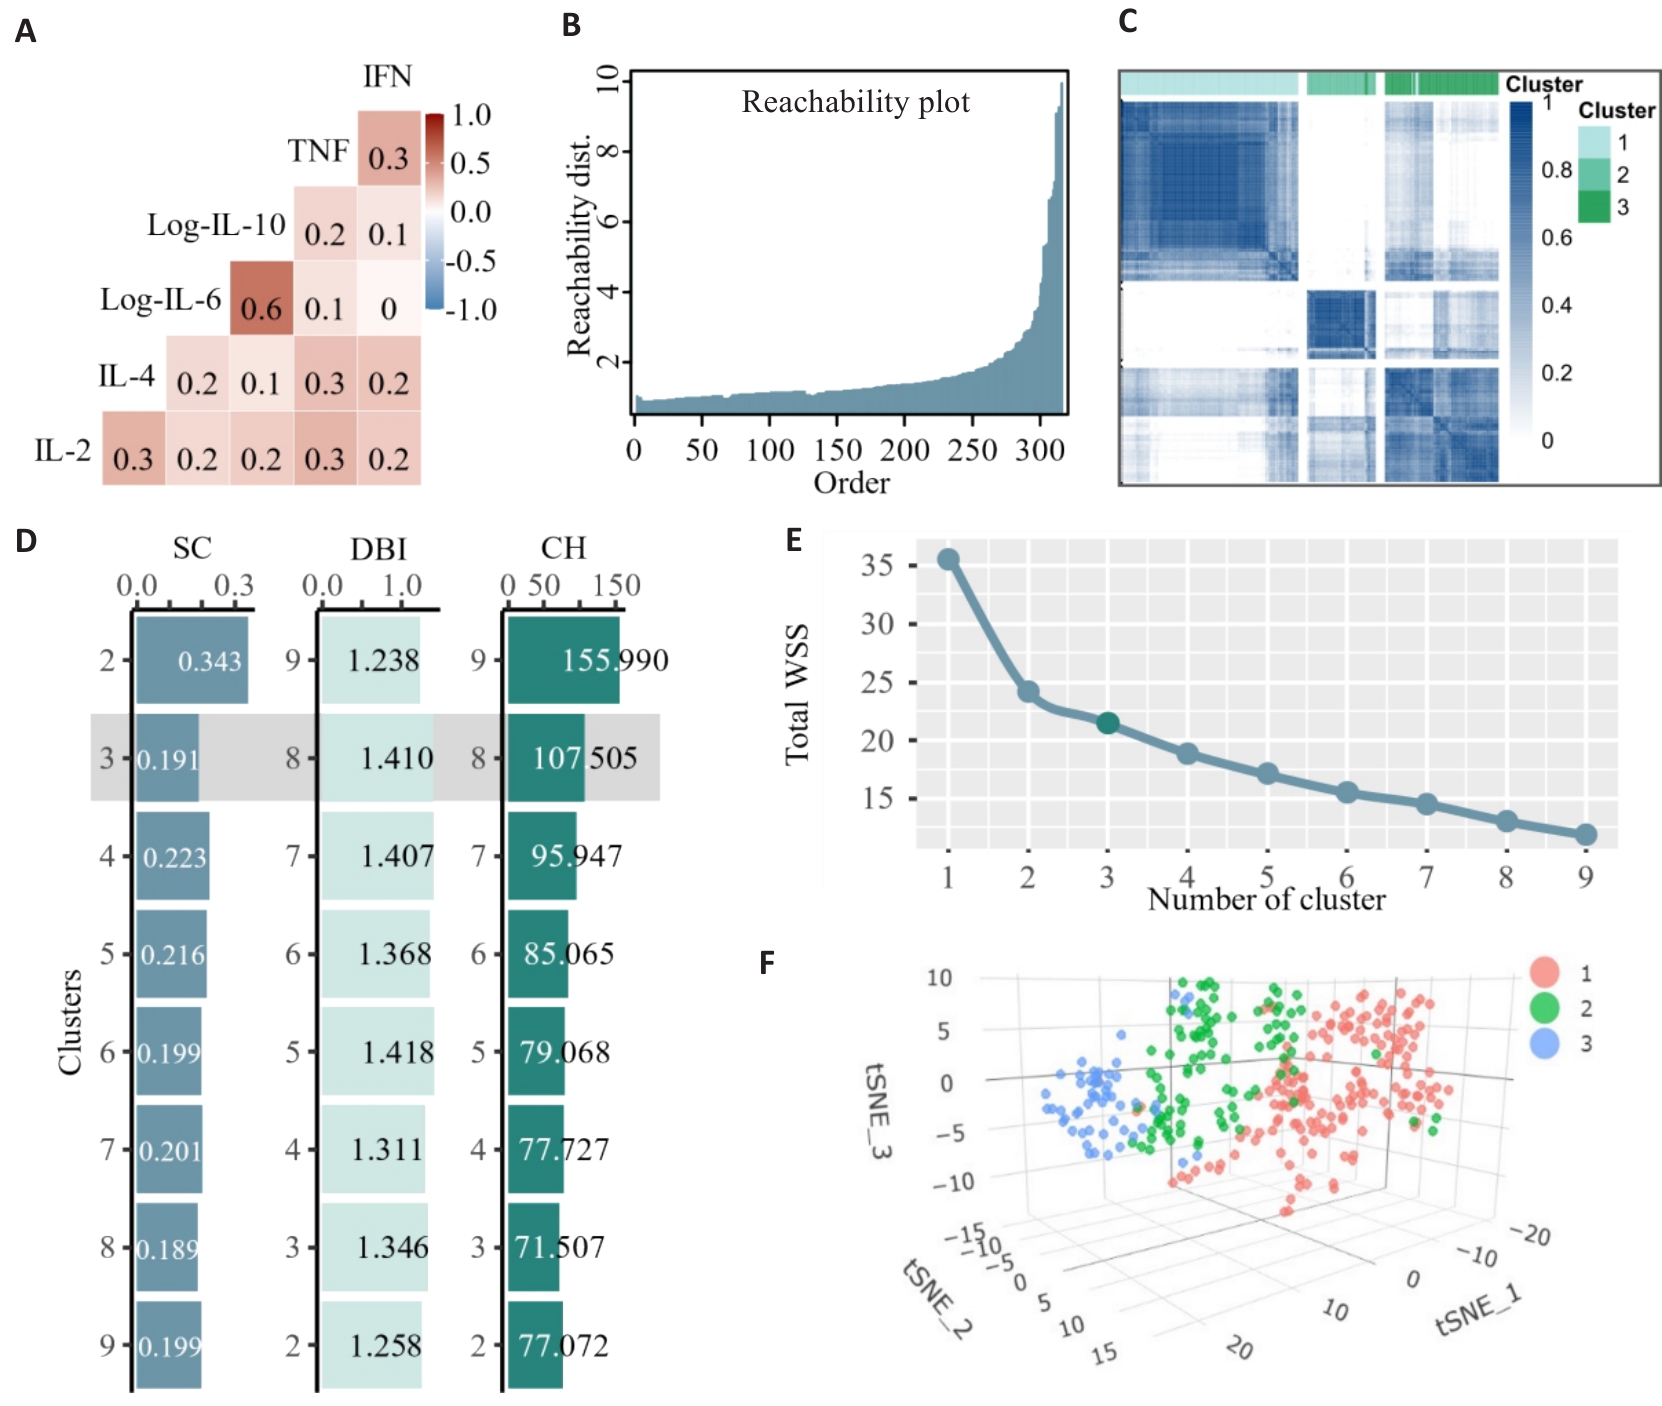
Fig.2 Identification of the number of clusters of cytokine sub-phenotypes. A: Heat-map of pairwise correlations of the cytokines. B: OPTICS plot displaying a smooth rise in reachability distance. C: Heat map of the consensus matrix when the number of clusters was 3 (k=3). D: Histogram of SC, DBI, and CH values from k=2 to k=9 for clustering. E: Elbow plot showing the Total Within Cluster Sum of Squares (total WSS) for the number of clusters between 1 and 9. F: Visualization of K-means clustering results for 321 patients with sepsis based on cytokine profiles.
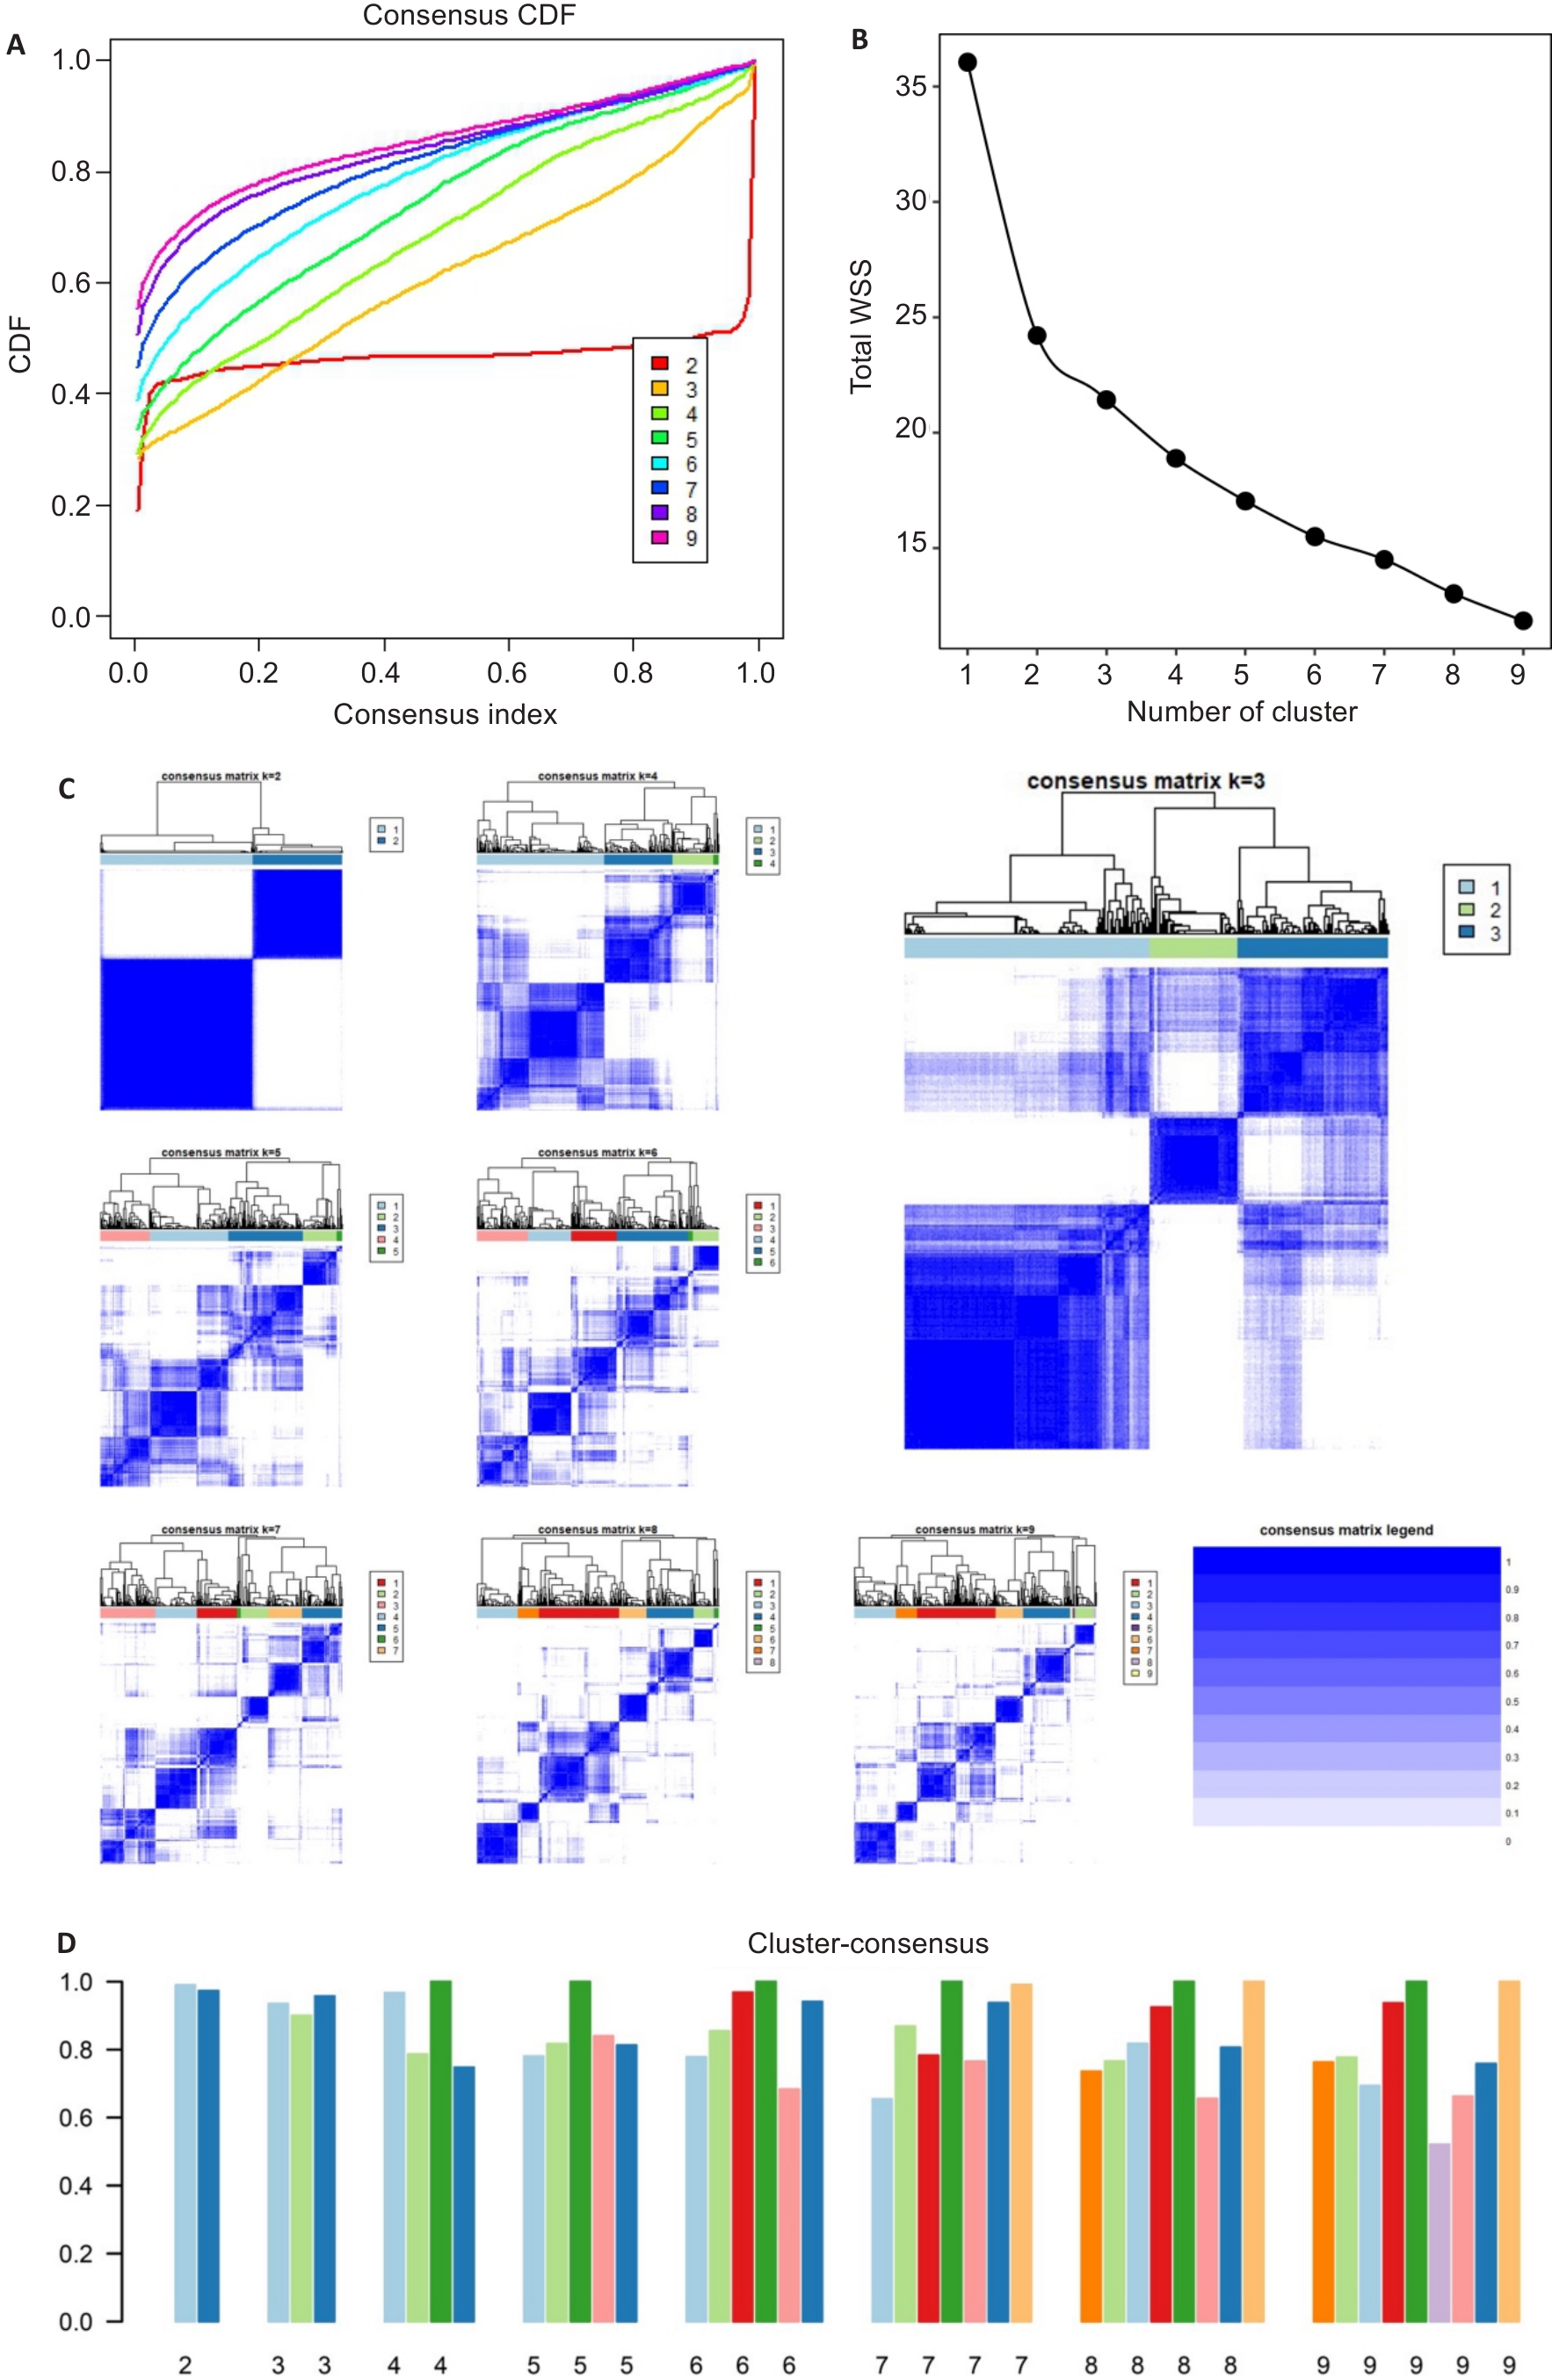
Fig.3 Results of consensus clustering. The CDF graph shows the consensus distribution of each cluster (A). The delta area plot displays the relative change in the area under the CDF curve (B). The maximum change in the area occurs between k=2 and k=9 when the relative increase in the area becomes significantly smaller. As shown in the CM heat map (C), cluster 2 and cluster 3 identified by the K-means algorithm have clear boundaries, indicating good cluster stability in repeated iterations. The mean cluster consensus score was comparable between a scenario of 2 or 3 clusters (D).
| Variable | 25th percentile | Median | Mean | 75th percentile |
|---|---|---|---|---|
| IL2 | 0.032 | 0.051 | 0.074 | 0.081 |
| IL4 | 0.118 | 0.185 | 0.203 | 0.277 |
| Log(IL-6) | 0.370 | 0.474 | 0.505 | 0.648 |
| Log(IL10) | 0.243 | 0.336 | 0.366 | 0.464 |
| TNF | 0.048 | 0.068 | 0.088 | 0.097 |
| IFN | 0.013 | 0.020 | 0.038 | 0.028 |
Tab.2 Distributions of the studied cytokines after Min-Max scaling
| Variable | 25th percentile | Median | Mean | 75th percentile |
|---|---|---|---|---|
| IL2 | 0.032 | 0.051 | 0.074 | 0.081 |
| IL4 | 0.118 | 0.185 | 0.203 | 0.277 |
| Log(IL-6) | 0.370 | 0.474 | 0.505 | 0.648 |
| Log(IL10) | 0.243 | 0.336 | 0.366 | 0.464 |
| TNF | 0.048 | 0.068 | 0.088 | 0.097 |
| IFN | 0.013 | 0.020 | 0.038 | 0.028 |
| Characteristics | Cluster 1 | Cluster 2 | Cluster 3 | P |
|---|---|---|---|---|
| n (%) | 166 (51.7%) | 99 (30.8%) | 56 (17.4%) | |
| Age (year) | 58.00 [45.25, 66.75] | 57.00 [45.50, 69.00] | 61.00 [50.00, 69.25] | 0.617 |
| Male | 125 (75.3) | 76 (76.8) | 41 (73.2) | 0.885 |
| Admission type (surgery) | 83 (50.0) | 55 (55.6) | 26 (46.4) | 0.508 |
| SOFA score | 6.00 [4.00, 8.00] | 8.00 [5.00, 11.00] | 11.00 [8.75, 12.00] | <0.001 |
| APACHE II score | 18.00 [12.00, 23.00] | 21.00 [14.00, 26.00] | 26.50 [19.75, 32.25] | <0.001 |
| Hypertension | 53 (31.9%) | 26 (26.3%) | 17 (30.4%) | 0.620 |
| Diabetes mellitus | 41 (24.7%) | 21 (21.2%) | 10 (17.9%) | 0.536 |
| Congestive heart failure | 21 (12.7%) | 8 (8.1%) | 7 (12.5%) | 0.493 |
| COPD | 8 (4.8%) | 4 (4.0%) | 2 (3.6%) | 0.909 |
| CKD | 16 (9.6%) | 9 (9.1%) | 4 (7.1%) | 0.853 |
| Chronic liver insufficiency | 32 (19.3%) | 15 (15.2%) | 12 (21.4%) | 0.570 |
| Malignant tumors | 50 (30.1%) | 32 (32.3%) | 17 (30.4%) | 0.928 |
| Immune system disorders | 16 (9.6%) | 10 (10.1%) | 3 (5.4%) | 0.568 |
| Trauma | 18 (10.8%) | 10 (10.1%) | 5 (8.9%) | 0.918 |
| ARDS | 45 (27.1%) | 38 (38.4%) | 30 (53.6%) | 0.001 |
| Antibiotics | 144 (86.7%) | 81 (81.8%) | 48 (85.7%) | 0.547 |
| Vasopressors | 86 (51.8%) | 75 (75.8%) | 52 (92.9%) | <0.001 |
| Norepinephrine equivalent | 0.03 [0.00, 0.16] | 0.10 [0.01, 0.24] | 0.22 [0.10, 0.60] | <0.001 |
| Positive inotropic drugs | 9 (5.4%) | 8 (8.1%) | 10 (17.9%) | 0.015 |
| Glucocorticoid | 13 (7.8%) | 8 (8.1%) | 11 (19.6%) | 0.029 |
| Ventilation time (h) | 3.00 [1.00, 8.75] | 3.00 [1.00, 8.00] | 6.00 [2.75, 10.00] | 0.018 |
| RRT | 33 (19.9%) | 30 (30.3%) | 28 (50.0%) | <0.001 |
| WBC (×109/L) | 11.29 [7.32, 15.16] | 12.81 [8.68, 17.00] | 14.18 [6.12, 20.75] | 0.086 |
| NEU (%) | 83.55 [78.17, 89.77] | 90.20 [84.15, 93.65] | 90.80 [84.42, 93.93] | <0.001 |
| LYM (%) | 8.60 [4.70, 13.17] | 4.90 [2.65, 9.30] | 4.55 [3.15, 8.43] | <0.001 |
| MONO (%) | 5.40 [3.52, 8.10] | 4.40 [2.65, 6.40] | 3.50 [1.60, 4.80] | <0.001 |
| PLT (×109/L) | 160.50 [96.25, 241.25] | 126.00 [63.00, 203.00] | 83.00 [47.00, 150.50] | <0.001 |
| CRP (mg/L) | 67.66 [26.70, 134.38] | 90.88 [49.50, 182.36] | 134.39 [63.26, 228.79] | <0.001 |
| PCT (ng/mL) | 1.15 [0.24, 4.20] | 3.07 [0.52, 9.09] | 23.38 [6.10, 68.22] | <0.001 |
| IL-2 (pg/mL) | 0.86 [0.52, 1.34] | 0.77 [0.52, 1.25] | 1.02 [0.67, 1.95] | 0.027 |
| IL-4 (pg/mL) | 1.14 [0.75, 1.76] | 0.96 [0.62, 1.41] | 1.46 [1.07, 1.94] | 0.003 |
| Log (IL-6, pg/mL) | 4.37 [3.46, 5.11] | 5.44 [4.59, 6.30] | 7.82 [7.10, 8.89] | <0.001 |
| Log (IL-10, pg/mL) | 1.81 [1.43, 2.19] | 3.17 [2.82, 3.62] | 4.86 [4.02, 5.41] | <0.001 |
| TNF (pg/mL) | 1.23 [0.85, 1.78] | 1.12 [0.90, 1.51] | 1.40 [0.95, 2.41] | 0.021 |
| IFN (pg/mL) | 1.27 [0.89, 1.89] | 1.18 [0.69, 1.67] | 1.62 [1.11, 2.27] | 0.005 |
Tab.3 Baseline characteristics of 321 patients stratified by the 3 clusters of cytokines mixture
| Characteristics | Cluster 1 | Cluster 2 | Cluster 3 | P |
|---|---|---|---|---|
| n (%) | 166 (51.7%) | 99 (30.8%) | 56 (17.4%) | |
| Age (year) | 58.00 [45.25, 66.75] | 57.00 [45.50, 69.00] | 61.00 [50.00, 69.25] | 0.617 |
| Male | 125 (75.3) | 76 (76.8) | 41 (73.2) | 0.885 |
| Admission type (surgery) | 83 (50.0) | 55 (55.6) | 26 (46.4) | 0.508 |
| SOFA score | 6.00 [4.00, 8.00] | 8.00 [5.00, 11.00] | 11.00 [8.75, 12.00] | <0.001 |
| APACHE II score | 18.00 [12.00, 23.00] | 21.00 [14.00, 26.00] | 26.50 [19.75, 32.25] | <0.001 |
| Hypertension | 53 (31.9%) | 26 (26.3%) | 17 (30.4%) | 0.620 |
| Diabetes mellitus | 41 (24.7%) | 21 (21.2%) | 10 (17.9%) | 0.536 |
| Congestive heart failure | 21 (12.7%) | 8 (8.1%) | 7 (12.5%) | 0.493 |
| COPD | 8 (4.8%) | 4 (4.0%) | 2 (3.6%) | 0.909 |
| CKD | 16 (9.6%) | 9 (9.1%) | 4 (7.1%) | 0.853 |
| Chronic liver insufficiency | 32 (19.3%) | 15 (15.2%) | 12 (21.4%) | 0.570 |
| Malignant tumors | 50 (30.1%) | 32 (32.3%) | 17 (30.4%) | 0.928 |
| Immune system disorders | 16 (9.6%) | 10 (10.1%) | 3 (5.4%) | 0.568 |
| Trauma | 18 (10.8%) | 10 (10.1%) | 5 (8.9%) | 0.918 |
| ARDS | 45 (27.1%) | 38 (38.4%) | 30 (53.6%) | 0.001 |
| Antibiotics | 144 (86.7%) | 81 (81.8%) | 48 (85.7%) | 0.547 |
| Vasopressors | 86 (51.8%) | 75 (75.8%) | 52 (92.9%) | <0.001 |
| Norepinephrine equivalent | 0.03 [0.00, 0.16] | 0.10 [0.01, 0.24] | 0.22 [0.10, 0.60] | <0.001 |
| Positive inotropic drugs | 9 (5.4%) | 8 (8.1%) | 10 (17.9%) | 0.015 |
| Glucocorticoid | 13 (7.8%) | 8 (8.1%) | 11 (19.6%) | 0.029 |
| Ventilation time (h) | 3.00 [1.00, 8.75] | 3.00 [1.00, 8.00] | 6.00 [2.75, 10.00] | 0.018 |
| RRT | 33 (19.9%) | 30 (30.3%) | 28 (50.0%) | <0.001 |
| WBC (×109/L) | 11.29 [7.32, 15.16] | 12.81 [8.68, 17.00] | 14.18 [6.12, 20.75] | 0.086 |
| NEU (%) | 83.55 [78.17, 89.77] | 90.20 [84.15, 93.65] | 90.80 [84.42, 93.93] | <0.001 |
| LYM (%) | 8.60 [4.70, 13.17] | 4.90 [2.65, 9.30] | 4.55 [3.15, 8.43] | <0.001 |
| MONO (%) | 5.40 [3.52, 8.10] | 4.40 [2.65, 6.40] | 3.50 [1.60, 4.80] | <0.001 |
| PLT (×109/L) | 160.50 [96.25, 241.25] | 126.00 [63.00, 203.00] | 83.00 [47.00, 150.50] | <0.001 |
| CRP (mg/L) | 67.66 [26.70, 134.38] | 90.88 [49.50, 182.36] | 134.39 [63.26, 228.79] | <0.001 |
| PCT (ng/mL) | 1.15 [0.24, 4.20] | 3.07 [0.52, 9.09] | 23.38 [6.10, 68.22] | <0.001 |
| IL-2 (pg/mL) | 0.86 [0.52, 1.34] | 0.77 [0.52, 1.25] | 1.02 [0.67, 1.95] | 0.027 |
| IL-4 (pg/mL) | 1.14 [0.75, 1.76] | 0.96 [0.62, 1.41] | 1.46 [1.07, 1.94] | 0.003 |
| Log (IL-6, pg/mL) | 4.37 [3.46, 5.11] | 5.44 [4.59, 6.30] | 7.82 [7.10, 8.89] | <0.001 |
| Log (IL-10, pg/mL) | 1.81 [1.43, 2.19] | 3.17 [2.82, 3.62] | 4.86 [4.02, 5.41] | <0.001 |
| TNF (pg/mL) | 1.23 [0.85, 1.78] | 1.12 [0.90, 1.51] | 1.40 [0.95, 2.41] | 0.021 |
| IFN (pg/mL) | 1.27 [0.89, 1.89] | 1.18 [0.69, 1.67] | 1.62 [1.11, 2.27] | 0.005 |
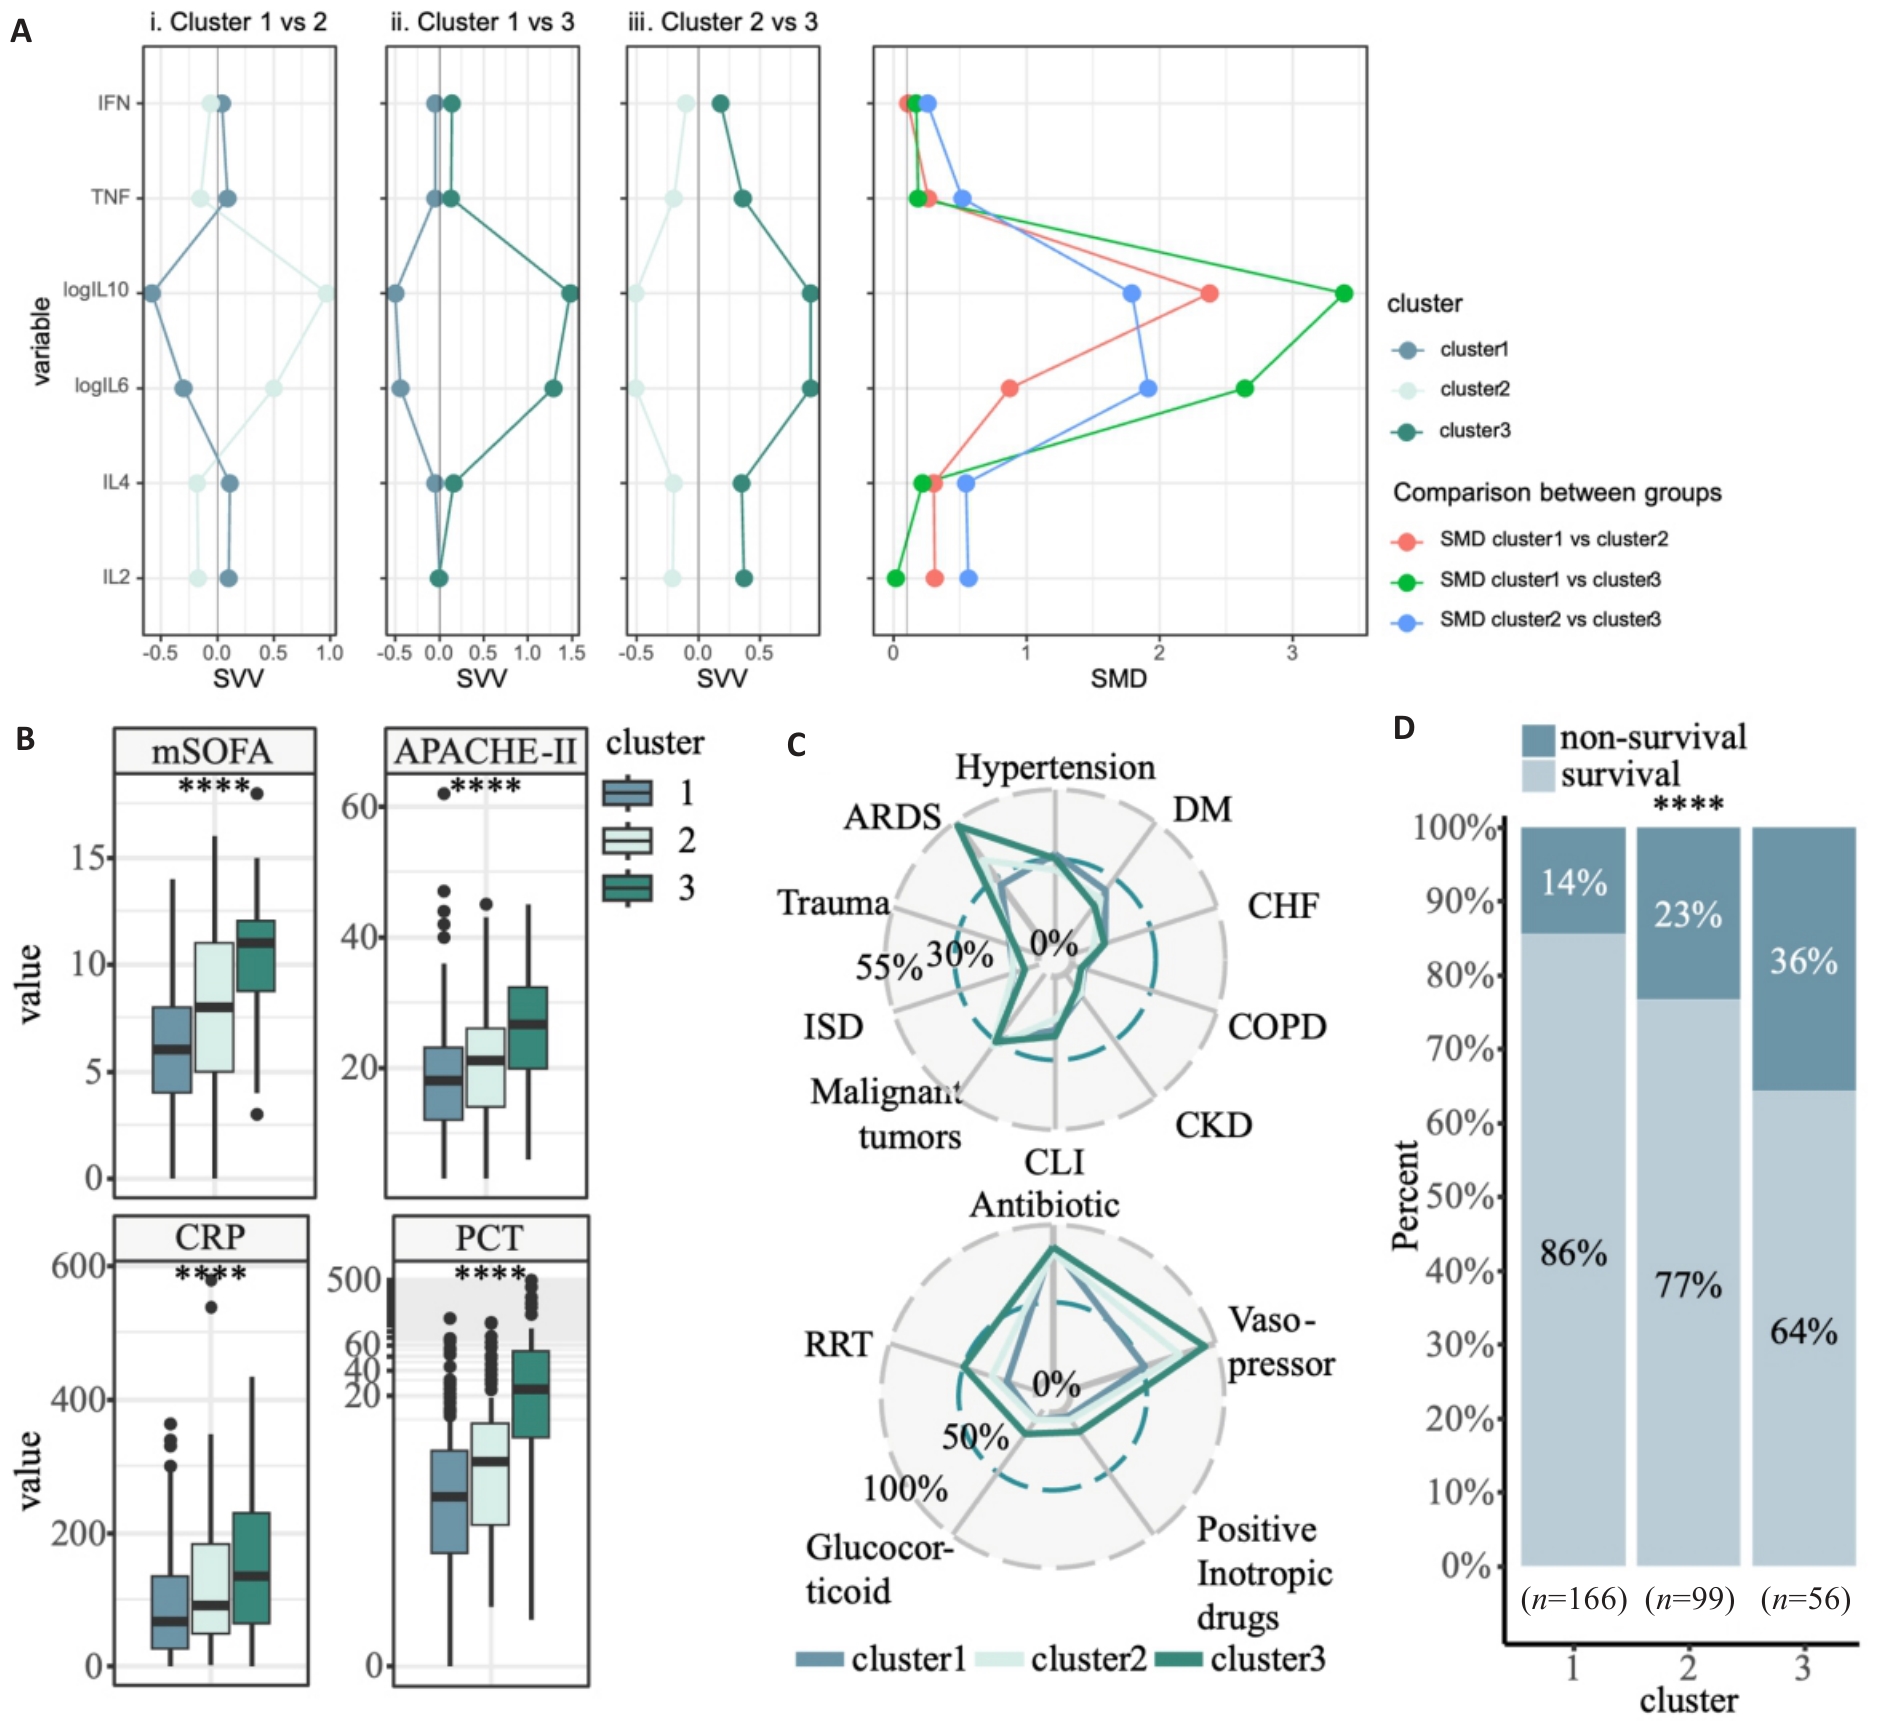
Fig.4 Clinical features of the 3 inflammatory subtypes of sepsis. A: Violin plots of serum cytokine levels in 3 inflammatory subtypes of sepsis. The X-axis represents the 3 subtypes, and the Y-axis represents serum cytokine levels. Comparisons between groups were corrected by false discovery rate (FDR). B: Box plots of mSOFA scores, APACHE-II scores, CRP levels, and PCT levels in the 3 inflammatory subtypes. C: Radar plots of the distribution of comorbidities and treatments in the 3 inflammatory subtypes (DM: Diabetes mellitus; CHF: Congestive heart failure; COPD: Chronic obstructive pulmonary disease; CKD: Chronic kidney disease; CLI: Chronic liver insufficiency; ISD: Immune system disorders; ARDS: Acute respiratory distress syndrome; RRT: Renal replacement therapy). D: Distribution of survival in the 3 inflammatory subtypes. ****P<0.0001.
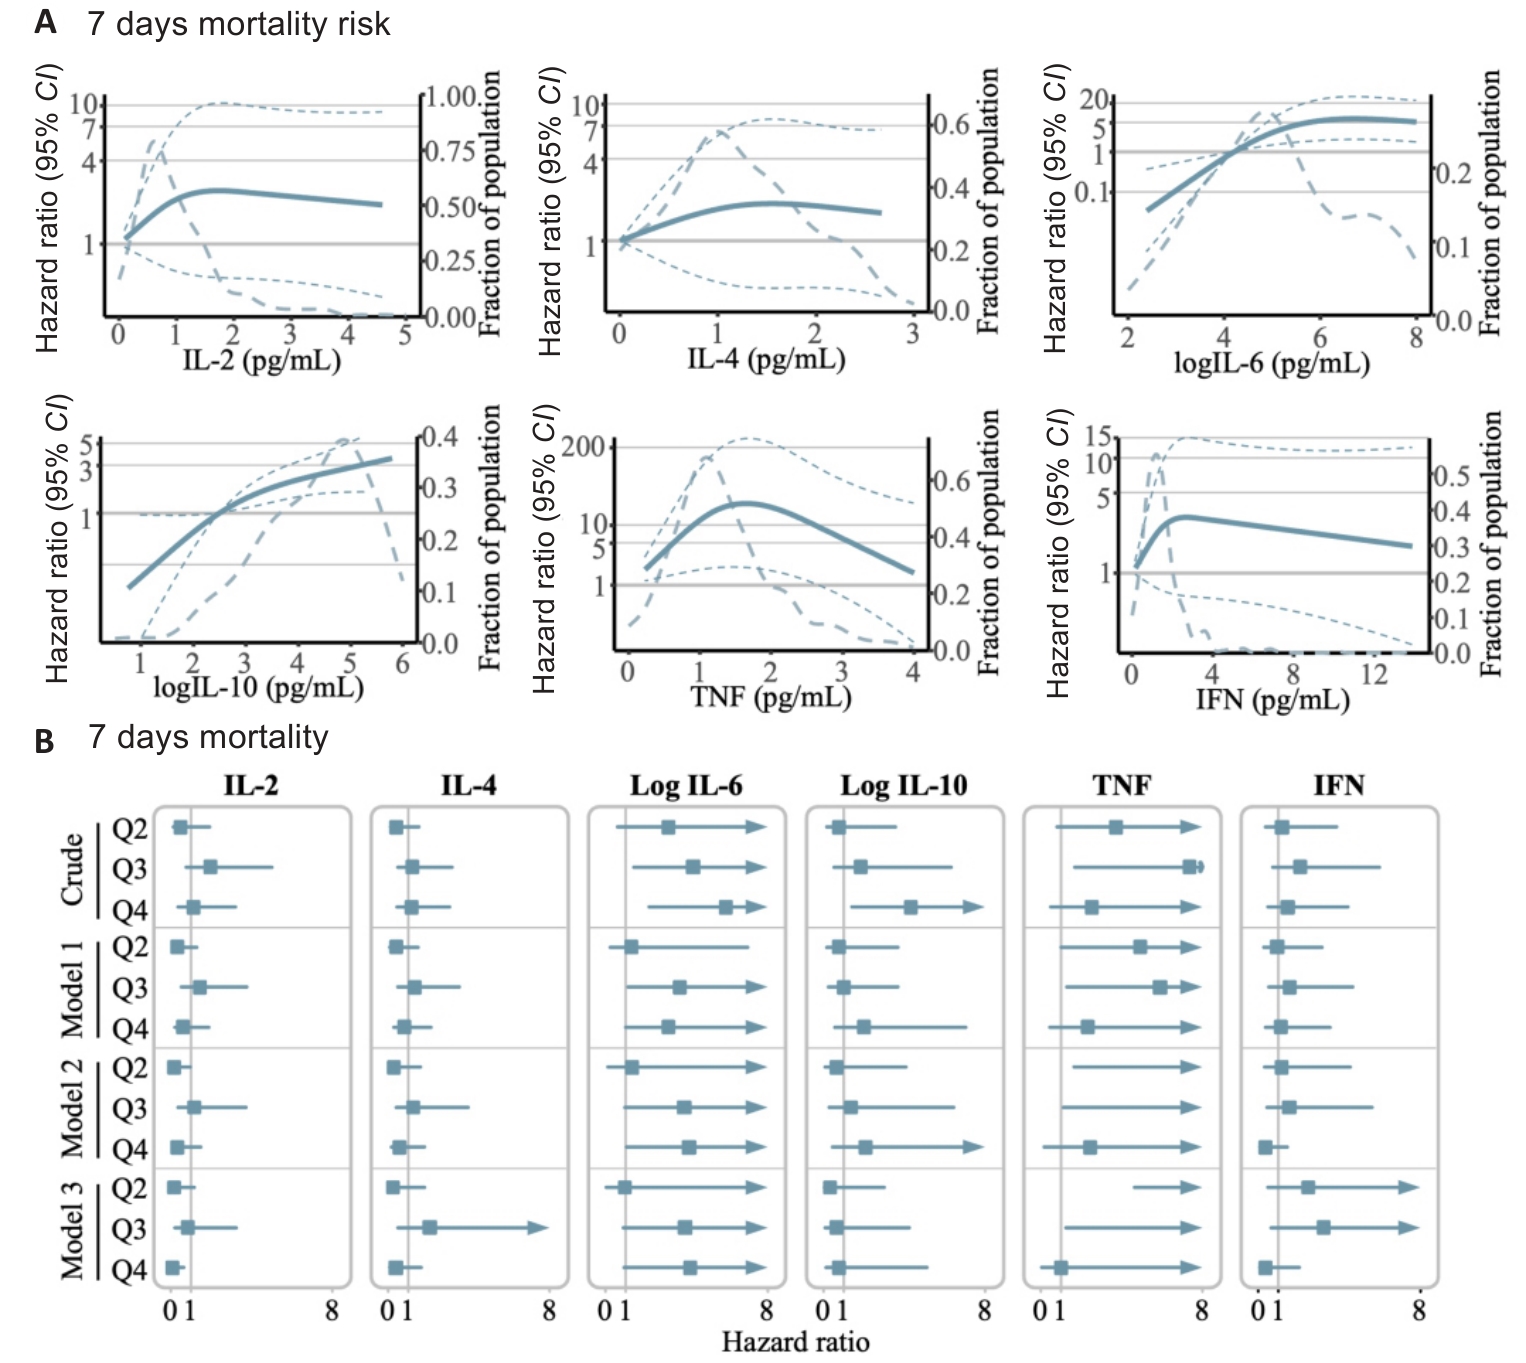
Fig.5 Serum cytokine levels and risk of mortality in septic patients. A: Exposure-response relationship between circulating levels of each of the studied cytokines and the risk for 7 days mortality. The Y-axis represents the hazard ratio of the risk of death for a given value of circulating cytokine levels compared to the corresponding reference value (some values are converted to log10 on the Y-axis). The red dashed line indicates the 95% confidence interval, and the yellow dashed line the proportion of patients. B: Association between different serum cytokine levels and the risk of mortality within 7 days after ICU admission. Model 1 was adjusted for baseline age, sex, and admission type. Model 2 was additionally adjusted for SOFA score, APACHE II score, and relevant treatment history (use of antibiotics, vasopressors, norepinephrine equivalent, positive inotropic drugs, glucocorticoid, ventilation time, and RRT). Model 3 was further adjusted for history of chronic diseases (hypertension, diabetes, congestive heart failure, COPD, CKD, chronic liver insufficiency, malignant tumors, immune system disorders, trauma, ARDS, and CVD).
| Cytokines | 7-day mortality risk | 14-day mortality risk | 28-day mortality risk | |||||
|---|---|---|---|---|---|---|---|---|
| Overall | Non-linear | Overall | Non-linear | Overall | Non-linear | |||
| IL-2 | 0.478 | 0.230 | 0.566 | 0.287 | 0.319 | 0.164 | ||
| IL-4 | 0.695 | 0.475 | 0.867 | 0.757 | 0.912 | 0.847 | ||
| Log(IL-6) | 0.010 | 0.012 | 0.003 | 0.015 | 0.007 | 0.010 | ||
| Log(IL-10) | 0.001 | 0.238 | <0.001 | 0.061 | 0.013 | 0.165 | ||
| TNF | 0.038 | 0.012 | 0.074 | 0.023 | 0.064 | 0.022 | ||
| IFN | 0.345 | 0.148 | 0.669 | 0.417 | 0.719 | 0.491 | ||
Tab.4 P-values of overall and non-linear dose-response relationships of the 6 cytokines with mortality risk
| Cytokines | 7-day mortality risk | 14-day mortality risk | 28-day mortality risk | |||||
|---|---|---|---|---|---|---|---|---|
| Overall | Non-linear | Overall | Non-linear | Overall | Non-linear | |||
| IL-2 | 0.478 | 0.230 | 0.566 | 0.287 | 0.319 | 0.164 | ||
| IL-4 | 0.695 | 0.475 | 0.867 | 0.757 | 0.912 | 0.847 | ||
| Log(IL-6) | 0.010 | 0.012 | 0.003 | 0.015 | 0.007 | 0.010 | ||
| Log(IL-10) | 0.001 | 0.238 | <0.001 | 0.061 | 0.013 | 0.165 | ||
| TNF | 0.038 | 0.012 | 0.074 | 0.023 | 0.064 | 0.022 | ||
| IFN | 0.345 | 0.148 | 0.669 | 0.417 | 0.719 | 0.491 | ||
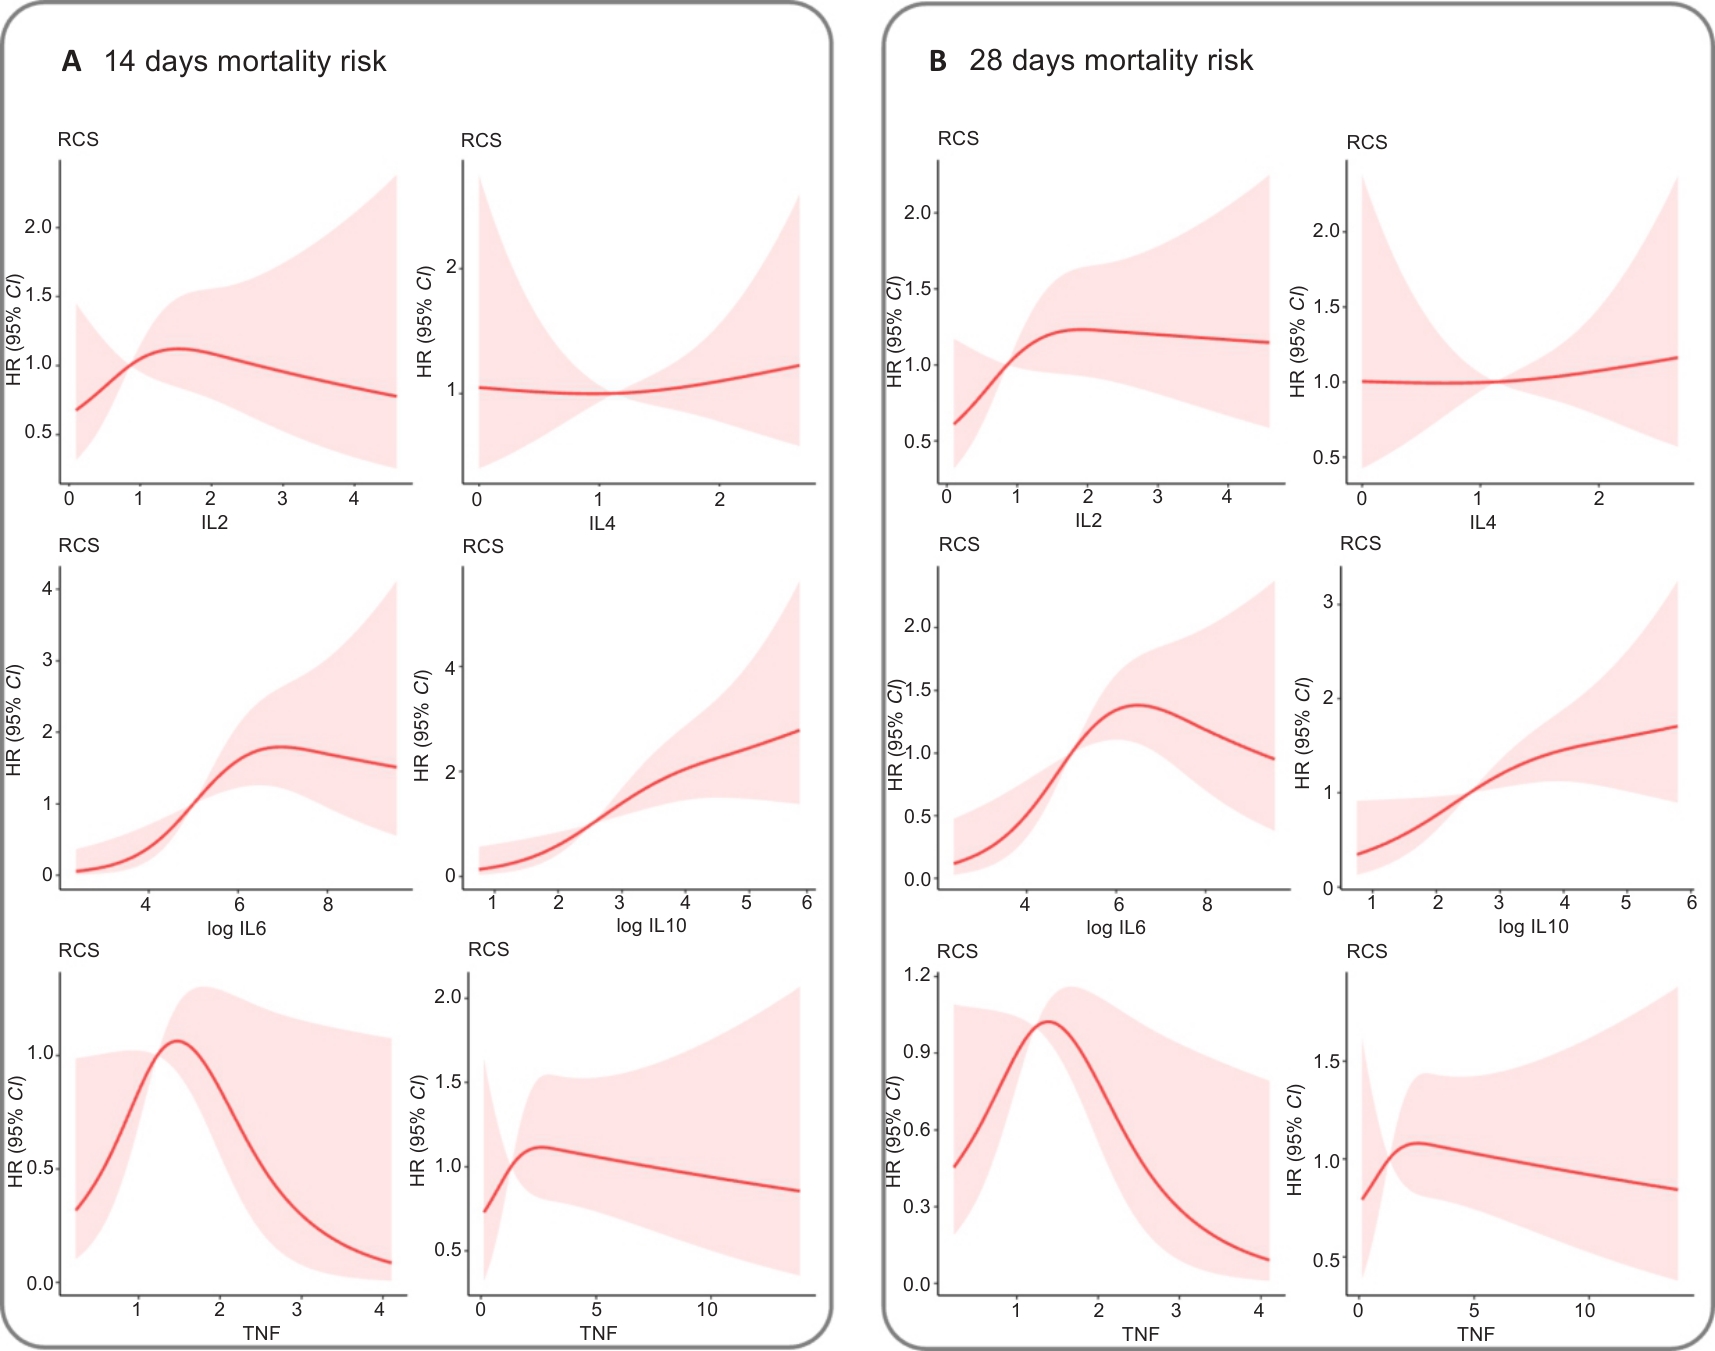
Fig.6 Exposure-response relationship between circulating levels of each of the studied cytokines and the risks of 14 day (A) and 28 day (B) mortality. The Y-axis represents the hazard ratios of mortality risk given the value of circulating cytokine levels compared to the corresponding reference value. The shaded areas indicate the 95 percent confidence intervals.
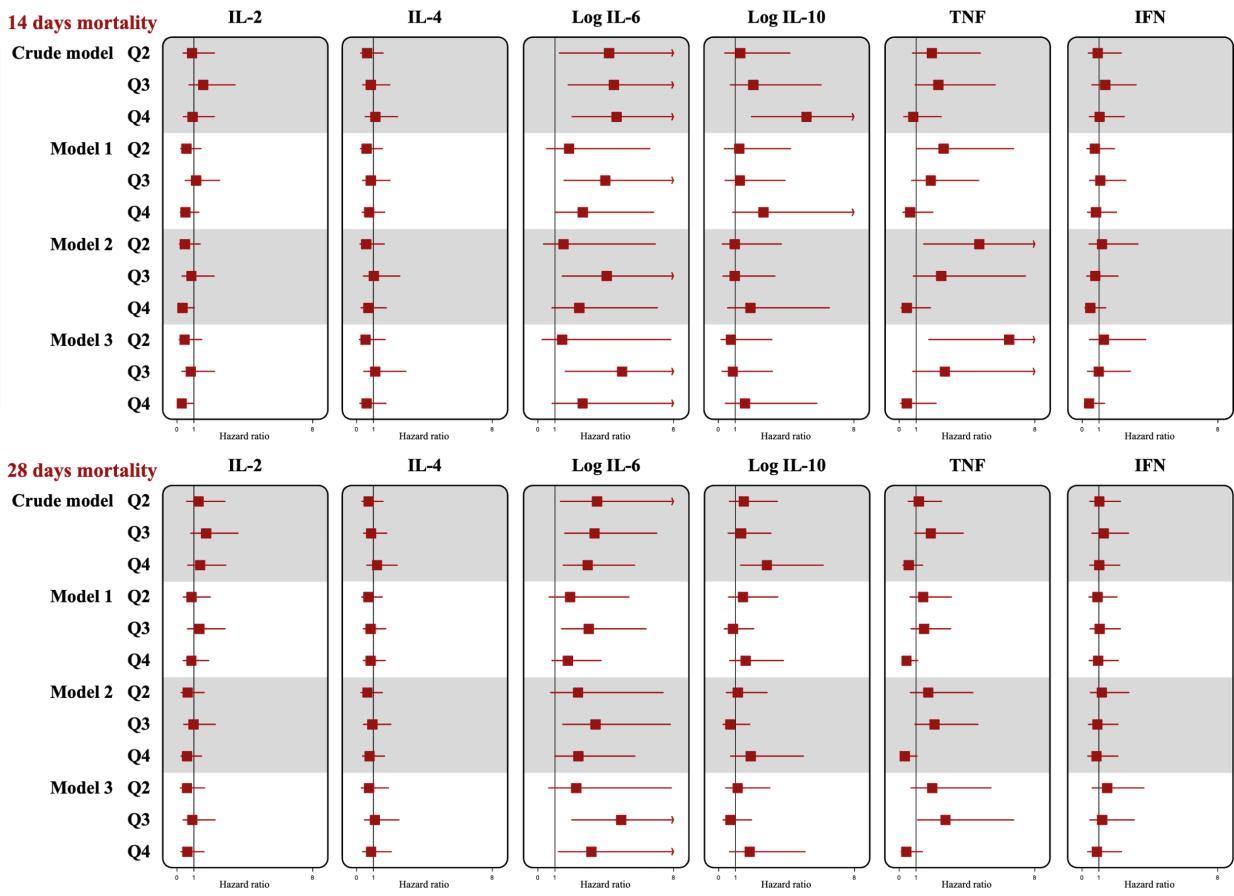
Fig.7 Association between different serum cytokine levels and risk of death at 14 days and 28 days after ICU admission.
| Variable | Crude model | Model l | Model 2 | Model 3 |
|---|---|---|---|---|
| 7-day mortality risk | ||||
| IL-2 | ||||
| Q1 | 1.00 | 1.00 | 1.00 | 1.00 |
| Q2 | 0.51 (0.13, 1.95) | 0.32 (0.08, 1.29) | 0.19 (0.04, 0.96) | 0.18 (0.03, 1.17) |
| Q3 | 1.97 (0.77, 4.99) | 1.44 (0.55, 3.76) | 1.16 (0.36, 3.74) | 0.87 (0.23, 3.23) |
| Q4 | 1.12 (0.39, 3.21) | 0.61 (0.20, 1.90) | 0.35 (0.08, 1.48) | 0.09 (0.01, 0.65) |
| IL-4 | ||||
| Q1 | 1.00 | 1.00 | 1.00 | 1.00 |
| Q2 | 0.40 (0.11, 1.52) | 0.39 (0.10, 1.48) | 0.29 (0.05, 1.60) | 0.25 (0.04, 1.79) |
| Q3 | 1.21 (0.47, 3.14) | 1.32 (0.50, 3.52) | 1.25 (0.40, 3.95) | 2.06 (0.50, 8.48) |
| Q4 | 1.17 (0.45, 3.04) | 0.79 (0.30, 2.12) | 0.57 (0.18, 1.81) | 0.38 (0.09, 1.62) |
| Log (IL-6) | ||||
| Q1 | 1.00 | 1.00 | 1.00 | 1.00 |
| Q2 | 3.09 (0.60, 15.91) | 1.26 (0.23, 7.00) | 1.31 (0.12, 14.46) | 0.95 (0.04, 22.86) |
| Q3 | 4.32 (1.37, 13.62) | 3.66 (1.11, 12.04) | 3.88 (0.94, 15.97) | 3.92 (0.86, 17.82) |
| Q4 | 5.93 (2.16, 16.32) | 3.10 (0.99, 9.70) | 4.12 (1.02, 16.69) | 4.18 (0.90, 19.34) |
| Log (IL-10) | ||||
| Q1 | 1.00 | 1.00 | 1.00 | 1.00 |
| Q2 | 0.79 (0.18, 3.55) | 0.78 (0.17, 3.67) | 0.67 (0.11, 4.07) | 0.34 (0.04, 3.03) |
| Q3 | 1.85 (0.54, 6.32) | 1.00 (0.27, 3.70) | 1.37 (0.29, 6.44) | 0.67 (0.11, 4.23) |
| Q4 | 4.32 (1.43, 13.01) | 2.02 (0.58, 7.06) | 2.10 (0.44, 10.10) | 0.79 (0.12, 5.13) |
| TNF | ||||
| Q1 | 1.00 | 1.00 | 1.00 | 1.00 |
| Q2 | 3.73 (0.79, 17.55) | 4.90 (1.00, 24.13) | 23.56 (1.64, 338.28) | 93.35 (4.62, 1885.71) |
| Q3 | 7.34 (1.67, 32.32) | 5.89 (1.30, 26.74) | 13.27 (1.12, 156.44) | 16.65 (1.23, 225.81) |
| Q4 | 2.52 (0.49, 13.01) | 2.31 (0.43, 12.55) | 2.44 (0.17, 35.54) | 1.01 (0.04, 23.51) |
| IFN | ||||
| Q1 | 1.00 | 1.00 | 1.00 | 1.00 |
| Q2 | 1.17 (0.36, 3.85) | 0.93 (0.28, 3.14) | 1.16 (0.30, 4.55) | 2.47 (0.46, 13.41) |
| Q3 | 2.05 (0.7, 5.99) | 1.54 (0.51, 4.67) | 1.53 (0.42, 5.62) | 3.22 (0.63, 16.49) |
| Q4 | 1.45 (0.48, 4.44) | 1.12 (0.35, 3.56) | 0.34 (0.08, 1.44) | 0.34 (0.06, 2.03) |
| 14-day mortality risk | ||||
| IL-2 | ||||
| Q1 | 1.00 | 1.00 | 1.00 | 1.00 |
| Q2 | 0.89 (0.36, 2.22) | 0.56 (0.22, 1.43) | 0.47 (0.16, 1.37) | 0.45 (0.14, 1.46) |
| Q3 | 1.55 (0.71, 3.43) | 1.13 (0.50, 2.53) | 0.85 (0.32, 2.20) | 0.81 (0.30, 2.23) |
| Q4 | 0.92 (0.38, 2.21) | 0.50 (0.20, 1.29) | 0.33 (0.11, 1.02) | 0.28 (0.08, 0.95) |
| IL-4 | ||||
| Q1 | 1.00 | 1.00 | 1.00 | 1.00 |
| Q2 | 0.62 (0.24, 1.57) | 0.59 (0.23, 1.52) | 0.57 (0.20, 1.64) | 0.53 (0.17, 1.69) |
| Q3 | 0.84 (0.36, 1.96) | 0.84 (0.36, 1.97) | 1.02 (0.41, 2.56) | 1.10 (0.42, 2.91) |
| Q4 | 1.11 (0.51, 2.43) | 0.74 (0.33, 1.67) | 0.69 (0.27, 1.76) | 0.59 (0.2,0 1.75) |
| Log (IL-6) | ||||
| Q1 | 1.00 | 1.00 | 1.00 | 1.00 |
| Q2 | 4.20 (1.26, 13.98) | 1.84 (0.51, 6.60) | 1.51 (0.33, 6.92) | 1.43 (0.26, 7.85) |
| Q3 | 4.48 (1.80, 11.16) | 3.97 (1.55, 10.15) | 4.06 (1.45, 11.35) | 4.97 (1.62, 15.27) |
| Q4 | 4.64 (2.03, 10.60) | 2.65 (1.03, 6.83) | 2.44 (0.84, 7.06) | 2.64 (0.85, 8.17) |
| Log (IL-10) | ||||
| Q1 | 1.00 | 1.00 | 1.00 | 1.00 |
Tab.5 Crude and multi-variate adjusted hazard ratios (95% CI) of mortality risks in relation to levels of the 6 studied cytokines
| Variable | Crude model | Model l | Model 2 | Model 3 |
|---|---|---|---|---|
| 7-day mortality risk | ||||
| IL-2 | ||||
| Q1 | 1.00 | 1.00 | 1.00 | 1.00 |
| Q2 | 0.51 (0.13, 1.95) | 0.32 (0.08, 1.29) | 0.19 (0.04, 0.96) | 0.18 (0.03, 1.17) |
| Q3 | 1.97 (0.77, 4.99) | 1.44 (0.55, 3.76) | 1.16 (0.36, 3.74) | 0.87 (0.23, 3.23) |
| Q4 | 1.12 (0.39, 3.21) | 0.61 (0.20, 1.90) | 0.35 (0.08, 1.48) | 0.09 (0.01, 0.65) |
| IL-4 | ||||
| Q1 | 1.00 | 1.00 | 1.00 | 1.00 |
| Q2 | 0.40 (0.11, 1.52) | 0.39 (0.10, 1.48) | 0.29 (0.05, 1.60) | 0.25 (0.04, 1.79) |
| Q3 | 1.21 (0.47, 3.14) | 1.32 (0.50, 3.52) | 1.25 (0.40, 3.95) | 2.06 (0.50, 8.48) |
| Q4 | 1.17 (0.45, 3.04) | 0.79 (0.30, 2.12) | 0.57 (0.18, 1.81) | 0.38 (0.09, 1.62) |
| Log (IL-6) | ||||
| Q1 | 1.00 | 1.00 | 1.00 | 1.00 |
| Q2 | 3.09 (0.60, 15.91) | 1.26 (0.23, 7.00) | 1.31 (0.12, 14.46) | 0.95 (0.04, 22.86) |
| Q3 | 4.32 (1.37, 13.62) | 3.66 (1.11, 12.04) | 3.88 (0.94, 15.97) | 3.92 (0.86, 17.82) |
| Q4 | 5.93 (2.16, 16.32) | 3.10 (0.99, 9.70) | 4.12 (1.02, 16.69) | 4.18 (0.90, 19.34) |
| Log (IL-10) | ||||
| Q1 | 1.00 | 1.00 | 1.00 | 1.00 |
| Q2 | 0.79 (0.18, 3.55) | 0.78 (0.17, 3.67) | 0.67 (0.11, 4.07) | 0.34 (0.04, 3.03) |
| Q3 | 1.85 (0.54, 6.32) | 1.00 (0.27, 3.70) | 1.37 (0.29, 6.44) | 0.67 (0.11, 4.23) |
| Q4 | 4.32 (1.43, 13.01) | 2.02 (0.58, 7.06) | 2.10 (0.44, 10.10) | 0.79 (0.12, 5.13) |
| TNF | ||||
| Q1 | 1.00 | 1.00 | 1.00 | 1.00 |
| Q2 | 3.73 (0.79, 17.55) | 4.90 (1.00, 24.13) | 23.56 (1.64, 338.28) | 93.35 (4.62, 1885.71) |
| Q3 | 7.34 (1.67, 32.32) | 5.89 (1.30, 26.74) | 13.27 (1.12, 156.44) | 16.65 (1.23, 225.81) |
| Q4 | 2.52 (0.49, 13.01) | 2.31 (0.43, 12.55) | 2.44 (0.17, 35.54) | 1.01 (0.04, 23.51) |
| IFN | ||||
| Q1 | 1.00 | 1.00 | 1.00 | 1.00 |
| Q2 | 1.17 (0.36, 3.85) | 0.93 (0.28, 3.14) | 1.16 (0.30, 4.55) | 2.47 (0.46, 13.41) |
| Q3 | 2.05 (0.7, 5.99) | 1.54 (0.51, 4.67) | 1.53 (0.42, 5.62) | 3.22 (0.63, 16.49) |
| Q4 | 1.45 (0.48, 4.44) | 1.12 (0.35, 3.56) | 0.34 (0.08, 1.44) | 0.34 (0.06, 2.03) |
| 14-day mortality risk | ||||
| IL-2 | ||||
| Q1 | 1.00 | 1.00 | 1.00 | 1.00 |
| Q2 | 0.89 (0.36, 2.22) | 0.56 (0.22, 1.43) | 0.47 (0.16, 1.37) | 0.45 (0.14, 1.46) |
| Q3 | 1.55 (0.71, 3.43) | 1.13 (0.50, 2.53) | 0.85 (0.32, 2.20) | 0.81 (0.30, 2.23) |
| Q4 | 0.92 (0.38, 2.21) | 0.50 (0.20, 1.29) | 0.33 (0.11, 1.02) | 0.28 (0.08, 0.95) |
| IL-4 | ||||
| Q1 | 1.00 | 1.00 | 1.00 | 1.00 |
| Q2 | 0.62 (0.24, 1.57) | 0.59 (0.23, 1.52) | 0.57 (0.20, 1.64) | 0.53 (0.17, 1.69) |
| Q3 | 0.84 (0.36, 1.96) | 0.84 (0.36, 1.97) | 1.02 (0.41, 2.56) | 1.10 (0.42, 2.91) |
| Q4 | 1.11 (0.51, 2.43) | 0.74 (0.33, 1.67) | 0.69 (0.27, 1.76) | 0.59 (0.2,0 1.75) |
| Log (IL-6) | ||||
| Q1 | 1.00 | 1.00 | 1.00 | 1.00 |
| Q2 | 4.20 (1.26, 13.98) | 1.84 (0.51, 6.60) | 1.51 (0.33, 6.92) | 1.43 (0.26, 7.85) |
| Q3 | 4.48 (1.80, 11.16) | 3.97 (1.55, 10.15) | 4.06 (1.45, 11.35) | 4.97 (1.62, 15.27) |
| Q4 | 4.64 (2.03, 10.60) | 2.65 (1.03, 6.83) | 2.44 (0.84, 7.06) | 2.64 (0.85, 8.17) |
| Log (IL-10) | ||||
| Q1 | 1.00 | 1.00 | 1.00 | 1.00 |
| Variables | Crude model | Model l | Model 2 | Model 3 |
|---|---|---|---|---|
| 7-days mortality risk | ||||
| IL2 | 1.02 (0.71, 1.46) | 0.92 (0.55, 1.53) | 0.95 (0.45, 2.00) | 0.36 (0.12, 1.11) |
| IL4 | 1.09 (0.77, 1.56) | 1.02 (0.71, 1.48) | 0.85 (0.56, 1.30) | 0.75 (0.47, 1.22) |
| Log-IL6 | 1.69 (1.22, 2.34) | 1.42 (0.97, 2.08) | 1.91 (1.08, 3.37) | 2.00 (1.03, 3.91) |
| Log-IL10 | 1.81 (1.37, 2.40) | 1.41 (1.00, 1.99) | 1.45 (0.90, 2.33) | 1.20 (0.70, 2.06) |
| TNF | 0.94 (0.57, 1.56) | 0.83 (0.45, 1.55) | 0.47 (0.20, 1.09) | 0.34 (0.13, 0.92) |
| IFN | 0.87 (0.50, 1.53) | 0.74 (0.41, 1.35) | 0.56 (0.21, 1.49) | 0.09 (0.01, 0.63) |
| 14-day mortality risk | ||||
| IL2 | 0.95 (0.66, 1.38) | 0.79 (0.46, 1.34) | 0.63 (0.31, 1.25) | 0.46 (0.20, 1.03) |
| IL4 | 1.06 (0.79, 1.44) | 1.00 (0.72, 1.38) | 0.98 (0.71, 1.36) | 0.99 (0.70, 1.41) |
| Log-IL6 | 1.62 (1.24, 2.12) | 1.39 (1.01, 1.91) | 1.37 (0.92, 2.04) | 1.45 (0.94, 2.22) |
| Log-IL10 | 1.71 (1.36, 2.15) | 1.30 (0.97, 1.73) | 1.40 (0.93, 2.10) | 1.35 (0.89, 2.05) |
| TNF | 0.79 (0.46, 1.37) | 0.61 (0.33, 1.12) | 0.35 (0.16, 0.77) | 0.30 (0.13, 0.71) |
| IFN | 0.91 (0.61, 1.37) | 0.75 (0.49, 1.16) | 0.57 (0.31, 1.03) | 0.41 (0.20, 0.84) |
| 28-day mortality risk | ||||
| IL2 | 1.08 (0.84, 1.39) | 1.02 (0.74, 1.39) | 0.97 (0.68, 1.38) | 1.00 (0.66, 1.53) |
| IL4 | 1.05 (0.81, 1.37) | 0.98 (0.74, 1.30) | 0.97 (0.73, 1.28) | 1.01 (0.75, 1.36) |
| Log-IL6 | 1.36 (1.08, 1.72) | 1.16 (0.89, 1.51) | 1.26 (0.90, 1.76) | 1.38 (0.98, 1.96) |
| Log-IL10 | 1.37 (1.11, 1.69) | 1.07 (0.83, 1.38) | 1.34 (0.93, 1.95) | 1.32 (0.91, 1.92) |
| TNF | 0.73 (0.44, 1.20) | 0.56 (0.32, 0.98) | 0.43 (0.23, 0.82) | 0.45 (0.23, 0.86) |
| IFN | 0.91 (0.62, 1.33) | 0.81 (0.54, 1.20) | 0.69 (0.42, 1.13) | 0.57 (0.33, 0.98) |
Tab.6 Crude and multi-variate adjusted hazard ratios (95% CIs) of the 7-, 14-, and 28-day mortality risks in relation to the per SD increase in the six studied cytokines
| Variables | Crude model | Model l | Model 2 | Model 3 |
|---|---|---|---|---|
| 7-days mortality risk | ||||
| IL2 | 1.02 (0.71, 1.46) | 0.92 (0.55, 1.53) | 0.95 (0.45, 2.00) | 0.36 (0.12, 1.11) |
| IL4 | 1.09 (0.77, 1.56) | 1.02 (0.71, 1.48) | 0.85 (0.56, 1.30) | 0.75 (0.47, 1.22) |
| Log-IL6 | 1.69 (1.22, 2.34) | 1.42 (0.97, 2.08) | 1.91 (1.08, 3.37) | 2.00 (1.03, 3.91) |
| Log-IL10 | 1.81 (1.37, 2.40) | 1.41 (1.00, 1.99) | 1.45 (0.90, 2.33) | 1.20 (0.70, 2.06) |
| TNF | 0.94 (0.57, 1.56) | 0.83 (0.45, 1.55) | 0.47 (0.20, 1.09) | 0.34 (0.13, 0.92) |
| IFN | 0.87 (0.50, 1.53) | 0.74 (0.41, 1.35) | 0.56 (0.21, 1.49) | 0.09 (0.01, 0.63) |
| 14-day mortality risk | ||||
| IL2 | 0.95 (0.66, 1.38) | 0.79 (0.46, 1.34) | 0.63 (0.31, 1.25) | 0.46 (0.20, 1.03) |
| IL4 | 1.06 (0.79, 1.44) | 1.00 (0.72, 1.38) | 0.98 (0.71, 1.36) | 0.99 (0.70, 1.41) |
| Log-IL6 | 1.62 (1.24, 2.12) | 1.39 (1.01, 1.91) | 1.37 (0.92, 2.04) | 1.45 (0.94, 2.22) |
| Log-IL10 | 1.71 (1.36, 2.15) | 1.30 (0.97, 1.73) | 1.40 (0.93, 2.10) | 1.35 (0.89, 2.05) |
| TNF | 0.79 (0.46, 1.37) | 0.61 (0.33, 1.12) | 0.35 (0.16, 0.77) | 0.30 (0.13, 0.71) |
| IFN | 0.91 (0.61, 1.37) | 0.75 (0.49, 1.16) | 0.57 (0.31, 1.03) | 0.41 (0.20, 0.84) |
| 28-day mortality risk | ||||
| IL2 | 1.08 (0.84, 1.39) | 1.02 (0.74, 1.39) | 0.97 (0.68, 1.38) | 1.00 (0.66, 1.53) |
| IL4 | 1.05 (0.81, 1.37) | 0.98 (0.74, 1.30) | 0.97 (0.73, 1.28) | 1.01 (0.75, 1.36) |
| Log-IL6 | 1.36 (1.08, 1.72) | 1.16 (0.89, 1.51) | 1.26 (0.90, 1.76) | 1.38 (0.98, 1.96) |
| Log-IL10 | 1.37 (1.11, 1.69) | 1.07 (0.83, 1.38) | 1.34 (0.93, 1.95) | 1.32 (0.91, 1.92) |
| TNF | 0.73 (0.44, 1.20) | 0.56 (0.32, 0.98) | 0.43 (0.23, 0.82) | 0.45 (0.23, 0.86) |
| IFN | 0.91 (0.62, 1.33) | 0.81 (0.54, 1.20) | 0.69 (0.42, 1.13) | 0.57 (0.33, 0.98) |
| Variable | Crude model | Model l | Model 2 | Model 3 |
|---|---|---|---|---|
| Q2 | 1.29 (0.39, 4.23) | 1.24 (0.36, 4.26) | 0.97 (0.25, 3.72) | 0.74 (0.17, 3.17) |
| Q3 | 2.07 (0.71, 6.06) | 1.27 (0.41, 3.94) | 0.97 (0.28, 3.35) | 0.86 (0.23, 3.19) |
| Q4 | 5.2 (1.96, 13.8) | 2.66 (0.87, 8.11) | 1.90 (0.55, 6.55) | 1.58 (0.43, 5.82) |
| TNF | ||||
| Q1 | 1.00 | 1.00 | 1.00 | 1.00 |
| Q2 | 1.93 (0.78, 4.79) | 2.62 (1.02, 6.76) | 4.72 (1.44, 15.43) | 6.48 (1.75, 23.98) |
| Q3 | 2.31 (0.94, 5.66) | 1.86 (0.74, 4.69) | 2.48 (0.83, 7.45) | 2.69 (0.80, 9.01) |
| Q4 | 0.83 (0.28, 2.48) | 0.64 (0.21, 1.98) | 0.45 (0.11, 1.84) | 0.45 (0.09, 2.18) |
| IFN | ||||
| Q1 | 1.00 | 1.00 | 1.00 | 1.00 |
| Q2 | 0.92 (0.36, 2.32) | 0.75 (0.29, 1.92) | 1.17 (0.41, 3.30) | 1.28 (0.44, 3.75) |
| Q3 | 1.36 (0.58, 3.18) | 1.07 (0.45, 2.57) | 0.77 (0.28, 2.12) | 0.98 (0.33, 2.85) |
| Q4 | 1.03 (0.43, 2.50) | 0.82 (0.33, 2.03) | 0.48 (0.17, 1.40) | 0.41 (0.13, 1.34) |
| 28-day mortality risk | ||||
| IL-2 | ||||
| Q1 | 1.00 | 1.00 | 1.00 | 1.00 |
| Q2 | 1.27 (0.57, 2.84) | 0.86 (0.38, 1.97) | 0.63 (0.25, 1.60) | 0.59 (0.21, 1.65) |
| Q3 | 1.72 (0.82, 3.61) | 1.33 (0.62, 2.85) | 0.97 (0.41, 2.27) | 0.90 (0.36, 2.25) |
| Q4 | 1.37 (0.65, 2.89) | 0.85 (0.38, 1.88) | 0.60 (0.25, 1.46) | 0.61 (0.23, 1.59) |
| IL-4 | ||||
| Q1 | 1.00 | 1.00 | 1.00 | 1.00 |
| Q2 | 0.71 (0.32, 1.57) | 0.69 (0.31, 1.53) | 0.64 (0.27, 1.53) | 0.74 (0.29, 1.89) |
| Q3 | 0.86 (0.41, 1.78) | 0.83 (0.40, 1.73) | 0.93 (0.42, 2.03) | 1.08 (0.47, 2.51) |
| Q4 | 1.21 (0.61, 2.40) | 0.83 (0.41, 1.69) | 0.77 (0.36, 1.66) | 0.86 (0.36, 2.05) |
| Log (IL-6) | ||||
| Q1 | 1.00 | 1.00 | 1.00 | 1.00 |
| Q2 | 3.49 (1.34, 9.10) | 1.90 (0.67, 5.38) | 2.37 (0.76, 7.39) | 2.26 (0.65, 7.88) |
| Q3 | 3.34 (1.59, 7.02) | 3.00 (1.41, 6.38) | 3.40 (1.47, 7.82) | 4.91 (2.00, 12.03) |
| Q4 | 2.94 (1.51, 5.71) | 1.77 (0.84, 3.73) | 2.39 (1.00, 5.72) | 3.15 (1.23, 8.08) |
| Log (IL-10) | ||||
| Q1 | 1.00 | 1.00 | 1.00 | 1.00 |
| Q2 | 1.48 (0.63, 3.47) | 1.43 (0.59, 3.49) | 1.13 (0.45, 2.86) | 1.12 (0.41, 3.03) |
| Q3 | 1.32 (0.56, 3.09) | 0.84 (0.34, 2.07) | 0.69 (0.26, 1.84) | 0.70 (0.26, 1.94) |
| Q4 | 2.84 (1.30, 6.17) | 1.59 (0.66, 3.83) | 1.89 (0.71, 5.01) | 1.83 (0.65, 5.10) |
| TNF | ||||
| Q1 | 1.00 | 1.00 | 1.00 | 1.00 |
| Q2 | 1.17 (0.55, 2.51) | 1.42 (0.65, 3.10) | 1.72 (0.68, 4.36) | 1.96 (0.71, 5.42) |
| Q3 | 1.87 (0.93, 3.79) | 1.48 (0.71, 3.06) | 2.09 (0.94, 4.66) | 2.74 (1.11, 6.76) |
| Q4 | 0.57 (0.23, 1.40) | 0.44 (0.18, 1.12) | 0.34 (0.11, 1.06) | 0.43 (0.13, 1.39) |
| IFN | ||||
| Q1 | 1.00 | 1.00 | 1.00 | 1.00 |
| Q2 | 1.03 (0.47, 2.28) | 0.92 (0.41, 2.07) | 1.17 (0.50, 2.76) | 1.49 (0.61, 3.66) |
| Q3 | 1.28 (0.60, 2.75) | 1.05 (0.49, 2.28) | 0.91 (0.39, 2.13) | 1.19 (0.46, 3.09) |
| Q4 | 1.02 (0.47, 2.24) | 0.96 (0.43, 2.14) | 0.86 (0.35, 2.12) | 0.88 (0.33, 2.34) |
Tab.5 (Continued)
| Variable | Crude model | Model l | Model 2 | Model 3 |
|---|---|---|---|---|
| Q2 | 1.29 (0.39, 4.23) | 1.24 (0.36, 4.26) | 0.97 (0.25, 3.72) | 0.74 (0.17, 3.17) |
| Q3 | 2.07 (0.71, 6.06) | 1.27 (0.41, 3.94) | 0.97 (0.28, 3.35) | 0.86 (0.23, 3.19) |
| Q4 | 5.2 (1.96, 13.8) | 2.66 (0.87, 8.11) | 1.90 (0.55, 6.55) | 1.58 (0.43, 5.82) |
| TNF | ||||
| Q1 | 1.00 | 1.00 | 1.00 | 1.00 |
| Q2 | 1.93 (0.78, 4.79) | 2.62 (1.02, 6.76) | 4.72 (1.44, 15.43) | 6.48 (1.75, 23.98) |
| Q3 | 2.31 (0.94, 5.66) | 1.86 (0.74, 4.69) | 2.48 (0.83, 7.45) | 2.69 (0.80, 9.01) |
| Q4 | 0.83 (0.28, 2.48) | 0.64 (0.21, 1.98) | 0.45 (0.11, 1.84) | 0.45 (0.09, 2.18) |
| IFN | ||||
| Q1 | 1.00 | 1.00 | 1.00 | 1.00 |
| Q2 | 0.92 (0.36, 2.32) | 0.75 (0.29, 1.92) | 1.17 (0.41, 3.30) | 1.28 (0.44, 3.75) |
| Q3 | 1.36 (0.58, 3.18) | 1.07 (0.45, 2.57) | 0.77 (0.28, 2.12) | 0.98 (0.33, 2.85) |
| Q4 | 1.03 (0.43, 2.50) | 0.82 (0.33, 2.03) | 0.48 (0.17, 1.40) | 0.41 (0.13, 1.34) |
| 28-day mortality risk | ||||
| IL-2 | ||||
| Q1 | 1.00 | 1.00 | 1.00 | 1.00 |
| Q2 | 1.27 (0.57, 2.84) | 0.86 (0.38, 1.97) | 0.63 (0.25, 1.60) | 0.59 (0.21, 1.65) |
| Q3 | 1.72 (0.82, 3.61) | 1.33 (0.62, 2.85) | 0.97 (0.41, 2.27) | 0.90 (0.36, 2.25) |
| Q4 | 1.37 (0.65, 2.89) | 0.85 (0.38, 1.88) | 0.60 (0.25, 1.46) | 0.61 (0.23, 1.59) |
| IL-4 | ||||
| Q1 | 1.00 | 1.00 | 1.00 | 1.00 |
| Q2 | 0.71 (0.32, 1.57) | 0.69 (0.31, 1.53) | 0.64 (0.27, 1.53) | 0.74 (0.29, 1.89) |
| Q3 | 0.86 (0.41, 1.78) | 0.83 (0.40, 1.73) | 0.93 (0.42, 2.03) | 1.08 (0.47, 2.51) |
| Q4 | 1.21 (0.61, 2.40) | 0.83 (0.41, 1.69) | 0.77 (0.36, 1.66) | 0.86 (0.36, 2.05) |
| Log (IL-6) | ||||
| Q1 | 1.00 | 1.00 | 1.00 | 1.00 |
| Q2 | 3.49 (1.34, 9.10) | 1.90 (0.67, 5.38) | 2.37 (0.76, 7.39) | 2.26 (0.65, 7.88) |
| Q3 | 3.34 (1.59, 7.02) | 3.00 (1.41, 6.38) | 3.40 (1.47, 7.82) | 4.91 (2.00, 12.03) |
| Q4 | 2.94 (1.51, 5.71) | 1.77 (0.84, 3.73) | 2.39 (1.00, 5.72) | 3.15 (1.23, 8.08) |
| Log (IL-10) | ||||
| Q1 | 1.00 | 1.00 | 1.00 | 1.00 |
| Q2 | 1.48 (0.63, 3.47) | 1.43 (0.59, 3.49) | 1.13 (0.45, 2.86) | 1.12 (0.41, 3.03) |
| Q3 | 1.32 (0.56, 3.09) | 0.84 (0.34, 2.07) | 0.69 (0.26, 1.84) | 0.70 (0.26, 1.94) |
| Q4 | 2.84 (1.30, 6.17) | 1.59 (0.66, 3.83) | 1.89 (0.71, 5.01) | 1.83 (0.65, 5.10) |
| TNF | ||||
| Q1 | 1.00 | 1.00 | 1.00 | 1.00 |
| Q2 | 1.17 (0.55, 2.51) | 1.42 (0.65, 3.10) | 1.72 (0.68, 4.36) | 1.96 (0.71, 5.42) |
| Q3 | 1.87 (0.93, 3.79) | 1.48 (0.71, 3.06) | 2.09 (0.94, 4.66) | 2.74 (1.11, 6.76) |
| Q4 | 0.57 (0.23, 1.40) | 0.44 (0.18, 1.12) | 0.34 (0.11, 1.06) | 0.43 (0.13, 1.39) |
| IFN | ||||
| Q1 | 1.00 | 1.00 | 1.00 | 1.00 |
| Q2 | 1.03 (0.47, 2.28) | 0.92 (0.41, 2.07) | 1.17 (0.50, 2.76) | 1.49 (0.61, 3.66) |
| Q3 | 1.28 (0.60, 2.75) | 1.05 (0.49, 2.28) | 0.91 (0.39, 2.13) | 1.19 (0.46, 3.09) |
| Q4 | 1.02 (0.47, 2.24) | 0.96 (0.43, 2.14) | 0.86 (0.35, 2.12) | 0.88 (0.33, 2.34) |
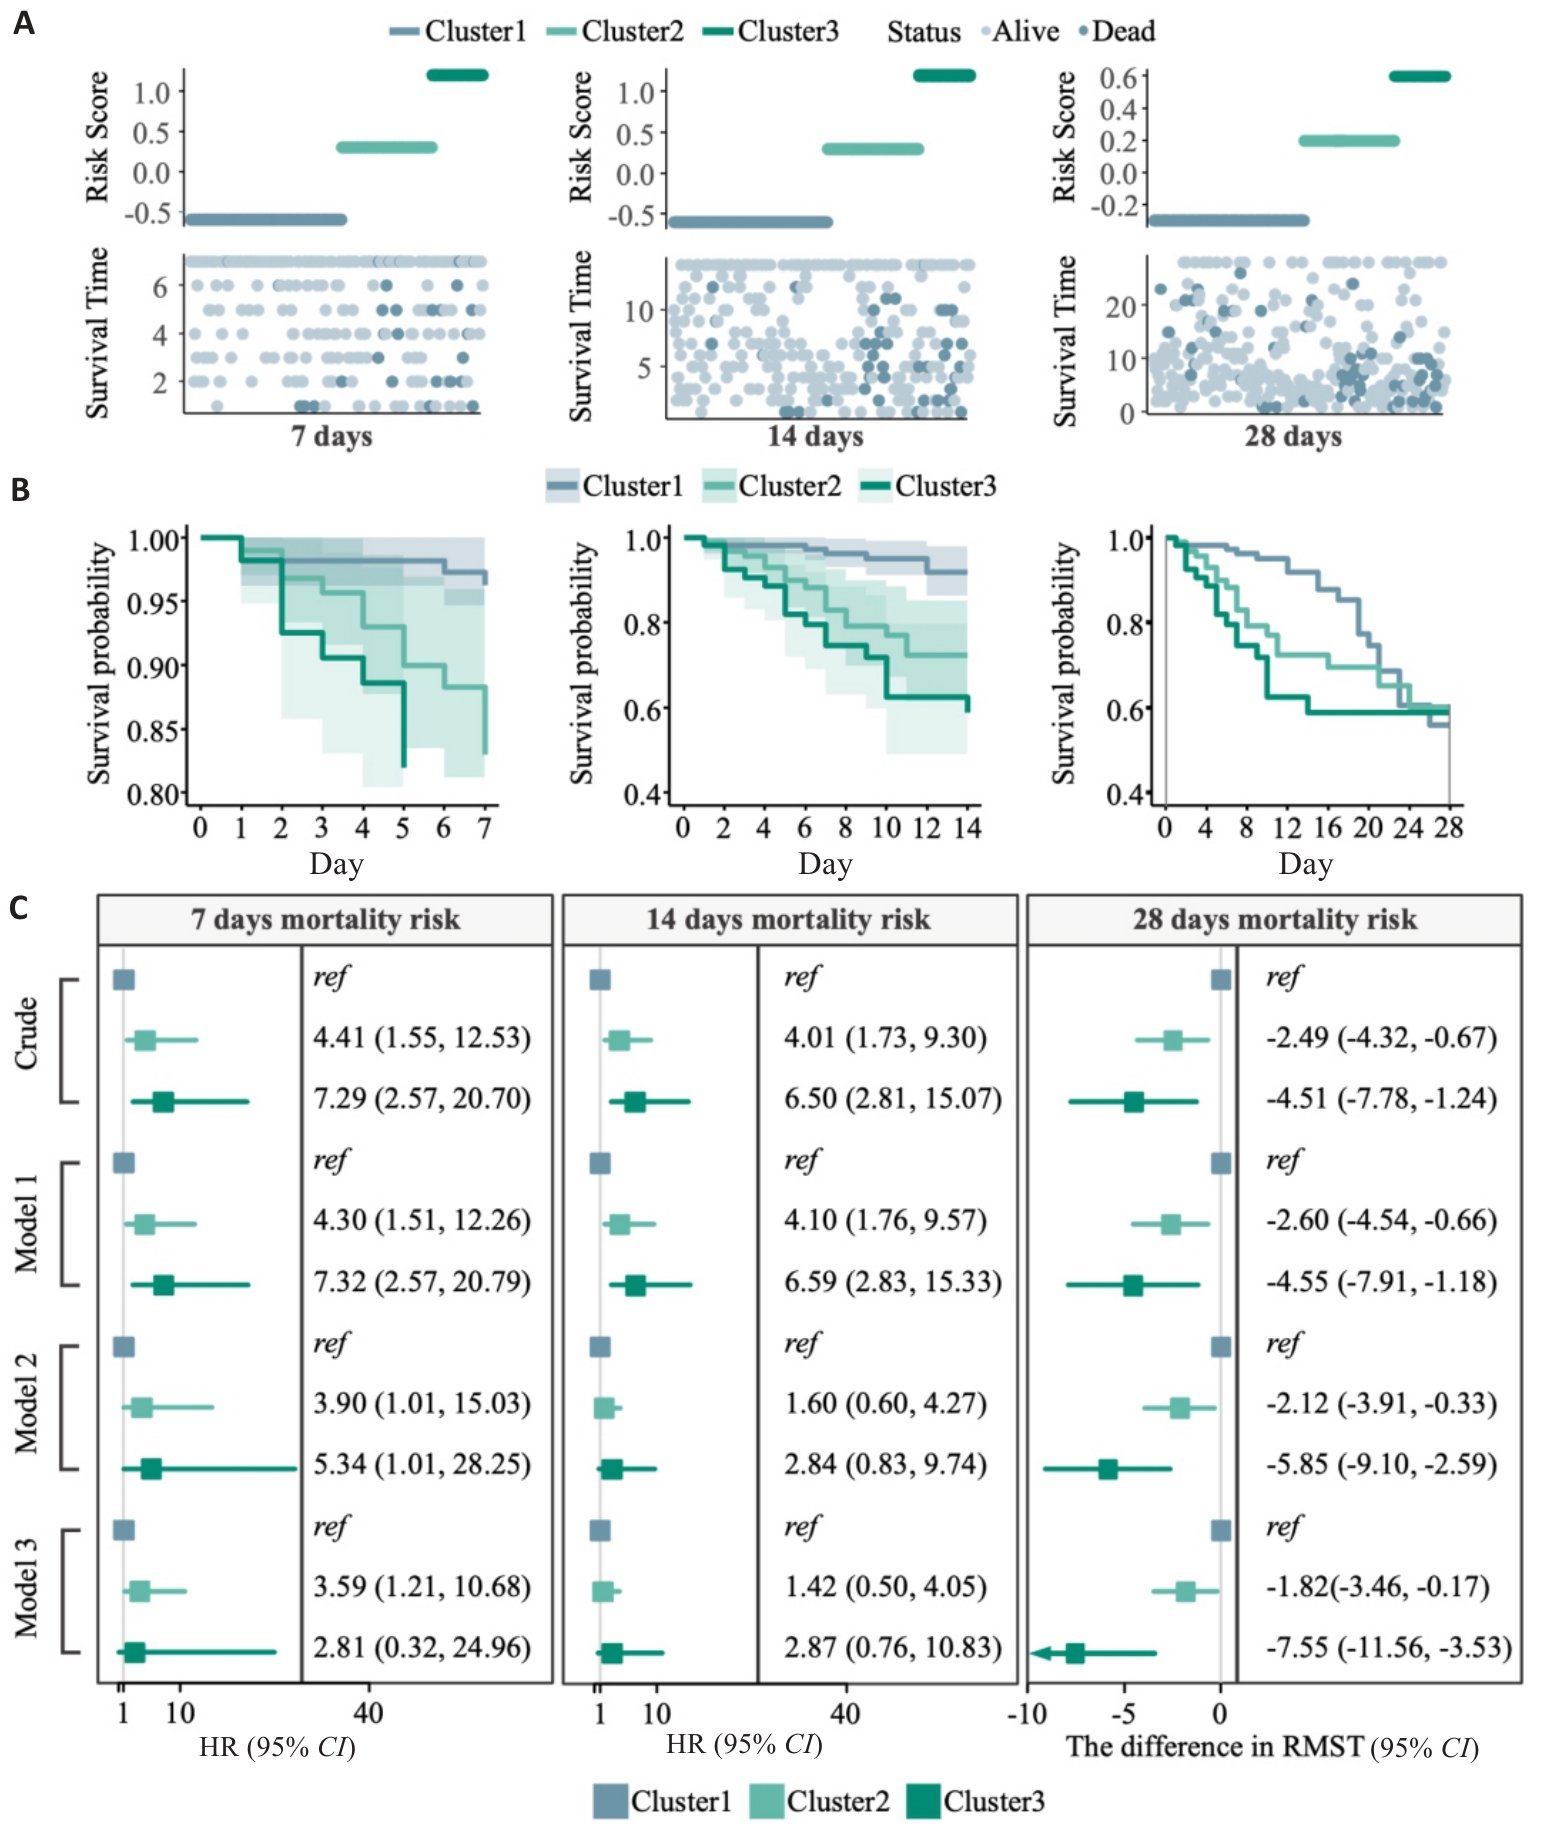
Fig.8 Association of cytokine inflammatory subtypes with ICU mortality risk. A: Risk score plot. B: Kaplan-Meier analysis of different cytokine inflammatory subtypes on days 7, 14, and 28 in septic patients in the ICU. C: Forest plots of 7-day, 14-day, and 28-day mortality risk for the 3 inflammatory subtypes. The difference in RMST (95% CI) was calculated using the difference in restricted mean survival time between the two groups (RMSTcluster2-RMSTcluster1, or RMSTcluster3-RMSTcluster1), implying a decrease in survival in the other clustes relative to Cluster 1.
| [1] | Singer M, Deutschman CS, Seymour CW, et al. The Third International Consensus Definitions for Sepsis and Septic Shock (Sepsis-3)[J]. Jama, 2016, 315(8): 801–10. doi:10.1001/jama.2016.0287 |
| [2] | Markwart R, Saito H, Harder T. Epidemiology and burden of sepsis acquired in hospitals and intensive care units: a systematic review and meta-analysis[J]. Intensive Care Med, 2020, 46(8): 1536–51. doi:10.1007/s00134-020-06106-2 |
| [3] | Adhikari NK, Fowler RA, Bhagwanjee S. Critical care and the global burden of critical illness in adults[J]. Lancet, 2010, 376(9749): 1339–46. doi:10.1016/s0140-6736(10)60446-1 |
| [4] | Rudd KE, Johnson SC, Agesa KM. Global, regional, and national sepsis incidence and mortality, 1990-2017: analysis for the global burden of disease study[J]. Lancet, 2020, 395(10219): 200–11. doi:10.1016/s0140-6736(19)32989-7 |
| [5] | van der Poll T, Shankar-Hari M, Wiersinga WJ. The immunology of sepsis[J]. Immunity, 2021, 54(11): 2450–64. doi:10.1016/j.immuni.2021.10.012 |
| [6] | Xie S, Li J, Lyu F. Novel tripeptide RKH derived from akkermansia muciniphila protects against lethal sepsis[J]. Gut, 2023, 73(1): 78–91. doi:10.1136/gutjnl-2023-329996 |
| [7] | Fang WF, Douglas IS, Chen YM. Development and validation of immune dysfunction score to predict 28-day mortality of sepsis patients[J]. PLoS One, 2017, 12(10): e0187088. doi:10.1371/journal.pone.0187088 |
| [8] | Shi C, Wang X, Wang L. A nanotrap improves survival in severe sepsis by attenuating hyperinflammation[J]. Nat Commun, 2020, 11(1): 3384. doi:10.1038/s41467-020-17153-0 |
| [9] | Tanak AS, Muthukumar S, Krishnan S. Multiplexed cytokine detection using electrochemical point-of-care sensing device towards rapid sepsis endotyping[J]. Biosens Bioelectron, 2021, 171: 112726. doi:10.1016/j.bios.2020.112726 |
| [10] | Liu D, Huang SY, Sun JH. Sepsis-induced immunosuppression: mechanisms, diagnosis and current treatment options[J]. Mil Med Res, 2022, 9(1): 56. doi:10.1186/s40779-022-00422-y |
| [11] | van der Poll T, van de Veerdonk FL, Scicluna BP. The immunopathology of sepsis and potential therapeutic targets[J]. Nat Rev Immunol, 2017, 17(7): 407–20. doi:10.1038/nri.2017.36 |
| [12] | Dickson RP, Singer BH, Newstead MW. Enrichment of the lung microbiome with gut bacteria in sepsis and the acute respiratory distress syndrome[J]. Nat Microbiol, 2016, 1(10): 16113. doi:10.1038/nmicrobiol.2016.113 |
| [13] | Kumar S, Ingle H, Prasad DV. Recognition of bacterial infection by innate immune sensors[J]. Crit Rev Microbiol, 2013, 39(3): 229–46. doi:10.3109/1040841x.2012.706249 |
| [14] | Hotchkiss RS, Monneret G, Payen D. Sepsis-induced immunosuppression: from cellular dysfunctions to immunotherapy[J]. Nat Rev Immunol, 2013, 13(12): 862–74. doi:10.1038/nri3552 |
| [15] | Ong DSY, Bonten MJM, Spitoni C. Epidemiology of multiple herpes viremia in previously immunocompetent patients with septic shock[J]. Clin Infect Dis, 2017, 64(9): 1204–10. doi:10.1093/cid/cix120 |
| [16] | Wong HR, Cvijanovich N, Lin R. Identification of pediatric septic shock subclasses based on genome-wide expression profiling[J]. BMC Med, 2009, 7: 34. doi:10.1186/1741-7015-7-34 |
| [17] | Burnham KL, Davenport EE, Radhakrishnan J. Shared and distinct aspects of the sepsis transcriptomic response to fecal peritonitis and pneumonia[J]. Am J Respir Crit Care Med, 2017, 196(3): 328–39. doi:10.1164/rccm.201608-1685oc |
| [18] | Davenport EE, Burnham KL, Radhakrishnan J. Genomic landscape of the individual host response and outcomes in sepsis: a prospective cohort study[J]. Lancet Respir Med, 2016, 4(4): 259–71. doi:10.1016/s2213-2600(16)00046-1 |
| [19] | Wong HR, Hart KW, Lindsell CJ. External corroboration that corticosteroids may be harmful to septic shock endotype a patients[J]. Crit Care Med, 2021, 49(1): e98–101. doi:10.1097/ccm.0000000000004709 |
| [20] | Ankerst M, Breunig MM, Kriegel HP. OPTICS: ordering points to identify the clustering structure[J]. SIGMOD Rec, 1999, 28(2): 49–60. doi:10.1145/304181.304187 |
| [21] | Wilkerson MD, Hayes DN. ConsensusClusterPlus: a class discovery tool with confidence assessments and item tracking[J]. Bioinformatics, 2010, 26(12): 1572–3. doi:10.1093/bioinformatics/btq170 |
| [22] | Sendler M, van den Brandt C, Glaubitz J. NLRP3 inflammasome regulates development of systemic inflammatory response and compensatory anti-inflammatory response syndromes in mice with acute pancreatitis[J]. Gastroenterology, 2020, 158(1): 253–69. doi:10.1053/j.gastro.2019.09.040 |
| [23] | Adib-Conquy M, Cavaillon JM. Compensatory anti-inflammatory response syndrome[J]. Thromb Haemost, 2009, 101(1): 36–47. doi:10.1160/th08-07-0421 |
| [24] | Tschoeke SK, Oberholzer C, LaFace D. Endogenous IL-10 regulates sepsis-induced thymic apoptosis and improves survival in septic IL-10 null mice[J]. Scand J Immunol, 2008, 68(6): 565–71. doi:10.1111/j.1365-3083.2008.02176.x |
| [25] | Saraiva M, O'Garra A. The regulation of IL-10 production by immune cells[J]. Nat Rev Immunol, 2010, 10(3): 170–81. doi:10.1038/nri2711 |
| [26] | van der Poll T, Marchant A, Buurman WA. Endogenous IL-10 protects mice from death during septic peritonitis[J]. J Immunol, 1995, 155(11): 5397–401. doi:10.4049/jimmunol.155.11.5397 |
| [27] | Kox WJ, Volk T, Kox SN. Immunomodulatory therapies in sepsis[J]. Intensive Care Med, 2000, 26(): S124–8. doi:10.1007/s001340051129 |
| [28] | Frencken JF, van Vught LA, Peelen LM. An unbalanced inflammatory cytokine response is not associated with mortality following sepsis: a prospective cohort study[J]. Crit Care Med, 2017, 45(5): e493–9. doi:10.1097/ccm.0000000000002292 |
| [29] | Xu XJ, Tang YM, Liao C. Inflammatory cytokine measurement quickly discriminates gram-negative from gram-positive bacteremia in pediatric hematology/oncology patients with septic shock[J]. Intensive Care Med, 2013, 39(2): 319–26. doi:10.1007/s00134-012-2752-4 |
| [30] | Xu XJ, Luo ZB, Xia T. Comparison of interleukin-6, interleukin-10, procalcitonin and C-reactive protein in identifying high-risk febrile illness in pediatric cancer patients: a prospective observational study[J]. Cytokine, 2019, 116: 1–6. doi:10.1016/j.cyto.2019.01.004 |
| [31] | Groeneveld AB, Tacx AN, Bossink AW. Circulating inflammatory mediators predict shock and mortality in febrile patients with microbial infection[J]. Clin Immunol, 2003, 106(2): 106–15. doi:10.1016/s1521-6616(02)00025-6 |
| [1] | 赵新丽, 王豪杰, 宋银春, 袁帅, 张振, 周星琦, 李姗姗, 李娴, 李锋. ERI3在肝癌中高表达并与患者不良预后相关[J]. 南方医科大学学报, 2026, 46(1): 175-182. |
| [2] | 王莹, 李静, 王伊迪, 华明钰, 胡玮彬, 张晓智. 原发性肝癌患者的临床结局与治疗反应预测模型:基于失巢凋亡和免疫基因[J]. 南方医科大学学报, 2025, 45(9): 1967-1979. |
| [3] | 张瑜, 李海涛, 潘玉卿, 曹杰贤, 翟丽, 张曦. MZB1基因在泛癌中的表达及其与免疫浸润及预后的关系[J]. 南方医科大学学报, 2025, 45(9): 2006-2018. |
| [4] | 薄海美, 曹新营, 邢平川, 王志军. 外泌体来源的miR-1275通过上调淋巴细胞中IL-38的表达抑制脓毒症心肌细胞凋亡[J]. 南方医科大学学报, 2025, 45(8): 1608-1615. |
| [5] | 王子良, 陈孝华, 杨晶晶, 严晨, 张志郅, 黄炳轶, 赵萌, 刘嵩, 葛思堂, 左芦根, 陈德利. 高表达SURF4通过抑制紧密连接蛋白表达促进胃癌细胞的恶性生物学行为[J]. 南方医科大学学报, 2025, 45(8): 1732-1742. |
| [6] | 庞金龙, 赵新丽, 张振, 王豪杰, 周星琦, 杨玉梅, 李姗姗, 常小强, 李锋, 李娴. 皮肤黑色素瘤中MMRN2高表达促进肿瘤细胞的侵袭和迁移并与不良预后相关[J]. 南方医科大学学报, 2025, 45(7): 1479-1489. |
| [7] | 吴璇, 方家敏, 韩玮玮, 陈琳, 孙菁, 金齐力. 高表达PRELID1促进胃癌细胞上皮间质转化并与不良预后相关[J]. 南方医科大学学报, 2025, 45(7): 1535-1542. |
| [8] | 王康, 李海宾, 余靖, 孟源, 张虹丽. ELFN1高表达是结肠癌的预后生物标志物并促进结肠癌细胞的增殖转移[J]. 南方医科大学学报, 2025, 45(7): 1543-1553. |
| [9] | 张毅, 沈昱, 万志强, 陶嵩, 柳亚魁, 王栓虎. CDKN3高表达促进胃癌细胞的迁移和侵袭:基于调控p53/NF-κB信号通路和抑制胃癌细胞凋亡[J]. 南方医科大学学报, 2025, 45(4): 853-861. |
| [10] | 黄晴晴, 张文静, 张小凤, 王炼, 宋雪, 耿志军, 左芦根, 王月月, 李静, 胡建国. 高表达MYO1B促进胃癌细胞增殖、迁移和侵袭并与患者的不良预后有关[J]. 南方医科大学学报, 2025, 45(3): 622-631. |
| [11] | 李华莉, 宋婷, 刘嘉雯, 李永宝, 姜兆静, 窦文, 周凌宏. 预后导向的肺癌调强放疗计划优化新方法[J]. 南方医科大学学报, 2025, 45(3): 643-649. |
| [12] | 宋雪, 陈悦, 张敏, 张诺, 左芦根, 李静, 耿志军, 张小凤, 王月月, 王炼, 胡建国. GPSM2在胃癌组织中高表达并通过促进肿瘤细胞的增殖影响患者预后[J]. 南方医科大学学报, 2025, 45(2): 229-238. |
| [13] | 唐天威, 李路安, 陈源汉, 张丽, 徐丽霞, 李志莲, 冯仲林, 张辉林, 华瑞芳, 叶智明, 梁馨苓, 李锐钊. 高血清胱抑素C水平是IgA肾病不良预后的独立危险因素[J]. 南方医科大学学报, 2025, 45(2): 379-386. |
| [14] | 周仁杰, 杨晶晶, 宋博文, 陈孝华, 王炼, 王月月, 左芦根, 朱冰. 高表达PSMD11促进胃癌细胞上皮-间质转化进程并影响患者预后[J]. 南方医科大学学报, 2025, 45(12): 2747-2755. |
| [15] | 宋博文, 周仁杰, 徐盈, 施金冉, 张志郅, 李静, 耿志军, 宋雪, 王炼, 王月月, 左芦根. TMCO1在胃癌中高表达与患者不良预后相关并通过抑制调亡促进肿瘤恶性进展[J]. 南方医科大学学报, 2025, 45(11): 2385-2393. |
| 阅读次数 | ||||||
|
全文 |
|
|||||
|
摘要 |
|
|||||