Journal of Southern Medical University ›› 2025, Vol. 45 ›› Issue (12): 2767-2776.doi: 10.12122/j.issn.1673-4254.2025.12.24
Shiyi GAO1( ), Zichen HAN2,4(), Qiang ZENG1, Zengwei CHENG3, Jun WANG1, Pinfang KANG1, Hongju WANG1, Miaonan LI1(), Sigan HU1()
Received:2025-06-22
Online:2025-12-20
Published:2025-12-22
Contact:
Miaonan LI, Sigan HU
E-mail:1933799781@qq.com;291979024@qq.com;13855265385@163.com;siganhu@126.com
Shiyi GAO, Zichen HAN, Qiang ZENG, Zengwei CHENG, Jun WANG, Pinfang KANG, Hongju WANG, Miaonan LI, Sigan HU. Evaluation of coronary microvascular dysfunction for assessing prognosis of ST-segment elevation acute myocardial infarction following reperfusion therapy: insights from QFR-AMR[J]. Journal of Southern Medical University, 2025, 45(12): 2767-2776.
Add to citation manager EndNote|Ris|BibTeX
URL: https://www.j-smu.com/EN/10.12122/j.issn.1673-4254.2025.12.24
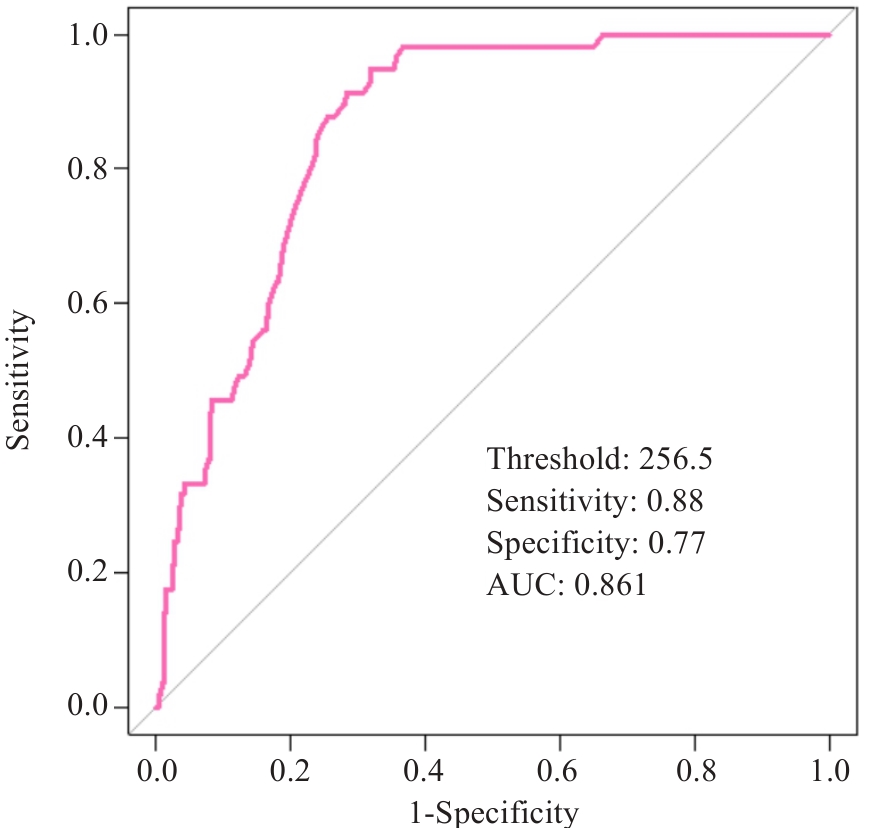
Fig.1 ROC curve analysis of angio-based microvascular resistance (AMR) in patients with ST-segment elevation myocardial infarction (STEMI) after percutaneous coronary intervention (PCI). The curve illustrates the diagnostic efficacy of AMR for identifying major adverse cardiovascular and cerebrovascular events at the optimal cutoff value of 256.5 mmHg·s·m (sensitivity: 88%; specificity: 77%; AUC: 0.861).
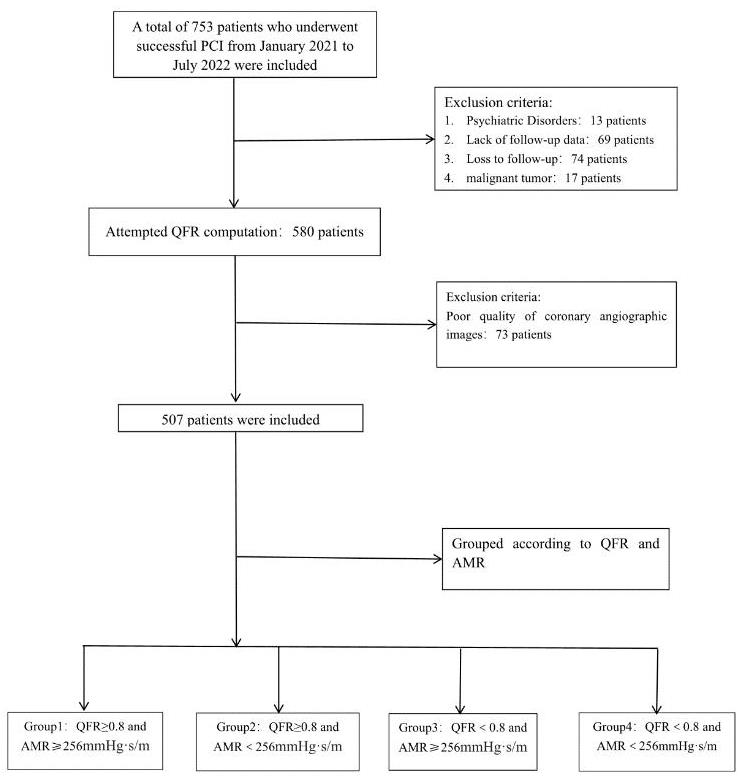
Fig.2 Patient screening flowchart. A total of 753 patients who underwent PCI were screened during the period from January 1, 2021, to July 1, 2022, and 507 patients included for further analysis. According to the QFR and AMR, the patients were categorized into 4 groups.
| Characteristics | QFR≥0.8 | P | QFR<0.8 | P | ||
|---|---|---|---|---|---|---|
| AMR≥256.5 mmHg·s/m (n=140, group 1) | AMR<256.5 mmHg·s/m (n=271, group 2) | AMR≥256.5 mmHg·s/m (n=19, group 3) | AMR<256.5 mmHg·s/m (n=77, group 4) | |||
| Study population | ||||||
| Age (year) | 69 (60, 77) | 60 (53, 72) | <0.001 | 69 (56, 76.00) | 67.00 (57, 78) | 0.873 |
| Male [n (%)] | 118 (84.3) | 201 (74.2) | 0.024 | 18 (94.7) | 53 (68.8) | 0.021 |
| Cardiovascular risk factors | ||||||
| Hypertension [n (%)] | 93 (66.4) | 160 (59.1) | 0.165 | 17 (89.5) | 54 (70.1) | 0.142 |
| Diabetes [n (%)] | 77 (55.0) | 95 (35.1) | <0.001 | 10 (52.6) | 24 (31.1) | 0.036 |
| Hyperlipemia [n (%)] | 98 (70.0) | 140 (51.7) | <0.001 | 18 (94.7) | 40 (51.9) | <0.001 |
| Stroke [n (%)] | 29 (20.7) | 45 (16.6) | 0.343 | 2 (10.5) | 12 (15.6) | 0.729 |
| Smoking [n (%)] | 103 (73.6) | 160 (59.0) | 0.005 | 12 (63.1) | 47 (61.0) | 0.875 |
| Previous CHD [n (%)] | 16 (11.4) | 46 (16.9) | 0.148 | 2 (10.5) | 11 (14.3) | 0.397 |
| Previous PCI [n (%)] | 10 (7.1) | 16 (5.9) | 0.671 | 0 (0) | 2 (2.6) | 0.682 |
| Pain-to-balloon time (min) | 246 (140.8, 362.5) | 219 (129.5, 387.0) | 0.110 | 489 (247.0, 690.0) | 454.0 (254.0, 900.0) | 0.457 |
| Laboratory index | ||||||
| cTnI (ng/L) | 1.1 (0.1, 8.7) | 0.6 (0.1, 7.6) | 0.443 | 12.6 (1.3, 36.6) | 9.4 (1.2, 27.9) | 0.608 |
| NT‐proBNP (pg/mL) | 241.0 (97.2, 1019.2) | 220.1 (70.7, 731.5) | 0.724 | 852.0 (407.1, 1600.0) | 356.0 (158.0, 1877.0) | 0.300 |
| Creatinine (μmol/L) | 69.0 (56.0, 82.0) | 66.0 (55.0, 79.0) | 0.232 | 69.0 (59.5, 85.0) | 69.0 (58.0, 86.0) | 0.835 |
| CK/CKMB | 7.4 (5.5, 9.6) | 7.3 (5.6, 9.5) | 0.755 | 6.1 (5.0, 8.2) | 8.2 (5.2, 9.9) | 0.124 |
| TC-C (mmol/L) | 4.7 (3.8, 5.4) | 4.7 (3.8, 5.6) | 0.472 | 4.3 (3.6, 4.7) | 4.4 (3.7, 5.2) | 0.561 |
| TG (mmol/L) | 1.6 (1.0, 2.3) | 1.5 (1.0, 2.2) | 0.339 | 1.2 (0.8, 1.8) | 1.2 (0.7, 1.9) | 0.846 |
| HDL-C (mmol/L) | 1.0 (0.9, 1.2) | 1.0 (0.8, 1.2) | 0.472 | 1.0 (0.9, 1.2) | 1.0 (0.8, 1.2) | 0.896 |
| LDL-C (mmol/L) | 2.6 (2.2, 3.3) | 2.7 (2.1, 3.4) | 0.508 | 2.6 (2.3, 3.0) | 2.6 (2.2, 3.1) | 0.935 |
| Inflammatory index | ||||||
| Neutrophil (109/L) | 6.2 (4.8, 7.2) | 6.0 (4.6, 7.4) | 0.728 | 6.3 (5.8, 8.3) | 7.1 (5.4, 9.2) | 0.306 |
| Monocyte (109/L) | 0.5 (0.3, 0.6) | 0.4 (0.3, 0.6) | 0.263 | 0.5 (0.4, 0.8) | 0.5 (0.4, 0.7) | 0.919 |
| Platelet (109/L) | 223.0 (187.2, 255.2) | 201.0 (164.0, 235.0) | 0.005 | 252.0 (240.5, 265.5) | 204.0 (155.0, 227.0) | 0.001 |
| Lymphocyte (109/L) | 1.6 (1.2, 2.0) | 1.9 (1.5, 2.4) | <0.001 | 1.4 (1.2, 2.3) | 2.4 (1.9, 2.6) | 0.051 |
| SII | 781.9 (651.9, 942.6) | 632.2 (466.0, 769.8) | <0.001 | 968.0 (773.6, 1466.5) | 591.3 (422.6, 812.3) | 0.002 |
| SIRI | 1.7 (1.1, 2.8) | 1.49 (0.9, 2.1) | 0.061 | 1.87 (1.1, 3.8) | 1.57 (1.0, 2.8) | 0.609 |
| PLR | 3.6 (2.9, 4.0) | 3.2 (2.3, 4.0) | 0.005 | 3.9 (2.9, 5.6) | 3.0 (2.2, 4.0) | 0.124 |
| NLR | 130.3 (105.4, 165.1) | 100.8 (74.9, 125.8) | <0.001 | 152.3 (99.1, 224.3) | 83.0 (64.4, 100.7) | <0.001 |
| Discharge medications | ||||||
| Aspirin [n (%)] | 134 (95.7) | 265 (97.7) | 0.306 | 14 (73.6) | 63 (96.9) | 0.468 |
| Ticagrelor [n (%)] | 80 (57.1) | 174 (64.2) | 0.381 | 11 (57.8) | 55 (84.6) | 0.286 |
| Clopidogrel [n (%)] | 52 (37.1) | 95 (35.0) | 0.511 | 3 (15.7) | 10 (15.3) | 0.702 |
| Statins [n (%)] | 133 (95.0) | 266 (98.1) | 1.000 | 14 (73.6) | 62 (95.3) | 0.572 |
| ACEI/ARB [n (%)] | 65 (46.4) | 139 (51.2) | 0.597 | 4 (21.0) | 20 (30.7) | 0.511 |
| Beta‐blocker [n (%)] | 107 (76.4) | 219 (80.8) | 0.788 | 10 (52.6) | 44 (67.6) | 0.488 |
| ARNi [n (%)] | 24 (17.1) | 57 (21.0) | 0.135 | 5 (26.3) | 24 (36.9) | 0.304 |
| SGLT2i [n (%)] | 1 (0.7) | 13 (4.8) | 0.041 | 1 (5.2) | 10 (15.3) | 0.392 |
| Spirolactone [n (%)] | 64 (45.7) | 102 (37.6) | 0.068 | 6 (31.5) | 22 (33.8) | 0.180 |
| Furosemide [n (%)] | 57 (40.7) | 92 (33.9) | 0.125 | 6 (31.5) | 19 (29.2) | 0.259 |
Tab.1 Baseline characteristics of the patients included
| Characteristics | QFR≥0.8 | P | QFR<0.8 | P | ||
|---|---|---|---|---|---|---|
| AMR≥256.5 mmHg·s/m (n=140, group 1) | AMR<256.5 mmHg·s/m (n=271, group 2) | AMR≥256.5 mmHg·s/m (n=19, group 3) | AMR<256.5 mmHg·s/m (n=77, group 4) | |||
| Study population | ||||||
| Age (year) | 69 (60, 77) | 60 (53, 72) | <0.001 | 69 (56, 76.00) | 67.00 (57, 78) | 0.873 |
| Male [n (%)] | 118 (84.3) | 201 (74.2) | 0.024 | 18 (94.7) | 53 (68.8) | 0.021 |
| Cardiovascular risk factors | ||||||
| Hypertension [n (%)] | 93 (66.4) | 160 (59.1) | 0.165 | 17 (89.5) | 54 (70.1) | 0.142 |
| Diabetes [n (%)] | 77 (55.0) | 95 (35.1) | <0.001 | 10 (52.6) | 24 (31.1) | 0.036 |
| Hyperlipemia [n (%)] | 98 (70.0) | 140 (51.7) | <0.001 | 18 (94.7) | 40 (51.9) | <0.001 |
| Stroke [n (%)] | 29 (20.7) | 45 (16.6) | 0.343 | 2 (10.5) | 12 (15.6) | 0.729 |
| Smoking [n (%)] | 103 (73.6) | 160 (59.0) | 0.005 | 12 (63.1) | 47 (61.0) | 0.875 |
| Previous CHD [n (%)] | 16 (11.4) | 46 (16.9) | 0.148 | 2 (10.5) | 11 (14.3) | 0.397 |
| Previous PCI [n (%)] | 10 (7.1) | 16 (5.9) | 0.671 | 0 (0) | 2 (2.6) | 0.682 |
| Pain-to-balloon time (min) | 246 (140.8, 362.5) | 219 (129.5, 387.0) | 0.110 | 489 (247.0, 690.0) | 454.0 (254.0, 900.0) | 0.457 |
| Laboratory index | ||||||
| cTnI (ng/L) | 1.1 (0.1, 8.7) | 0.6 (0.1, 7.6) | 0.443 | 12.6 (1.3, 36.6) | 9.4 (1.2, 27.9) | 0.608 |
| NT‐proBNP (pg/mL) | 241.0 (97.2, 1019.2) | 220.1 (70.7, 731.5) | 0.724 | 852.0 (407.1, 1600.0) | 356.0 (158.0, 1877.0) | 0.300 |
| Creatinine (μmol/L) | 69.0 (56.0, 82.0) | 66.0 (55.0, 79.0) | 0.232 | 69.0 (59.5, 85.0) | 69.0 (58.0, 86.0) | 0.835 |
| CK/CKMB | 7.4 (5.5, 9.6) | 7.3 (5.6, 9.5) | 0.755 | 6.1 (5.0, 8.2) | 8.2 (5.2, 9.9) | 0.124 |
| TC-C (mmol/L) | 4.7 (3.8, 5.4) | 4.7 (3.8, 5.6) | 0.472 | 4.3 (3.6, 4.7) | 4.4 (3.7, 5.2) | 0.561 |
| TG (mmol/L) | 1.6 (1.0, 2.3) | 1.5 (1.0, 2.2) | 0.339 | 1.2 (0.8, 1.8) | 1.2 (0.7, 1.9) | 0.846 |
| HDL-C (mmol/L) | 1.0 (0.9, 1.2) | 1.0 (0.8, 1.2) | 0.472 | 1.0 (0.9, 1.2) | 1.0 (0.8, 1.2) | 0.896 |
| LDL-C (mmol/L) | 2.6 (2.2, 3.3) | 2.7 (2.1, 3.4) | 0.508 | 2.6 (2.3, 3.0) | 2.6 (2.2, 3.1) | 0.935 |
| Inflammatory index | ||||||
| Neutrophil (109/L) | 6.2 (4.8, 7.2) | 6.0 (4.6, 7.4) | 0.728 | 6.3 (5.8, 8.3) | 7.1 (5.4, 9.2) | 0.306 |
| Monocyte (109/L) | 0.5 (0.3, 0.6) | 0.4 (0.3, 0.6) | 0.263 | 0.5 (0.4, 0.8) | 0.5 (0.4, 0.7) | 0.919 |
| Platelet (109/L) | 223.0 (187.2, 255.2) | 201.0 (164.0, 235.0) | 0.005 | 252.0 (240.5, 265.5) | 204.0 (155.0, 227.0) | 0.001 |
| Lymphocyte (109/L) | 1.6 (1.2, 2.0) | 1.9 (1.5, 2.4) | <0.001 | 1.4 (1.2, 2.3) | 2.4 (1.9, 2.6) | 0.051 |
| SII | 781.9 (651.9, 942.6) | 632.2 (466.0, 769.8) | <0.001 | 968.0 (773.6, 1466.5) | 591.3 (422.6, 812.3) | 0.002 |
| SIRI | 1.7 (1.1, 2.8) | 1.49 (0.9, 2.1) | 0.061 | 1.87 (1.1, 3.8) | 1.57 (1.0, 2.8) | 0.609 |
| PLR | 3.6 (2.9, 4.0) | 3.2 (2.3, 4.0) | 0.005 | 3.9 (2.9, 5.6) | 3.0 (2.2, 4.0) | 0.124 |
| NLR | 130.3 (105.4, 165.1) | 100.8 (74.9, 125.8) | <0.001 | 152.3 (99.1, 224.3) | 83.0 (64.4, 100.7) | <0.001 |
| Discharge medications | ||||||
| Aspirin [n (%)] | 134 (95.7) | 265 (97.7) | 0.306 | 14 (73.6) | 63 (96.9) | 0.468 |
| Ticagrelor [n (%)] | 80 (57.1) | 174 (64.2) | 0.381 | 11 (57.8) | 55 (84.6) | 0.286 |
| Clopidogrel [n (%)] | 52 (37.1) | 95 (35.0) | 0.511 | 3 (15.7) | 10 (15.3) | 0.702 |
| Statins [n (%)] | 133 (95.0) | 266 (98.1) | 1.000 | 14 (73.6) | 62 (95.3) | 0.572 |
| ACEI/ARB [n (%)] | 65 (46.4) | 139 (51.2) | 0.597 | 4 (21.0) | 20 (30.7) | 0.511 |
| Beta‐blocker [n (%)] | 107 (76.4) | 219 (80.8) | 0.788 | 10 (52.6) | 44 (67.6) | 0.488 |
| ARNi [n (%)] | 24 (17.1) | 57 (21.0) | 0.135 | 5 (26.3) | 24 (36.9) | 0.304 |
| SGLT2i [n (%)] | 1 (0.7) | 13 (4.8) | 0.041 | 1 (5.2) | 10 (15.3) | 0.392 |
| Spirolactone [n (%)] | 64 (45.7) | 102 (37.6) | 0.068 | 6 (31.5) | 22 (33.8) | 0.180 |
| Furosemide [n (%)] | 57 (40.7) | 92 (33.9) | 0.125 | 6 (31.5) | 19 (29.2) | 0.259 |
| Characteristics | QFR≥0.8 | P | QFR<0.8 | P | ||
|---|---|---|---|---|---|---|
| AMR≥256.5 mmHg·s/m (n=140, Group 1) | AMR<256.5 mmHg·s/m (n=271, Group 2) | AMR≥256.5 mmHg·s/m (n=19, Group 3) | AMR<256.5 mmHg·s/m (n=77, Group 4) | |||
| Infarct‐related artery | ||||||
| LAD [n (%)] | 65 (46.4) | 105 (38.7) | 0.408 | 13 (68.4) | 45 (58.4) | 0.744 |
| AMR | 269 (263, 302) | 220 (195, 235) | <0.001 | 297 [269, 329] | 199 (161, 225) | <0.001 |
| LCX [n (%)] | 81 (57.8) | 172 (63.4) | 0.473 | 3 (15.7) | 9 (11.6) | 0.833 |
| AMR | 296 (274, 310) | 227 (211, 242) | <0.001 | 257 [256, 260] | 195 (186, 233) | 0.182 |
| RCA [n (%)] | 59.0 (42.1) | 118.0 (43.5) | 0.987 | 3 (15.7) | 23 (29.8) | 0.679 |
| AMR | 272 (261, 303) | 221.5 (198, 239) | <0.001 | 306 [299, 327] | 194 (180, 215) | 0.220 |
| Multivessel disease | ||||||
| 1 [n (%)] | 65 (46.4) | 65 (23.9) | 0.013 | 7 (36.8) | 14 (18.1) | 0.689 |
| 2 [n (%)] | 24 (17.1) | 114 (42.0) | 0.040 | 7 (36.8) | 38 (49.3) | 0.844 |
| 3 [n (%)] | 51 (36.4) | 92 (33.9) | 0.908 | 5 (26.3) | 25 (32.4) | 0.689 |
| TIMI flow grade (inital) | ||||||
| 0 | 124 (88.5) | 229 (84.5) | 0.374 | 15 (78.9) | 46 (59.7) | 0.338 |
| 1 | 12 (8.5) | 32 (11.8) | 0.898 | 2 (10.5) | 24 (31.1) | 0.784 |
| 2 | 2 (1.4) | 4 (1.4) | 0.933 | 0 (0) | 7 (7.7) | 1.000 |
| 3 | 2 (1.4) | 6 (2.2) | 0.947 | 2 (10.5) | 1 (1.3) | 0.863 |
| TIMI flow grade (post) | 0.776 | 0.645 | ||||
| 0 | 0 | 0 | 0 | 0 | ||
| 1 | 0 | 0 | 0 | 0 | ||
| 2 | 0 | 0 | 0 | 0 | ||
| 3 | 140 (100) | 271 (100) | 19 (100) | 77 (100) | ||
| QFR | 0.94 (0.91, 0.97) | 0.94 (0.89, 0.97) | 0.382 | 0.74 (0.70, 0.77) | 0.74 (0.70, 0.77) | 0.885 |
| AMR (mmHg·s/m) | 274.00 (262.75, 308.00) | 221.00 (197.50, 238.00) | <0.001 | 293.00 (268.00, 327.00) | 195.00 (169.00, 225.00) | <0.001 |
| MACCEs [n (%)] | 26 (18.57) | 4 (1.48) | <0.001 | 14 (73.68) | 16 (20.78) | <0.001 |
| Non-culprit vessel | ||||||
| QFR | 0.90 (0.85, 0.96) | 0.85 (0.83,0.94) | 0.452 | 0.83 (0.81,0.91) | 0.88 (0.82, 0.94) | 0.521 |
| AMR (mmHg·s/m) | 232.00 (204.00, 241.00) | 227.00 (200.00, 239.00) | 0.326 | 239.00 (217.50, 249.00) | 225.00 (214.00, 234.00) | 0.428 |
Tab. 2 Characteristics related to coronary artery vessels in different groups of patients
| Characteristics | QFR≥0.8 | P | QFR<0.8 | P | ||
|---|---|---|---|---|---|---|
| AMR≥256.5 mmHg·s/m (n=140, Group 1) | AMR<256.5 mmHg·s/m (n=271, Group 2) | AMR≥256.5 mmHg·s/m (n=19, Group 3) | AMR<256.5 mmHg·s/m (n=77, Group 4) | |||
| Infarct‐related artery | ||||||
| LAD [n (%)] | 65 (46.4) | 105 (38.7) | 0.408 | 13 (68.4) | 45 (58.4) | 0.744 |
| AMR | 269 (263, 302) | 220 (195, 235) | <0.001 | 297 [269, 329] | 199 (161, 225) | <0.001 |
| LCX [n (%)] | 81 (57.8) | 172 (63.4) | 0.473 | 3 (15.7) | 9 (11.6) | 0.833 |
| AMR | 296 (274, 310) | 227 (211, 242) | <0.001 | 257 [256, 260] | 195 (186, 233) | 0.182 |
| RCA [n (%)] | 59.0 (42.1) | 118.0 (43.5) | 0.987 | 3 (15.7) | 23 (29.8) | 0.679 |
| AMR | 272 (261, 303) | 221.5 (198, 239) | <0.001 | 306 [299, 327] | 194 (180, 215) | 0.220 |
| Multivessel disease | ||||||
| 1 [n (%)] | 65 (46.4) | 65 (23.9) | 0.013 | 7 (36.8) | 14 (18.1) | 0.689 |
| 2 [n (%)] | 24 (17.1) | 114 (42.0) | 0.040 | 7 (36.8) | 38 (49.3) | 0.844 |
| 3 [n (%)] | 51 (36.4) | 92 (33.9) | 0.908 | 5 (26.3) | 25 (32.4) | 0.689 |
| TIMI flow grade (inital) | ||||||
| 0 | 124 (88.5) | 229 (84.5) | 0.374 | 15 (78.9) | 46 (59.7) | 0.338 |
| 1 | 12 (8.5) | 32 (11.8) | 0.898 | 2 (10.5) | 24 (31.1) | 0.784 |
| 2 | 2 (1.4) | 4 (1.4) | 0.933 | 0 (0) | 7 (7.7) | 1.000 |
| 3 | 2 (1.4) | 6 (2.2) | 0.947 | 2 (10.5) | 1 (1.3) | 0.863 |
| TIMI flow grade (post) | 0.776 | 0.645 | ||||
| 0 | 0 | 0 | 0 | 0 | ||
| 1 | 0 | 0 | 0 | 0 | ||
| 2 | 0 | 0 | 0 | 0 | ||
| 3 | 140 (100) | 271 (100) | 19 (100) | 77 (100) | ||
| QFR | 0.94 (0.91, 0.97) | 0.94 (0.89, 0.97) | 0.382 | 0.74 (0.70, 0.77) | 0.74 (0.70, 0.77) | 0.885 |
| AMR (mmHg·s/m) | 274.00 (262.75, 308.00) | 221.00 (197.50, 238.00) | <0.001 | 293.00 (268.00, 327.00) | 195.00 (169.00, 225.00) | <0.001 |
| MACCEs [n (%)] | 26 (18.57) | 4 (1.48) | <0.001 | 14 (73.68) | 16 (20.78) | <0.001 |
| Non-culprit vessel | ||||||
| QFR | 0.90 (0.85, 0.96) | 0.85 (0.83,0.94) | 0.452 | 0.83 (0.81,0.91) | 0.88 (0.82, 0.94) | 0.521 |
| AMR (mmHg·s/m) | 232.00 (204.00, 241.00) | 227.00 (200.00, 239.00) | 0.326 | 239.00 (217.50, 249.00) | 225.00 (214.00, 234.00) | 0.428 |
| Characteristics | Regression coefficient β | Standard error | t | P |
|---|---|---|---|---|
| Diabetes | 16.970 | 5.014 | 3.384 | <0.001 |
| Hyperlipemia | 15.071 | 4.531 | 3.326 | <0.001 |
| Smoking | 11.457 | 4.645 | 2.466 | 0.014 |
| SIRI | 5.677 | 2.081 | 2.728 | 0.007 |
| PLR | 0.261 | 0.064 | 4.072 | <0.001 |
Tab.3 Multivariate linear regression analysis of AMR of the patients
| Characteristics | Regression coefficient β | Standard error | t | P |
|---|---|---|---|---|
| Diabetes | 16.970 | 5.014 | 3.384 | <0.001 |
| Hyperlipemia | 15.071 | 4.531 | 3.326 | <0.001 |
| Smoking | 11.457 | 4.645 | 2.466 | 0.014 |
| SIRI | 5.677 | 2.081 | 2.728 | 0.007 |
| PLR | 0.261 | 0.064 | 4.072 | <0.001 |
| Characteristics | Total | Group1 | Group2 | Group3 | Group4 | P |
|---|---|---|---|---|---|---|
| Primary outcome | 60 (11.83%) | 26 (18.57%) | 4 (1.48%) | 14 (73.68%) | 16 (20.78%) | <0.001 |
| All-cause mortality | 24 (4.73%) | 9 (6.43%) | 2 (0.74%) | 6 (31.57%) | 7 (9.09%) | <0.001 |
| Cardiac failure | 36 (7.10%) | 17 (12.14%) | 2 (0.74%) | 8 (42.11%) | 9 (11.69%) | 0.005 |
| Any myocardial infarction | 7 (1.38%) | 3 (2.14%) | 0 (0.00%) | 2 (10.52%) | 2 (2.59%) | 0.438 |
| IRA myocardial infarction | 4 (0.79%) | 2 (1.43%) | 0 (0.00%) | 1 (5.26%) | 1 (1.29%) | 0.572 |
| Non-IRA myocardial infarction | 3 (0.59%) | 1 (0.71%) | 0 (0.00%) | 1 (5.26%) | 1 (1.29%) | 0.801 |
| Readmission for angina | 18 (3.55%) | 8 (5.71%) | 1 (0.37%) | 3 (15.78%) | 6 (7.79%) | 0.092 |
| Any revascularization | 10 (1.97%) | 4 (2.86%) | 0 (0.00%) | 2 (10.52%) | 4 (5.19%) | 0.221 |
| Stroke | 5 (0.98%) | 3 (2.14%) | 1 (0.37%) | 1 (5.26%) | 0 (0.00%) | 0.284 |
Tab.4 Clinical outcomes across different groups of patients
| Characteristics | Total | Group1 | Group2 | Group3 | Group4 | P |
|---|---|---|---|---|---|---|
| Primary outcome | 60 (11.83%) | 26 (18.57%) | 4 (1.48%) | 14 (73.68%) | 16 (20.78%) | <0.001 |
| All-cause mortality | 24 (4.73%) | 9 (6.43%) | 2 (0.74%) | 6 (31.57%) | 7 (9.09%) | <0.001 |
| Cardiac failure | 36 (7.10%) | 17 (12.14%) | 2 (0.74%) | 8 (42.11%) | 9 (11.69%) | 0.005 |
| Any myocardial infarction | 7 (1.38%) | 3 (2.14%) | 0 (0.00%) | 2 (10.52%) | 2 (2.59%) | 0.438 |
| IRA myocardial infarction | 4 (0.79%) | 2 (1.43%) | 0 (0.00%) | 1 (5.26%) | 1 (1.29%) | 0.572 |
| Non-IRA myocardial infarction | 3 (0.59%) | 1 (0.71%) | 0 (0.00%) | 1 (5.26%) | 1 (1.29%) | 0.801 |
| Readmission for angina | 18 (3.55%) | 8 (5.71%) | 1 (0.37%) | 3 (15.78%) | 6 (7.79%) | 0.092 |
| Any revascularization | 10 (1.97%) | 4 (2.86%) | 0 (0.00%) | 2 (10.52%) | 4 (5.19%) | 0.221 |
| Stroke | 5 (0.98%) | 3 (2.14%) | 1 (0.37%) | 1 (5.26%) | 0 (0.00%) | 0.284 |
| Characteristics | HR (univariable) | P | HR (multivariable) | P |
|---|---|---|---|---|
| Age | 1.033 (1.010-1.056) | 0.045 | 1.043 (1.010-1.078) | 0.069 |
| Hypertension | 3.625 (1.486-6.085) | <0.001 | 3.412 (1.178-6.328) | 0.002 |
| Diabetes | 4.838 (2.645-8.849) | <0.001 | 2.948 (1.326-6.557) | 0.008 |
| Hyperlipemia | 5.408 (2.511-11.648) | 0.032 | 5.434 (2.121-13.923) | 0.079 |
| Smoking | 3.680 (1.767-7.664) | <0.001 | 3.021 (1.187-7.687) | 0.020 |
| Pain-to-balloon time | 1.458 (1.235-3.454) | 0.033 | 1.001 (0.701-1.012) | 0.041 |
| SIRI | 1.582 (1.335-1.874) | 0.065 | 1.665 (1.370-2.023) | 0.082 |
| AMR | 1.247 (1.185-3.583) | <0.001 | 1.145 (1.046-2.638) | <0.001 |
Tab.5 Independent predictors of MACCEs in patients with STEMI
| Characteristics | HR (univariable) | P | HR (multivariable) | P |
|---|---|---|---|---|
| Age | 1.033 (1.010-1.056) | 0.045 | 1.043 (1.010-1.078) | 0.069 |
| Hypertension | 3.625 (1.486-6.085) | <0.001 | 3.412 (1.178-6.328) | 0.002 |
| Diabetes | 4.838 (2.645-8.849) | <0.001 | 2.948 (1.326-6.557) | 0.008 |
| Hyperlipemia | 5.408 (2.511-11.648) | 0.032 | 5.434 (2.121-13.923) | 0.079 |
| Smoking | 3.680 (1.767-7.664) | <0.001 | 3.021 (1.187-7.687) | 0.020 |
| Pain-to-balloon time | 1.458 (1.235-3.454) | 0.033 | 1.001 (0.701-1.012) | 0.041 |
| SIRI | 1.582 (1.335-1.874) | 0.065 | 1.665 (1.370-2.023) | 0.082 |
| AMR | 1.247 (1.185-3.583) | <0.001 | 1.145 (1.046-2.638) | <0.001 |
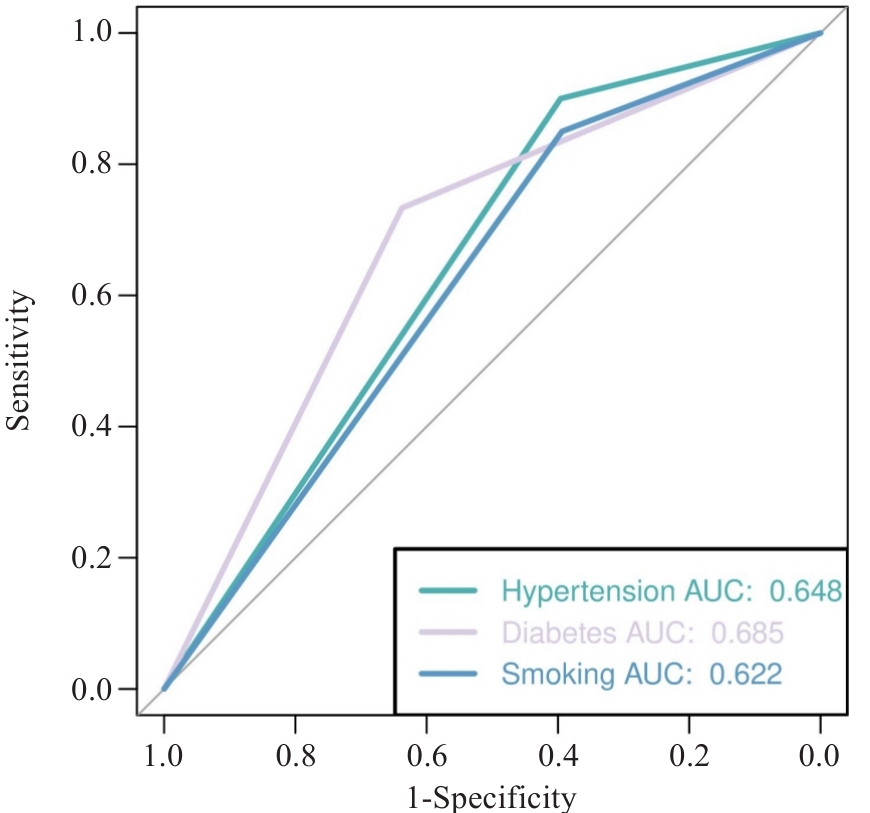
Fig.3 ROC curve analysis for evaluating the performance of the multivariate model for predicting MACCEs.
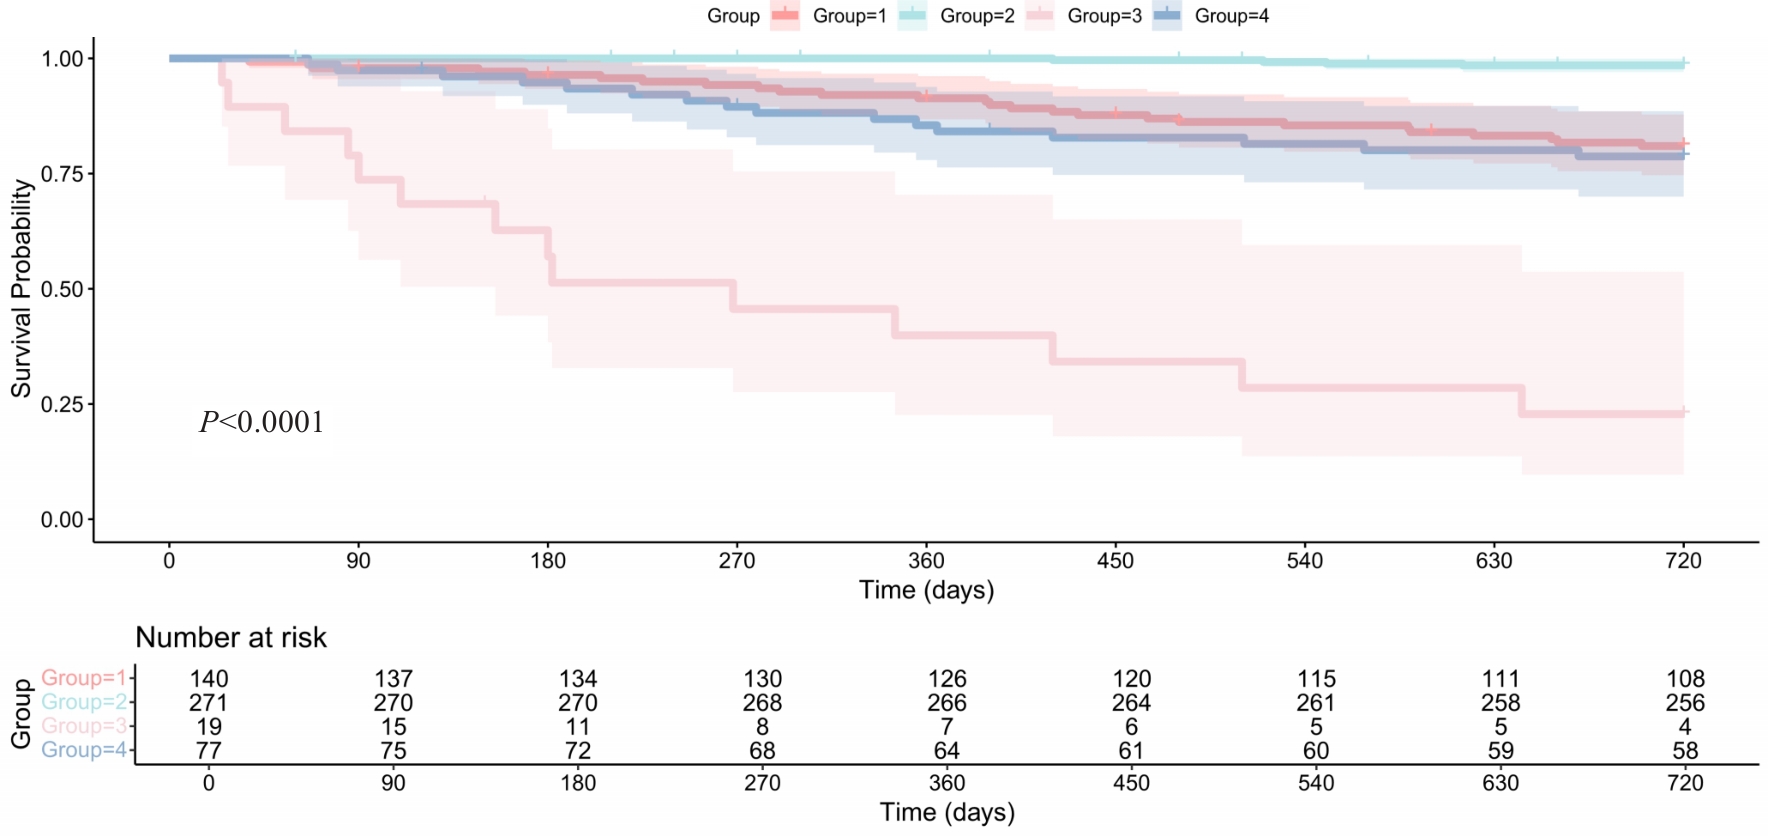
Fig.4 Kaplan-Meier survival curves of the primary outcome in patients with STEMI stratified by QFR-AMR. The survival outcomes vary significantly across the groups (P<0.0001).
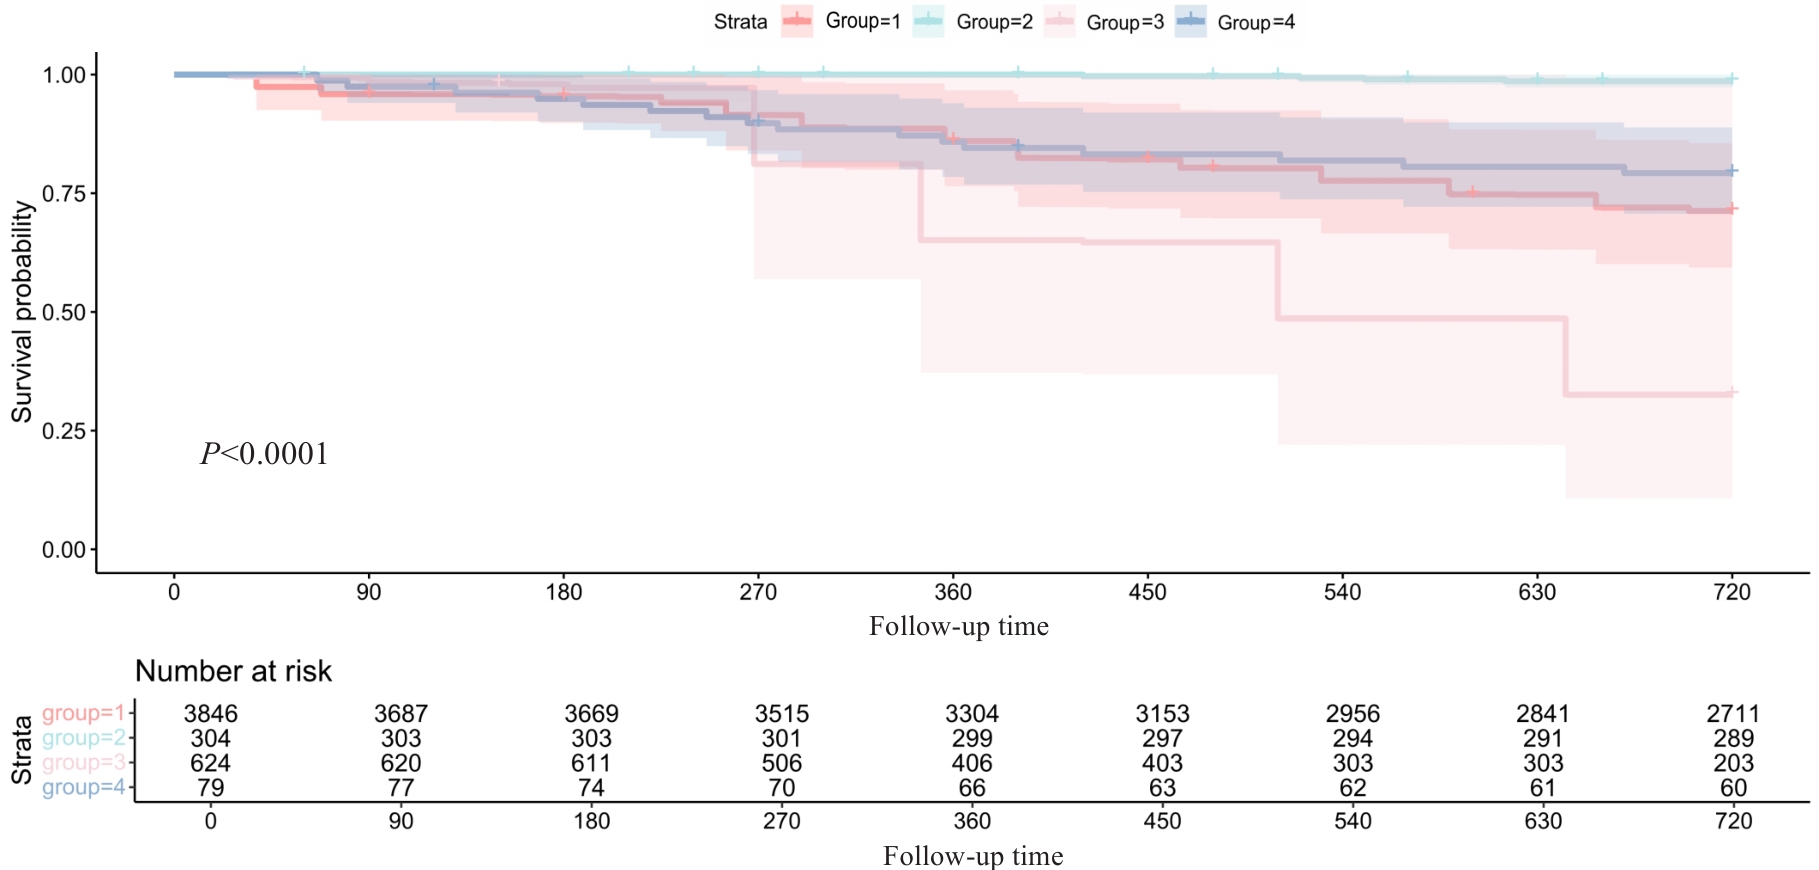
Fig.5 Outcomes of the patients after adjustment with the IPTW method (P<0.0001).
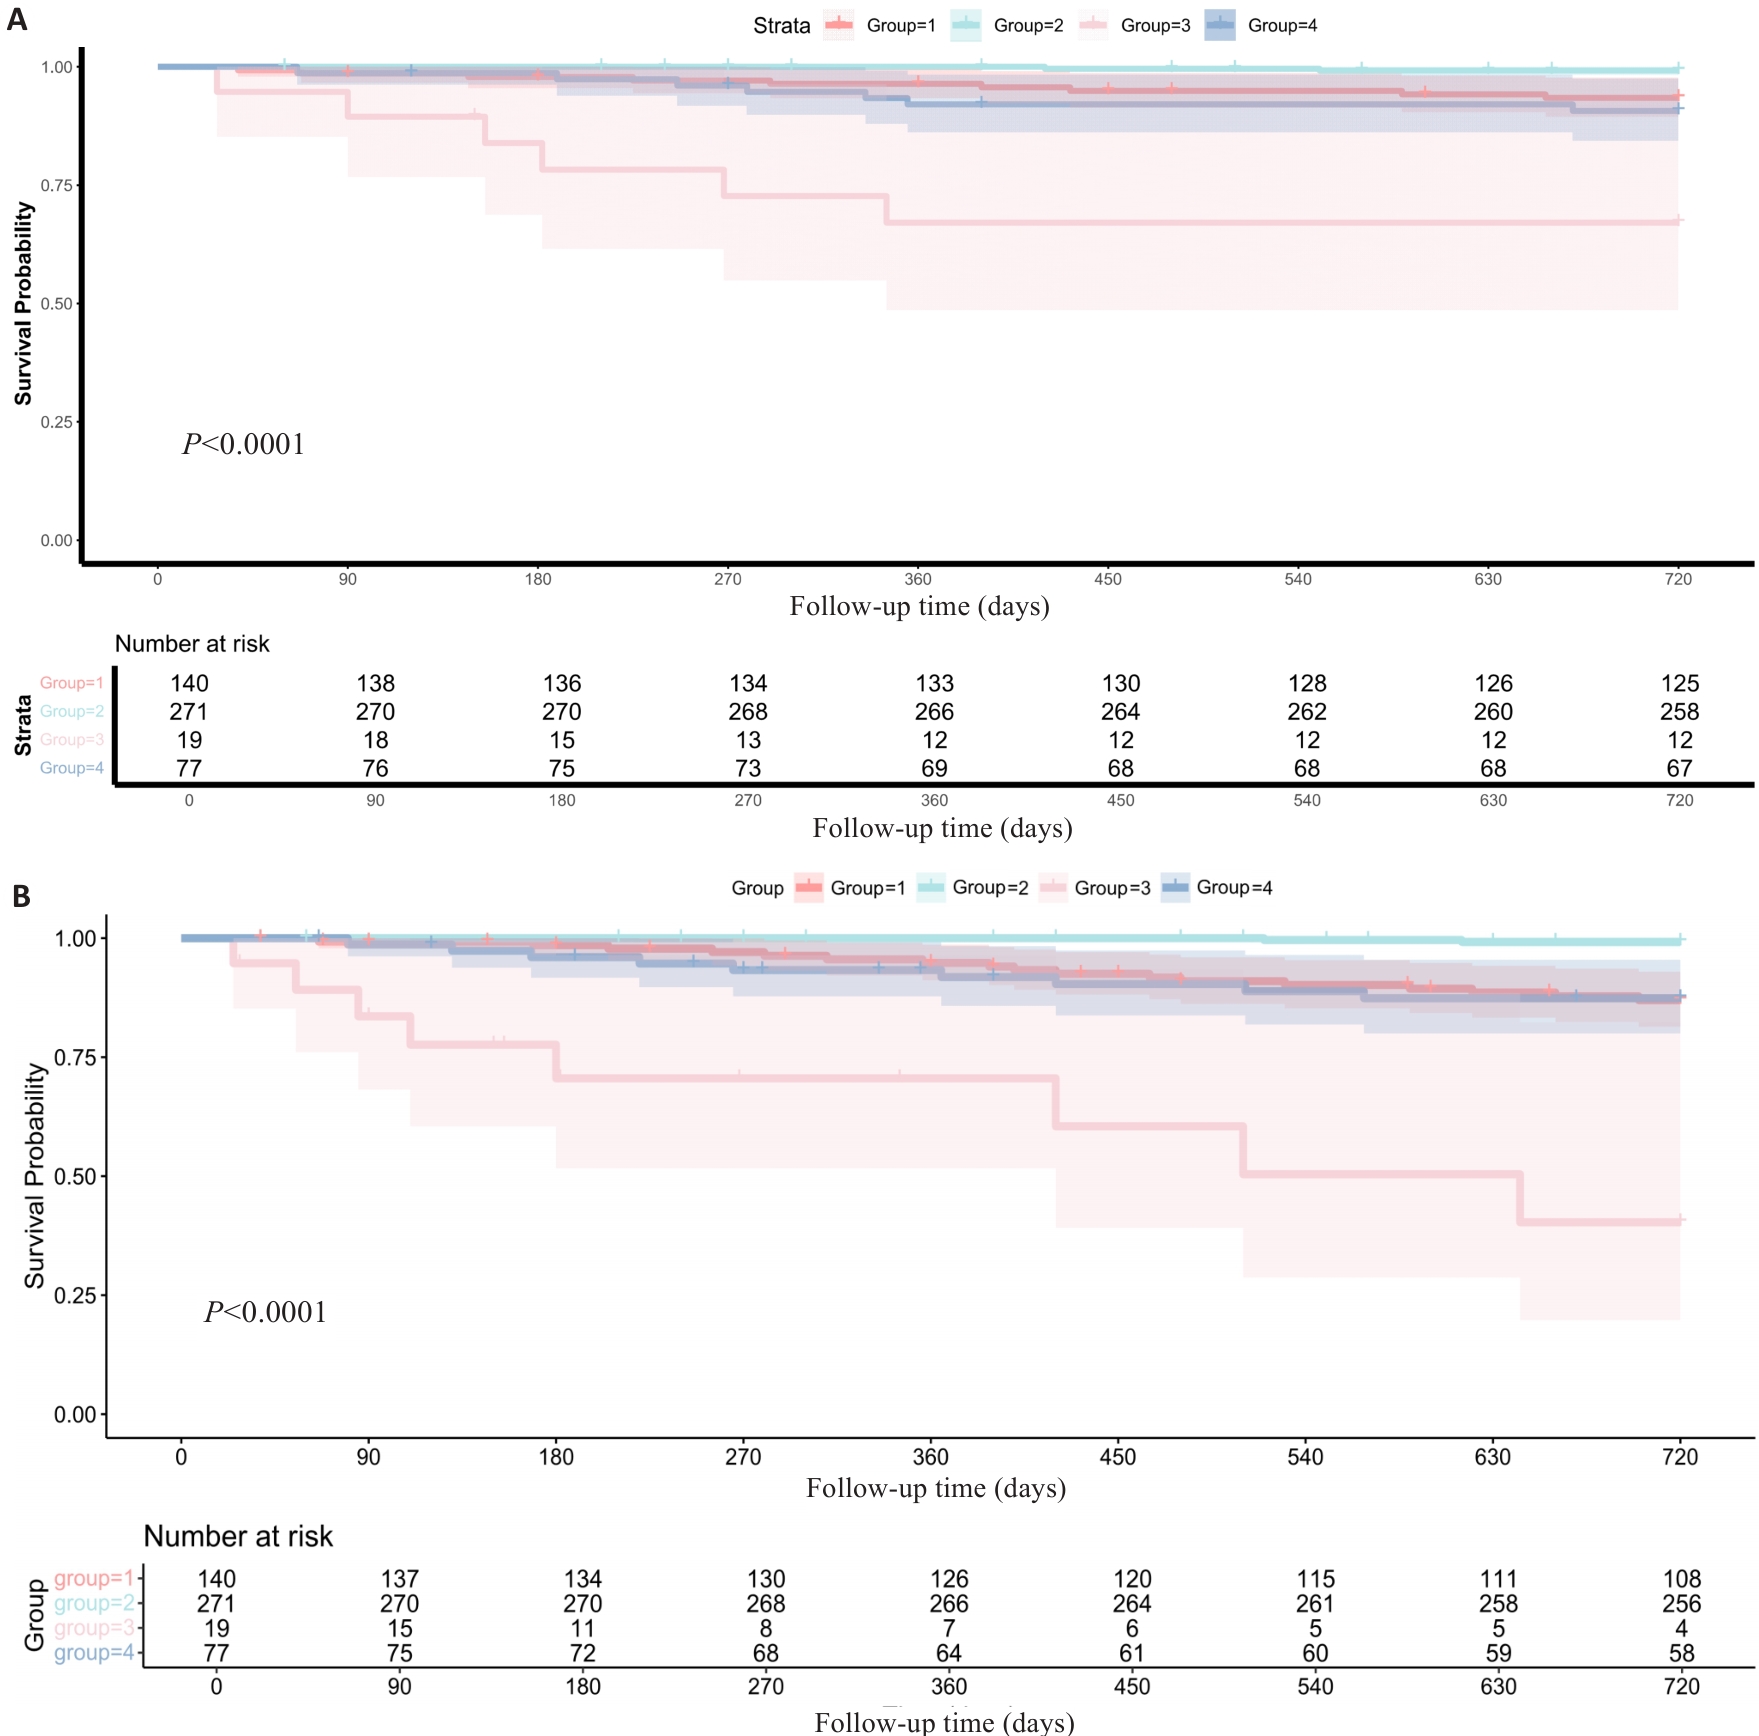
Fig.6 Kaplan-Meier analyses reveal significant differences in all-cause mortality rates (A) and heart failure incidence (B) among the 4 groups stratified based on AMR-QFR.
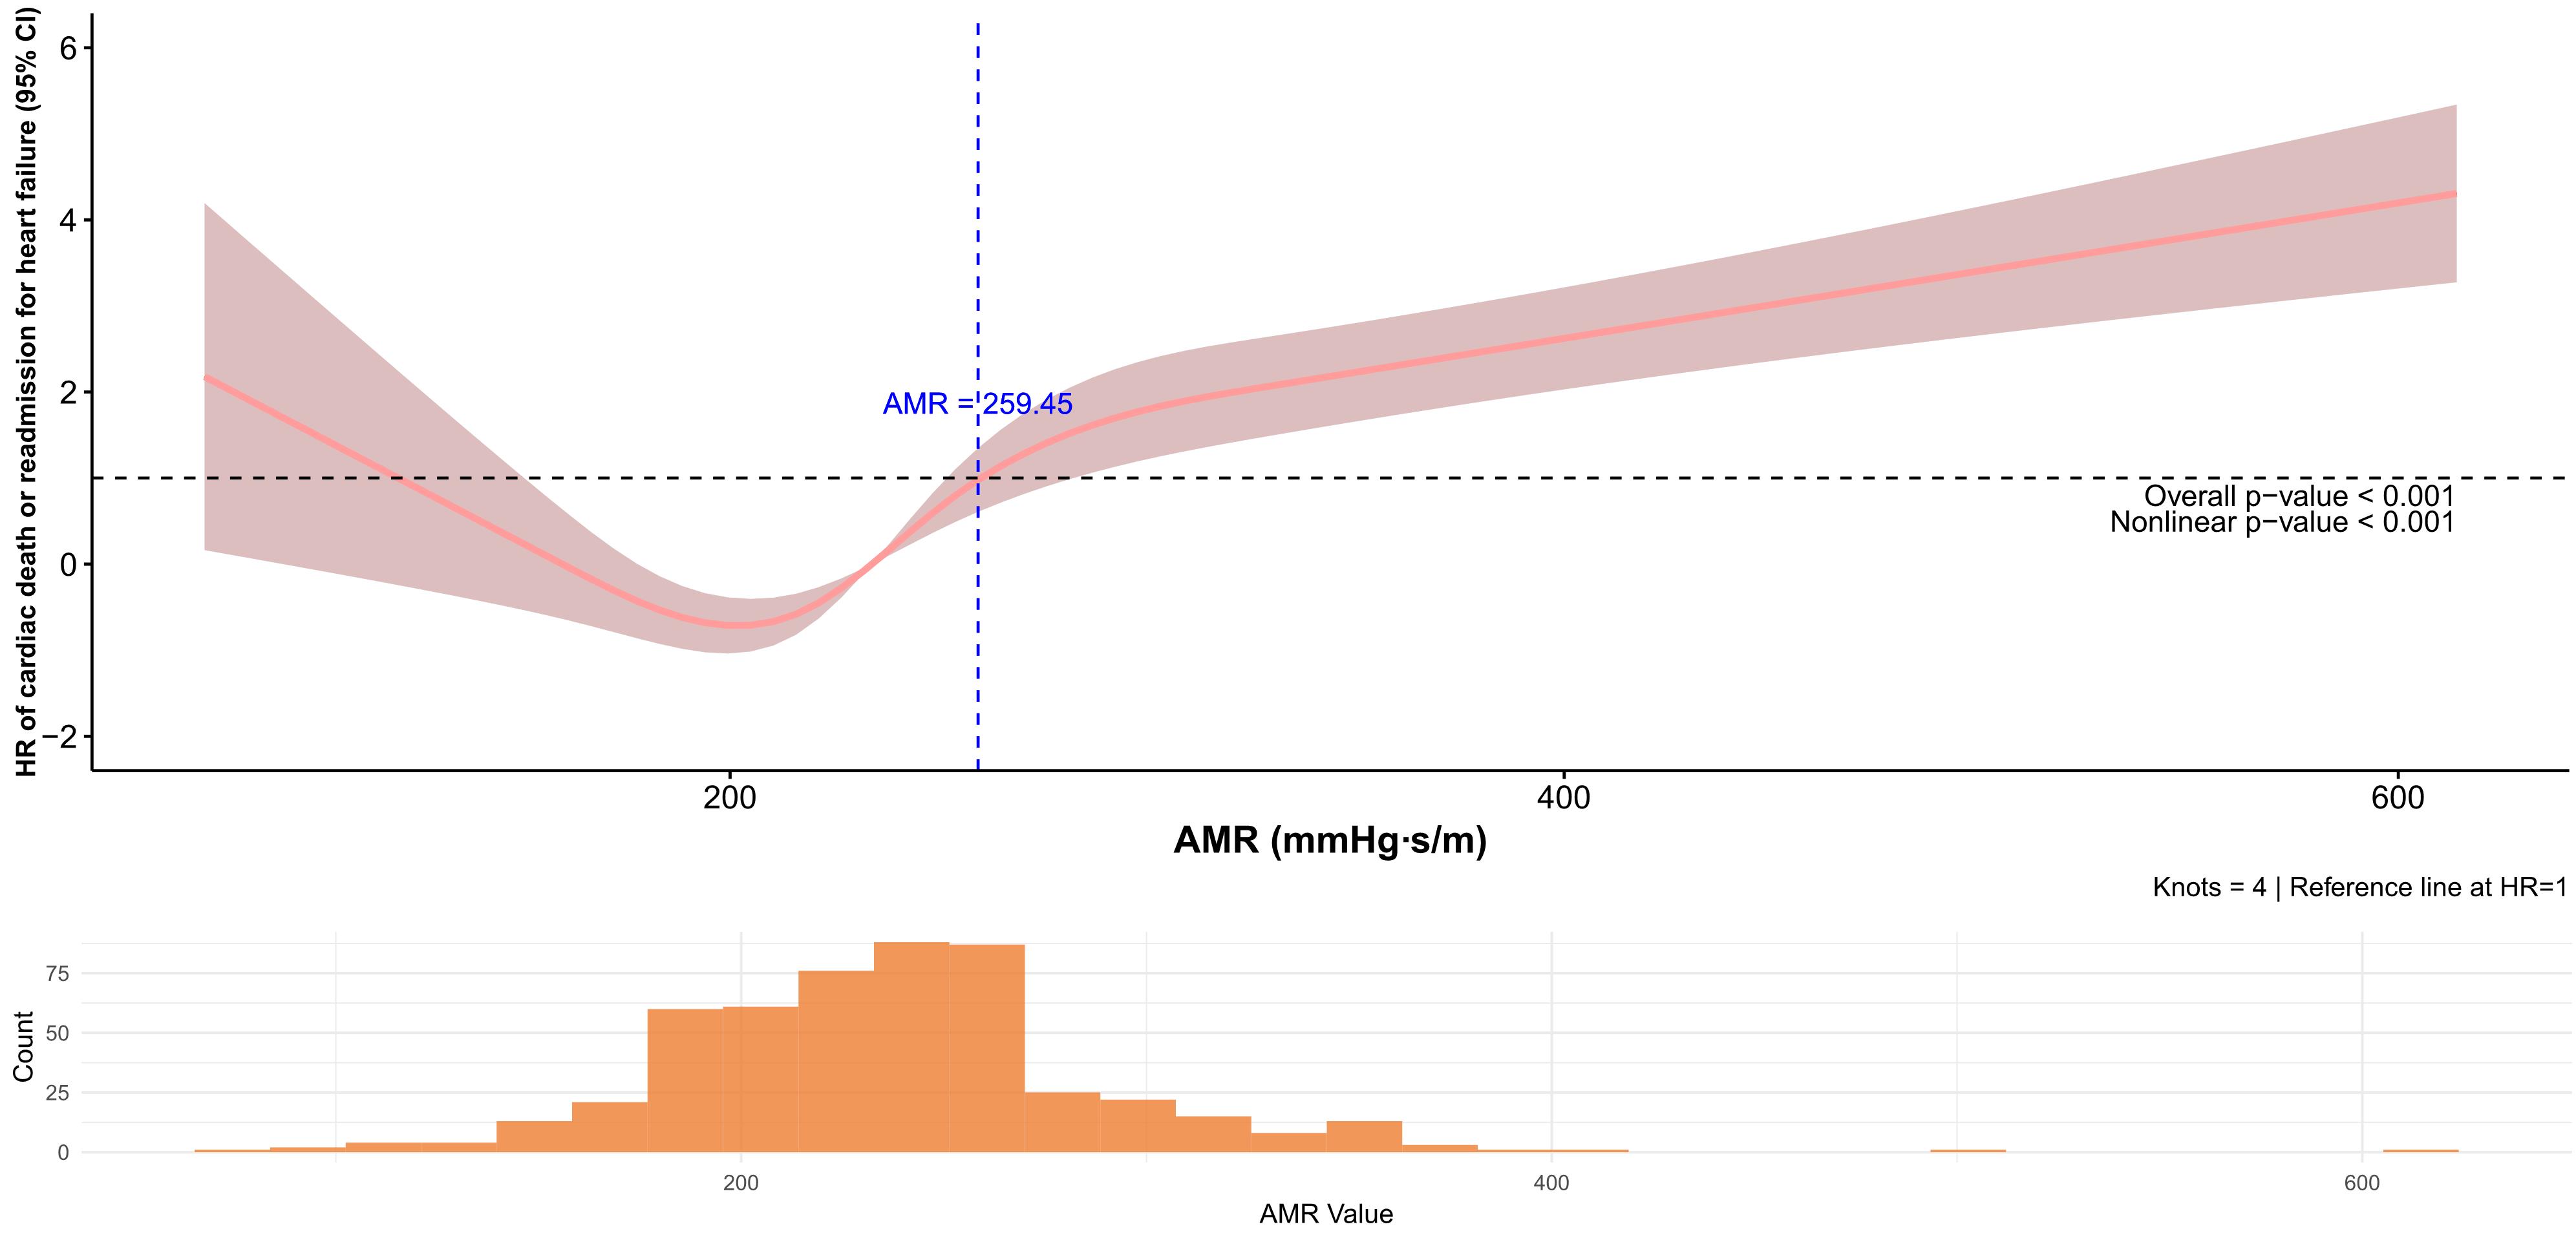
Fig.7 Relationships between MAR and the risk of cardiac death or readmission for heart failure according to the restricted cubic spline analysis.
| [1] | 胡司淦, 程增为, 李 敏, 等. 冠状动脉慢性完全闭塞病变侧支循环的建立与胰岛素抵抗的相关性[J]. 南方医科大学学报, 2024, 44(4): 780-6. |
| [2] | Li Y, Han YL. Interpretation of 2023 ESC Guidelines for the management of acute coronary syndromes[J]. Zhonghua Xin Xue Guan Bing Za Zhi, 2023, 51(12): 1263-7. |
| [3] | Milasinovic D, Nedeljkovic O, Maksimovic R, et al. Coronary microcirculation: the next frontier in the management of STEMI[J]. J Clin Med, 2023, 12(4): 1602. doi:10.3390/jcm12041602 |
| [4] | Rehan R, Virk S, Wong CCY, et al. Intracoronary thrombolysis in ST-elevation myocardial infarction: a systematic review and meta-analysis[J]. Heart, 2024, 110(15): 988-96. doi:10.1136/heartjnl-2024-324078 |
| [5] | Mignatti A, Echarte-Morales J, Sturla M, et al. State of the art of primary PCI: present and future[J]. J Clin Med, 2025, 14(2): 653. doi:10.3390/jcm14020653 |
| [6] | Kleinbongard P, Heusch G. A fresh look at coronary microembolization[J]. Nat Rev Cardiol, 2022, 19(4): 265-80. doi:10.1038/s41569-021-00632-2 |
| [7] | Sagris M, Theofilis P, Antonopoulos AS, et al. Inflammation in coronary microvascular dysfunction[J]. Int J Mol Sci, 2021, 22(24): 13471. doi:10.3390/ijms222413471 |
| [8] | Cui J, Liu W, Yan F, et al. Predictive value of cardiac magnetic resonance imaging for adverse left ventricular remodeling after acute ST-segment elevation myocardial infarction[J]. Nan Fang Yi Ke da Xue Xue Bao, 2024, 44(3): 553-62. |
| [9] | Travieso A, Jeronimo-Baza A, Faria D, et al. Invasive evaluation of coronary microvascular dysfunction[J]. J Nucl Cardiol, 2022, 29(5): 2474-86. doi:10.1007/s12350-022-02997-4 |
| [10] | Geng YY, Wu XT, Liu HP, et al. Index of microcirculatory resistance: state-of-the-art and potential applications in com-putational simulation of coronary artery disease[J]. J Zhejiang Univ SCIENCE B, 2022, 23(2): 123-40. doi:10.1631/jzus.b2100425 |
| [11] | Wang D, Li X, Feng W, et al. Diagnostic and prognostic value of angiography-derived index of microvascular resistance: a systematic review and meta-analysis[J]. Front Cardiovasc Med, 2024, 11: 1360648. doi:10.3389/fcvm.2024.1360648 |
| [12] | Zhan J, Zhong L, Wu J. Assessment and treatment for coronary microvascular dysfunction by contrast enhanced ultrasound[J]. Front Cardiovasc Med, 2022, 9: 899099. doi:10.3389/fcvm.2022.899099 |
| [13] | Biscaglia S, Verardi FM, Tebaldi M, et al. QFR-based virtual PCI or conventional angiography to guide PCI the AQVA trial[J]. JACC Cardiovasc Interv, 2023, 16(7): 783-94. doi:10.1016/j.jcin.2022.10.054 |
| [14] | Xu B, Tu SX, Qiao SB, et al. Diagnostic accuracy of angiography-based quantitative flow ratio measurements for online assessment of coronary stenosis[J]. J Am Coll Cardiol, 2017, 70(25): 3077-87. doi:10.1016/j.jacc.2017.10.035 |
| [15] | Rao SV, O’Donoghue ML, Ruel M, et al. Correction to: 2025 ACC/AHA/ACEP/NAEMSP/SCAI guideline for the management of patients with acute coronary syndromes: a report of the American college of cardiology/American heart association joint committee on clinical practice guidelines[J]. Circulation, 2025, 151(25): e1098. |
| [16] | Byrne R, Coughlan JJ, Rossello X, et al. The ‘10 commandments’ for the 2023 ESC Guidelines for the management of acute coronary syndromes[J]. Eur Heart J, 2024, 45(14): 1193-5. doi:10.1093/eurheartj/ehad863 |
| [17] | McDonagh TA, Metra M, Adamo M, et al. 2021 ESC Guidelines for the diagnosis and treatment of acute and chronic heart failure[J]. Eur Heart J, 2021, 42(36): 3599-726. |
| [18] | Xia Y, Xia C, Wu L, et al. Systemic immune inflammation index (SII), system inflammation response index (SIRI) and risk of all-cause mortality and cardiovascular mortality: a 20-year follow-up cohort study of 42, 875 US adults[J]. J Clin Med, 2023, 12(3): 1128. doi:10.3390/jcm12031128 |
| [19] | Jo YS, Moon H, Park K. Different microcirculation response between culprit and non-culprit vessels in patients with acute coronary syndrome[J]. J Am Heart Assoc, 2020, 9(10): e015507. doi:10.1161/jaha.119.015507 |
| [20] | Sokratous S, Mitsis A, Khattab E, et al. Coronary microvascular disease early after myocardial infarction: diagnostic approach and prognostic value-a narrative review[J]. Biomedicines, 2025, 13(6): 1289. doi:10.3390/biomedicines13061289 |
| [21] | Heusch G. Coronary blood flow in heart failure: cause, consequence and bystander[J]. Basic Res Cardiol, 2022, 117(1): 1. doi:10.1007/s00395-022-00909-8 |
| [22] | Yang DR, Wang MY, Zhang CL, et al. Endothelial dysfunction in vascular complications of diabetes: a comprehensive review of mechanisms and implications[J]. Front Endocrinol: Lausanne, 2024, 15: 1359255. doi:10.3389/fendo.2024.1359255 |
| [23] | Islam K, Islam R, Nguyen I, et al. Diabetes mellitus and associated vascular disease: pathogenesis, complications, and evolving treatments[J]. Adv Ther, 2025, 42(6): 2659-78. doi:10.1007/s12325-025-03185-9 |
| [24] | Goligorsky MS. Vascular endothelium in diabetes[J]. Am J Physiol Renal Physiol, 2017, 312(2): F266-75. doi:10.1152/ajprenal.00473.2016 |
| [25] | Galos G, Rabai M, Szabo R, et al. The influence of triglyceride and low-density-lipoprotein target levels on microcirculation: Is there a difference[J]? Heliyon, 2024, 10(6): e27954. doi:10.1016/j.heliyon.2024.e27954 |
| [26] | Qin P, Ho FK, Celis-Morales CA, et al. Association between systemic inflammation biomarkers and incident cardiovascular disease in 423, 701 individuals: evidence from the UK biobank cohort[J]. Cardiovasc Diabetol, 2025, 24(1): 162. doi:10.1186/s12933-025-02721-9 |
| [27] | Xu SW, Ilyas I, Little PJ, et al. Endothelial dysfunction in atherosclerotic cardiovascular diseases and beyond: from mechanism to pharmacotherapies[J]. Pharmacol Rev, 2021, 73(3): 924-67. doi:10.1124/pharmrev.120.000096 |
| [28] | Qian G, Qin H, Deng D, et al. Prognostic value of angiographic microvascular resistance in patients with ST-segment elevation myocardial infarction[J]. Clinics: Sao Paulo, 2024, 79: 100429. doi:10.1016/j.clinsp.2024.100429 |
| [29] | Luo D, Wu H, Zhou W, et al. Angio-based coronary functional assessment predicts 30-day new-onset heart failure after acute myocardial infarction[J]. ESC Heart Fail, 2023, 10(5): 2914-26. doi:10.1002/ehf2.14452 |
| [30] | Ma J, Xia R, Lan Y, et al. Angiographic microvascular resistance in patients with obstructive hypertrophic cardiomyopathy[J]. Microvasc Res, 2024, 153: 104656. doi:10.1016/j.mvr.2024.104656 |
| [31] | Westra J, Andersen BK, Campo G, et al. Diagnostic performance of in-procedure angiography-derived quantitative flow reserve compared to pressure-derived fractional flow reserve: the FAVOR II Europe-Japan study[J]. J Am Heart Assoc, 2018, 7(14): e009603. doi:10.1161/jaha.118.009603 |
| [32] | Watarai M, Otsuka M, Yazaki K, et al. Applicability of quantitative flow ratio for rapid evaluation of intermediate coronary stenosis: comparison with instantaneous wave-free ratio in clinical practice[J]. Int J Cardiovasc Imag, 2019, 35(11): 1963-9. doi:10.1007/s10554-019-01656-z |
| Viewed | ||||||
|
Full text |
|
|||||
|
Abstract |
|
|||||