南方医科大学学报 ›› 2025, Vol. 45 ›› Issue (9): 1903-1918.doi: 10.12122/j.issn.1673-4254.2025.09.10
• • 上一篇
黄启智1,2( ), 谢戴鹏3, 姚霖彤2, 李洽轩4, 吴少伟2, 周海榆1,2()
收稿日期:2025-04-12
出版日期:2025-09-20
发布日期:2025-09-28
通讯作者:
周海榆
E-mail:hccxxzz@163.com;zhouhaiyu@gdph.org.cn
作者简介:黄启智,硕士,医师,E-mail: hccxxzz@163.com
基金资助:
Qizhi HUANG1,2(), Daipeng XIE3, Lintong YAO2, Qiaxuan LI4, Shaowei WU2, Haiyu ZHOU1,2()
Received:2025-04-12
Online:2025-09-20
Published:2025-09-28
Contact:
Haiyu ZHOU
E-mail:hccxxzz@163.com;zhouhaiyu@gdph.org.cn
Supported by:摘要:
目的 开发基于胸部CT的肿瘤微环境特异性影像组学模型,结合临床信息构建诺莫图用于预测晚期非小细胞肺癌(aNSCLC)免疫检查点抑制剂(ICIs)疗效。 方法 整合TCGA、GEO和TCIA数据库的转录组与CT影像数据,通过加权基因共表达网络分析(WGCNA)在GEO队列中筛选ICIs治疗相关基因(IRGs),随后在TCGA基于IRGs构建机器学习预后模型并探究高低风险组患者的肿瘤免疫微环境特征;通过 “PyRadiomics” 软件包提取TCIA中lung_3队列的影像组学特征,筛选出与IRGs相关(|r|>0.4)的94个特征。回顾性分析2016年1月~2020年12月在广东省人民医院接受首程ICIs治疗的210例aNSCLC患者,按7∶3的比例分为训练组(n=147)与验证组(n=63),在训练组中通过最小绝对收缩和选择算子筛选影像特征,结合Logistic回归构建临床-影像组学联合模型及诺莫图预测ICIs疗效,采用受试者工作曲线曲线、校准曲线和决策曲线分析评估模型性能。 结果 WGCNA筛选出84个与免疫反应激活通路相关的IRGs,基于与IRGs相关的肿瘤微环境特异性影像组学标签联合临床特征的ICIs疗效预测模型在训练组(AUC=0.725,95% CI:0.644~0.807)和验证组(AUC=0.706,95% CI:0.577~0.836)的表现均优于单一模型,且能有效预测aNSCLC患者生存情况。诺莫图的校准曲线与决策曲线分析证实其临床实用价值。 结论 本研究建立的“基因组-影像组-临床”多维预测体系为aNSCLC的ICIs治疗疗效评估提供了可解释的生物标志物组合及临床决策工具。
黄启智, 谢戴鹏, 姚霖彤, 李洽轩, 吴少伟, 周海榆. 肿瘤微环境特异性CT影像组学标签预测非小细胞肺癌免疫治疗疗效[J]. 南方医科大学学报, 2025, 45(9): 1903-1918.
Qizhi HUANG, Daipeng XIE, Lintong YAO, Qiaxuan LI, Shaowei WU, Haiyu ZHOU. Tumor microenvironment-specific CT radiomics signature for predicting immunotherapy response in non-small cell lung cancer[J]. Journal of Southern Medical University, 2025, 45(9): 1903-1918.
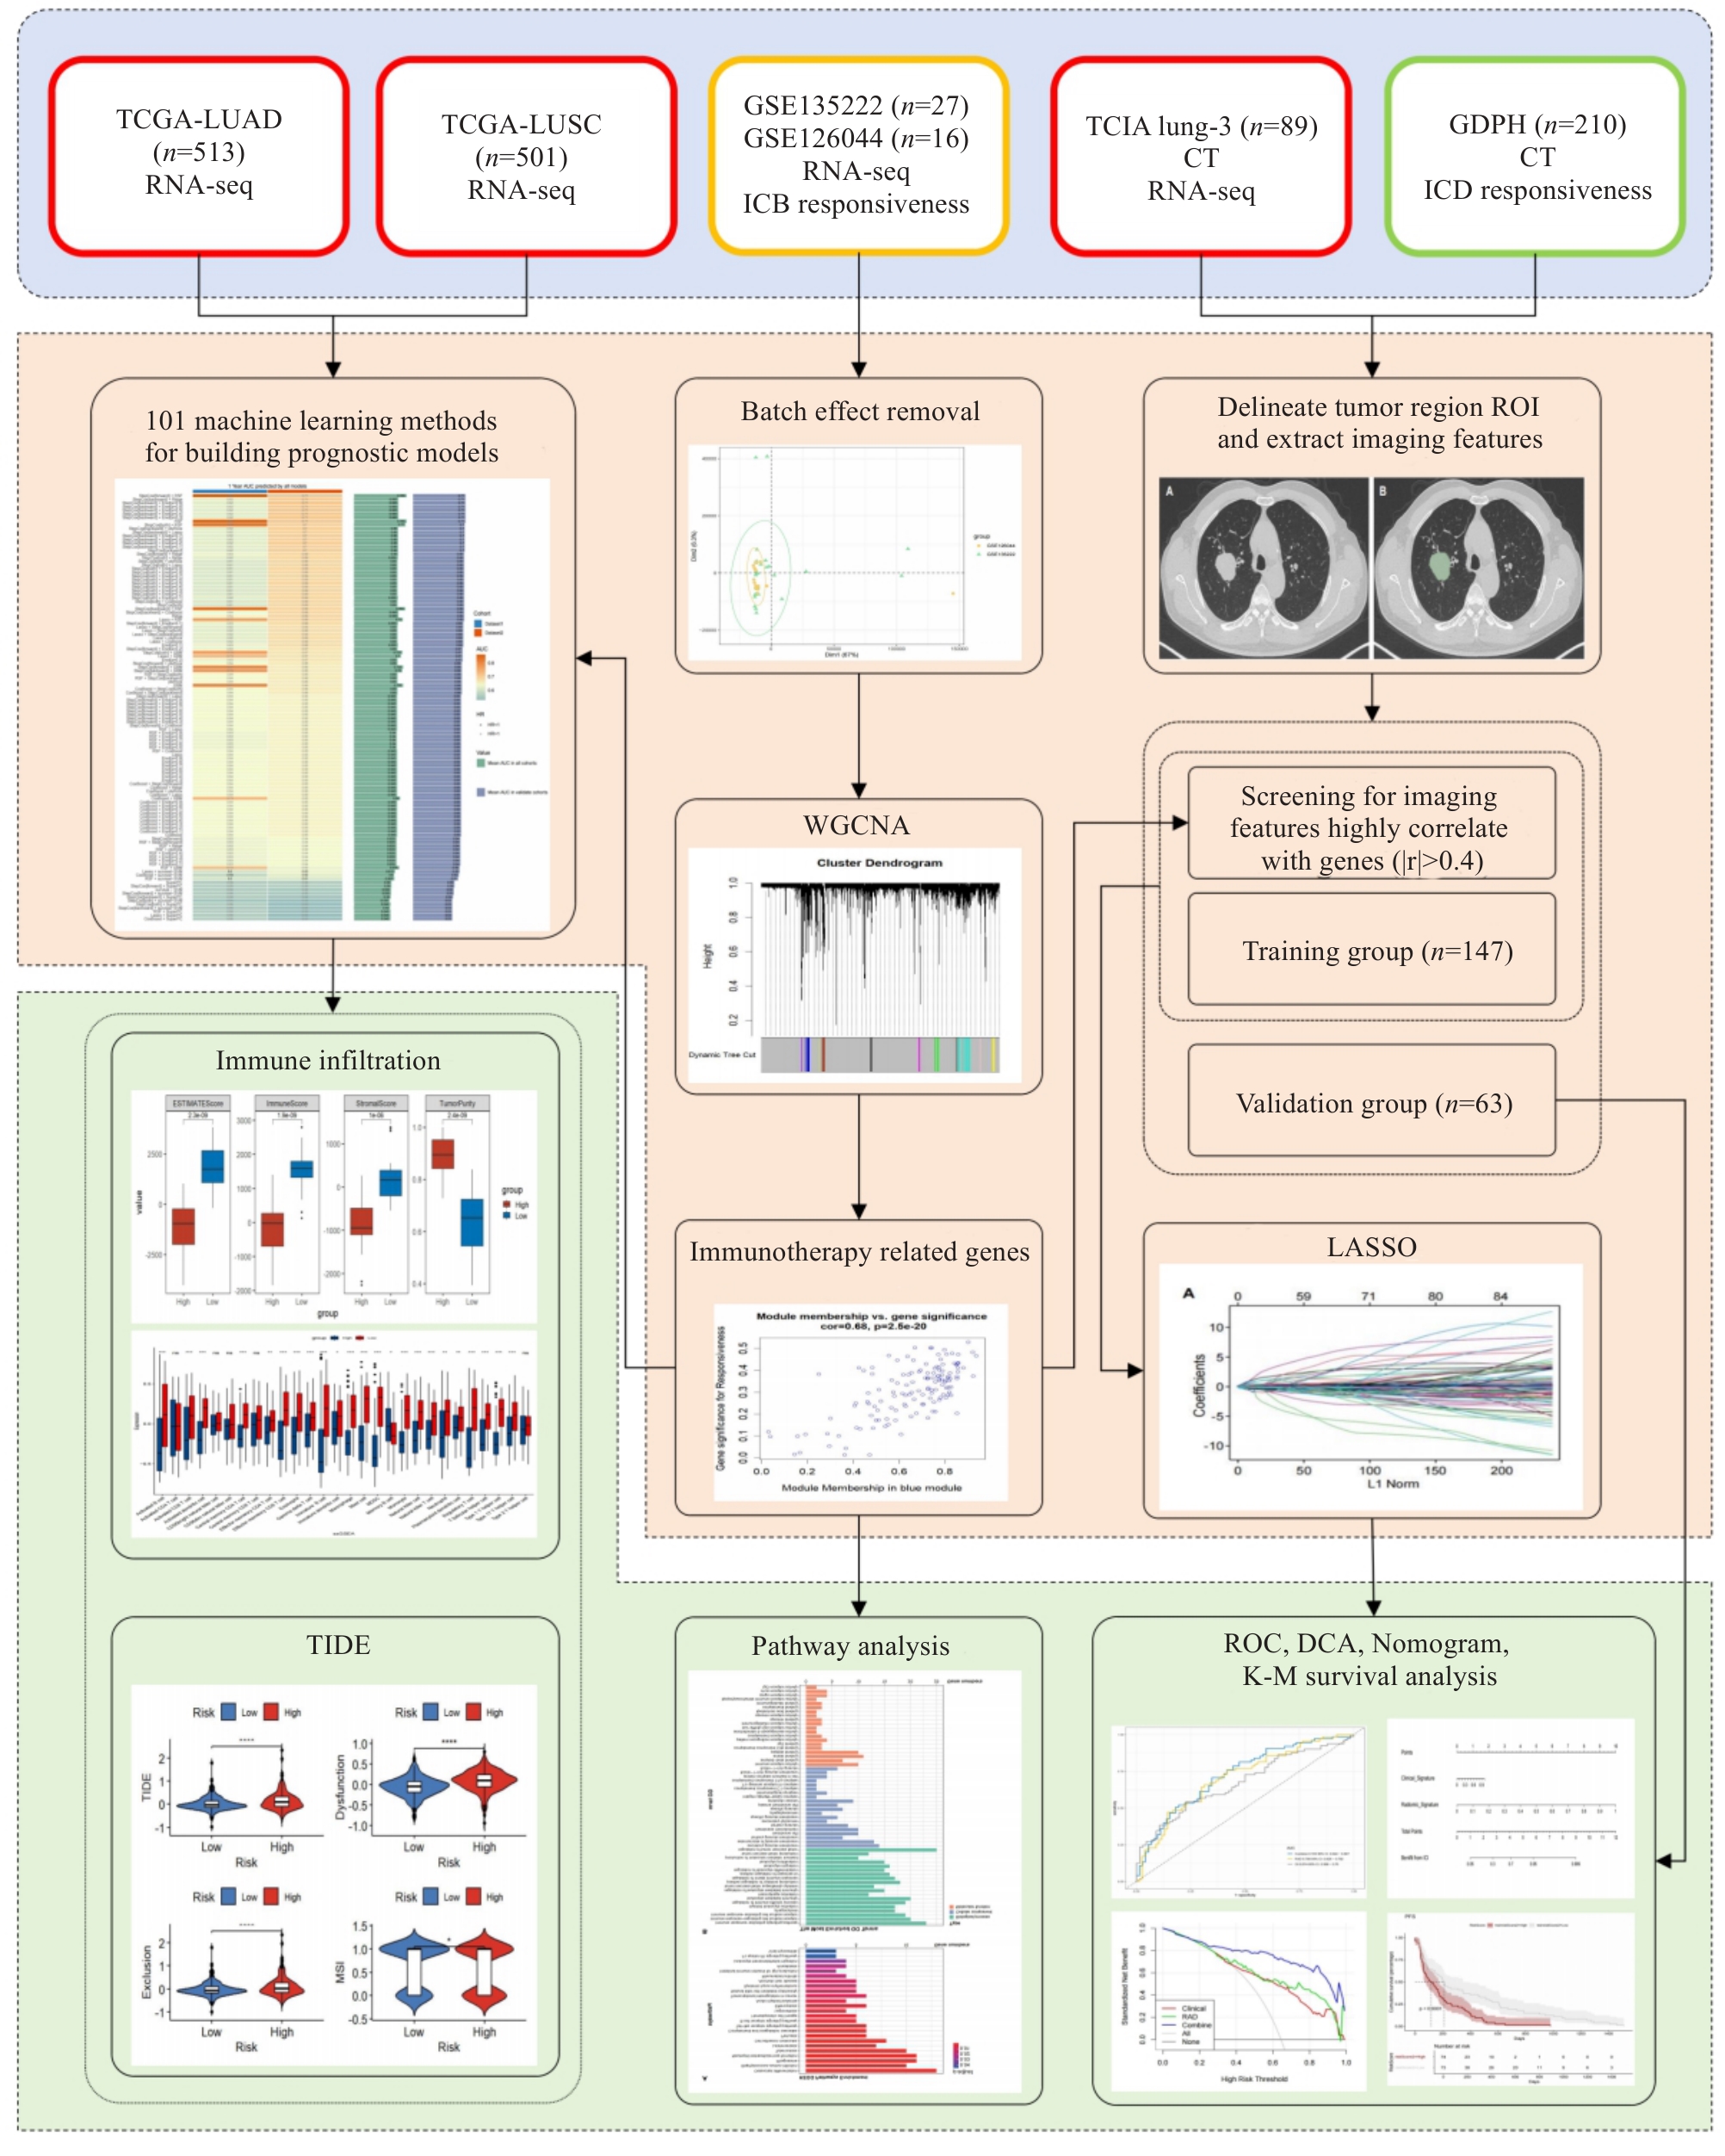
图1 工作流程图
Fig.1 Flowchart of the study. We integrated the transcriptomic and CT imaging data from the TCGA, GEO, and TCIA databases and used weighted gene co-expression network analysis (WGCNA) to identify immune checkpoint inhibitors (ICIs)-related genes (IRGs) in the GEO cohort. A machine learning prognostic model was constructed in TCGA, and the tumor immune microenvironment characteristics of the patients in high- and low-risk groups were explored based on these IRGs. We extracted radiomic features from the lung_3 and identified 94 features significantly correlated with IRGs (|r|>0.4). We retrospectively analyzed 210 patients with advanced non-small cell lung cancer (aNSCLC), who were divided into the training group and validation group in a 7:3 ratio. In the training group, we used LASSO to select the imaging features and combined them with logistic regression to construct a clinical-radiomics nomogram for predicting ICIs efficacy. The performance of the model was evaluated using ROC curves, calibration curves, and decision curves.
| Variable | Total (n=43) | GSE126044 (n=16) | GSE135222 (n=27) | Z/χ² | P |
|---|---|---|---|---|---|
| Age [year, Median (Q₁, Q₃)] | 64.00 (56.50, 68.00) | 64.50 (55.75, 68.25) | 62.00 (58.00, 68.00) | 0.00 | >0.999 |
| PFS [month, Median (Q₁, Q₃)] | 2.17 (1.05, 7.08) | 2.55 (0.95, 8.87) | 1.97 (1.18, 6.32) | -0.26 | 0.792 |
| Gender [n (%)] | 0.01 | 0.929 | |||
| Female | 7 (16.28) | 2 (12.50) | 5 (18.52) | ||
| Male | 36 (83.72) | 14 (87.50) | 22 (81.48) | ||
| Histology [n (%)] | - | <0.001 | |||
| LUAD | 7 (16.28) | 7 (43.75) | 0 (0.00) | ||
| LUSC | 9 (20.93) | 9 (56.25) | 0 (0.00) | ||
| N/A | 27 (62.79) | 0 (0.00) | 27 (100.00) | ||
| Drug [n(%)] | 43.00 | <0.001 | |||
| N/A | 27 (62.79) | 0 (0.00) | 27 (100.00) | ||
| Nivolumab | 16 (37.21) | 16 (100.00) | 0 (0.00) | ||
| PD-L1 expression [n (%)] | - | <0.001 | |||
| N/A | 29 (67.44) | 2 (12.50) | 27 (100.00) | ||
| No | 9 (20.93) | 9 (56.25) | 0 (0.00) | ||
| Yes | 5 (11.63) | 5 (31.25) | 0 (0.00) |
表1 GEO患者基线数据
Tab.1 Clinical information of GEO patients
| Variable | Total (n=43) | GSE126044 (n=16) | GSE135222 (n=27) | Z/χ² | P |
|---|---|---|---|---|---|
| Age [year, Median (Q₁, Q₃)] | 64.00 (56.50, 68.00) | 64.50 (55.75, 68.25) | 62.00 (58.00, 68.00) | 0.00 | >0.999 |
| PFS [month, Median (Q₁, Q₃)] | 2.17 (1.05, 7.08) | 2.55 (0.95, 8.87) | 1.97 (1.18, 6.32) | -0.26 | 0.792 |
| Gender [n (%)] | 0.01 | 0.929 | |||
| Female | 7 (16.28) | 2 (12.50) | 5 (18.52) | ||
| Male | 36 (83.72) | 14 (87.50) | 22 (81.48) | ||
| Histology [n (%)] | - | <0.001 | |||
| LUAD | 7 (16.28) | 7 (43.75) | 0 (0.00) | ||
| LUSC | 9 (20.93) | 9 (56.25) | 0 (0.00) | ||
| N/A | 27 (62.79) | 0 (0.00) | 27 (100.00) | ||
| Drug [n(%)] | 43.00 | <0.001 | |||
| N/A | 27 (62.79) | 0 (0.00) | 27 (100.00) | ||
| Nivolumab | 16 (37.21) | 16 (100.00) | 0 (0.00) | ||
| PD-L1 expression [n (%)] | - | <0.001 | |||
| N/A | 29 (67.44) | 2 (12.50) | 27 (100.00) | ||
| No | 9 (20.93) | 9 (56.25) | 0 (0.00) | ||
| Yes | 5 (11.63) | 5 (31.25) | 0 (0.00) |
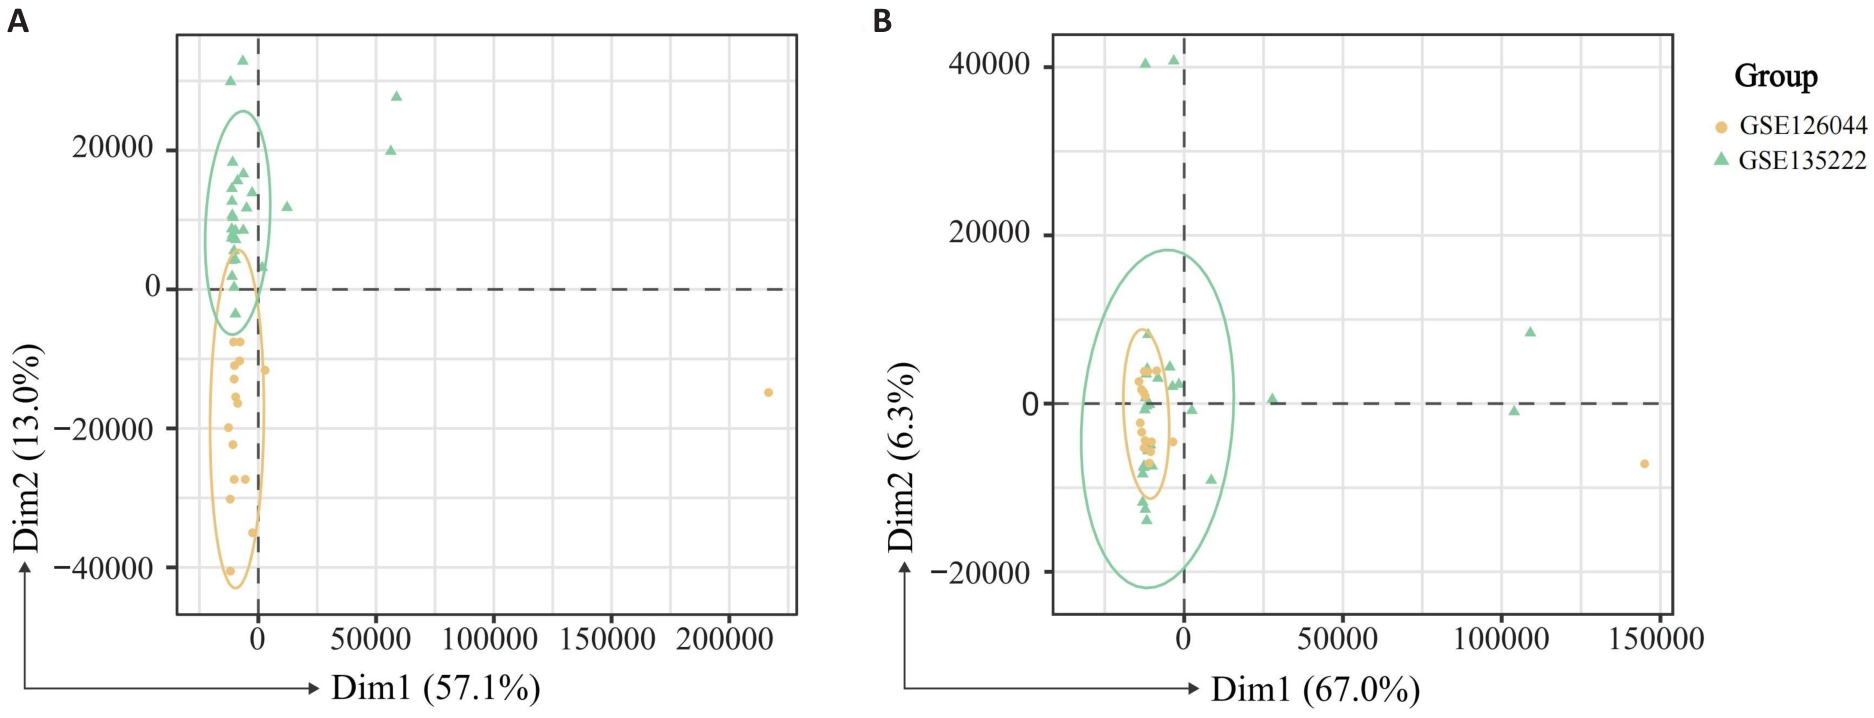
图2 批次效应校正前(A)及校正后(B)的 mRNA 测序数据的主成分分析
Fig.2 Principal component analysis (PCA) of mRNA-sequencing data before (A) and after (B) batch effect correction.
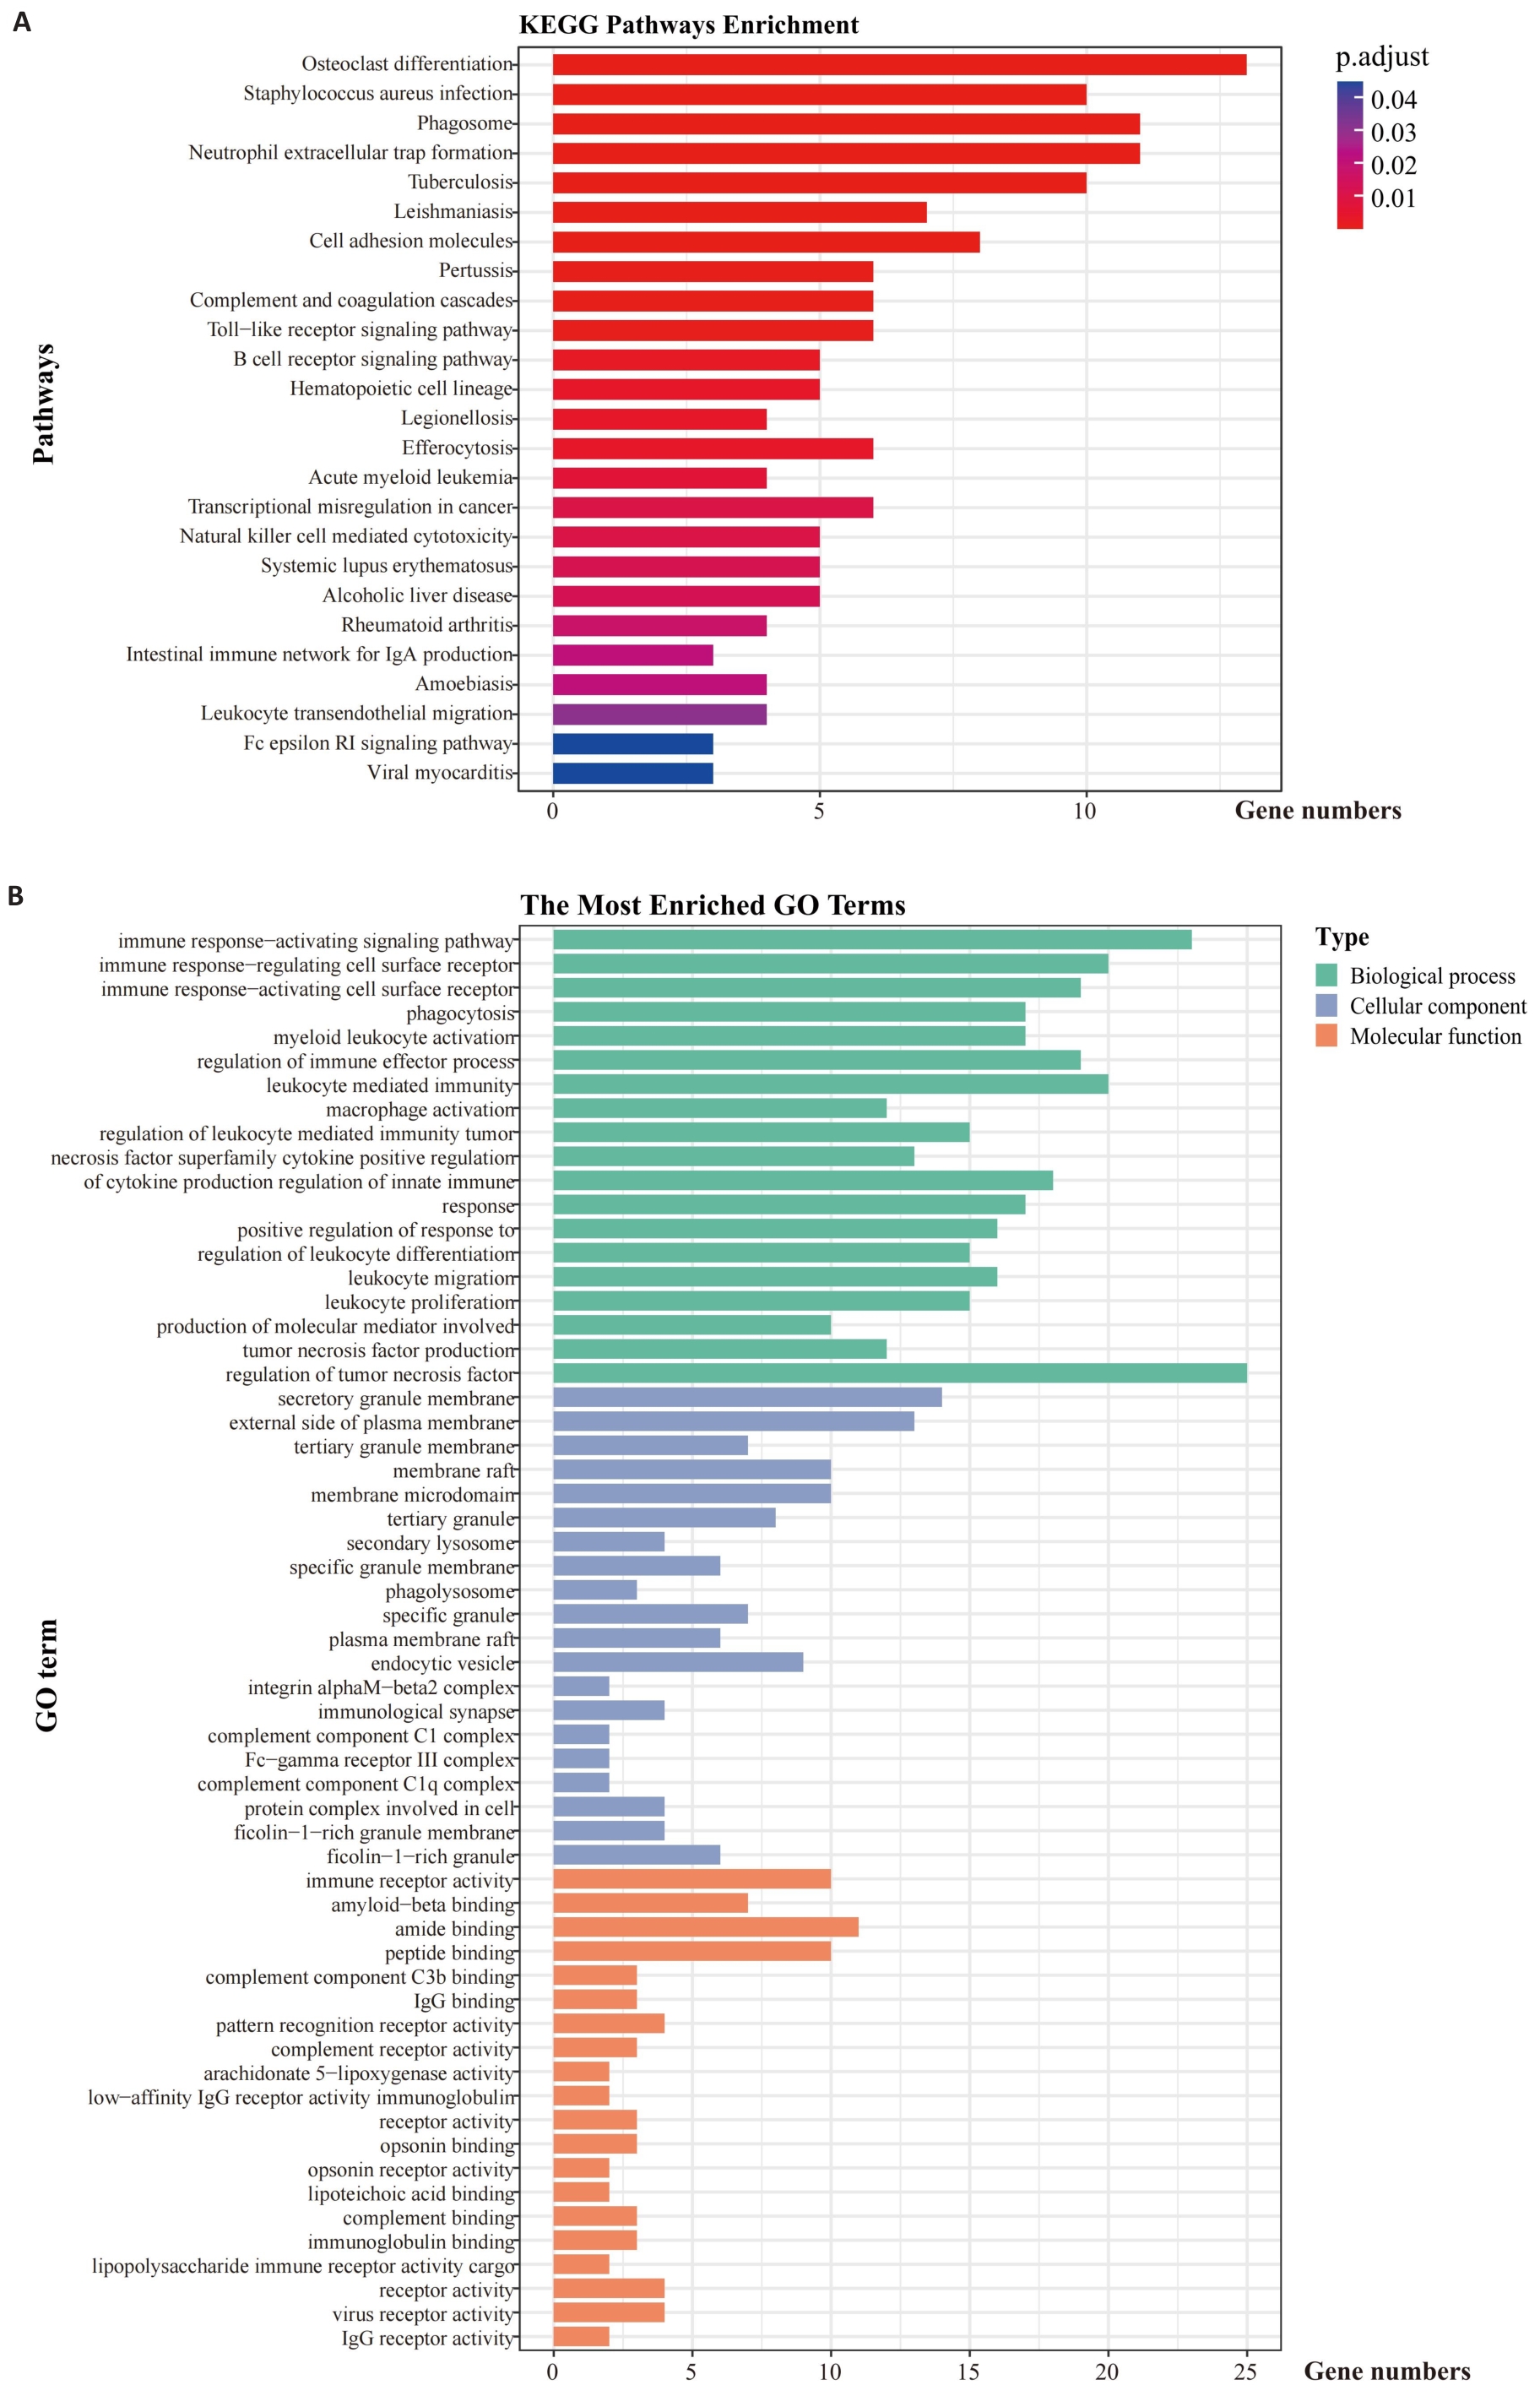
图4 免疫治疗相关基因的的KEGG(A)及GO(B)富集通路分析
Fig.4 Kyoto Encyclopedia of Genes and Genomes (A) and Gene Ontology (B) pathway analysis of the IRGs.
| Variable | Training group (n=698) | Testing group (n=298) | t/χ² | P |
|---|---|---|---|---|
| Age (year, Mean±SD) | 65.34±11.77 | 64.94±13.48 | 0.47 | 0.636 |
| OS (day, Mean±SD) | 964.50±963.00 | 887.70±841.20 | 1.20 | 0.232 |
| Gender [n (%)] | 1.73 | 0.188 | ||
| Female | 271 (38.83) | 129 (43.29) | ||
| Male | 427 (61.17) | 169 (56.71) | ||
| Status [n (%)] | 0.59 | 0.443 | ||
| Alive | 428 (61.32) | 175 (58.72) | ||
| Dead | 270 (38.68) | 123 (41.28) | ||
| T stage [n (%)] | 0.58 | 0.965 | ||
| T1 | 194 (27.79) | 88 (29.53) | ||
| T2 | 391 (56.02) | 164 (55.03) | ||
| T3 | 83 (11.89) | 32 (10.74) | ||
| T4 | 28 (4.01) | 13 (4.36) | ||
| Tx | 2 (0.29) | 1 (0.34) | ||
| M stage [n (%)] | 0.26 | 0.877 | ||
| M0 | 518 (74.21) | 222 (74.50) | ||
| M1 | 23 (3.30) | 8 (2.68) | ||
| Mx | 157 (22.49) | 68 (22.82) | ||
| N stage [n (%)] | - | 0.733 | ||
| N0 | 456 (65.33) | 186 (62.42) | ||
| N1 | 149 (21.35) | 73 (24.50) | ||
| N2 | 75 (10.74) | 34 (11.41) | ||
| N3 | 6 (0.86) | 1 (0.34) | ||
| Nx | 12 (1.72) | 4 (1.34) | ||
| Histology [n (%)] | 0.04 | 0.835 | ||
| LUAD | 351 (50.29) | 152 (51.01) | ||
| LUSC | 347 (49.71) | 146 (48.99) |
表2 TCGA患者基线数据
Tab.2 Baseline data of the patient cohorts from the TCGA database
| Variable | Training group (n=698) | Testing group (n=298) | t/χ² | P |
|---|---|---|---|---|
| Age (year, Mean±SD) | 65.34±11.77 | 64.94±13.48 | 0.47 | 0.636 |
| OS (day, Mean±SD) | 964.50±963.00 | 887.70±841.20 | 1.20 | 0.232 |
| Gender [n (%)] | 1.73 | 0.188 | ||
| Female | 271 (38.83) | 129 (43.29) | ||
| Male | 427 (61.17) | 169 (56.71) | ||
| Status [n (%)] | 0.59 | 0.443 | ||
| Alive | 428 (61.32) | 175 (58.72) | ||
| Dead | 270 (38.68) | 123 (41.28) | ||
| T stage [n (%)] | 0.58 | 0.965 | ||
| T1 | 194 (27.79) | 88 (29.53) | ||
| T2 | 391 (56.02) | 164 (55.03) | ||
| T3 | 83 (11.89) | 32 (10.74) | ||
| T4 | 28 (4.01) | 13 (4.36) | ||
| Tx | 2 (0.29) | 1 (0.34) | ||
| M stage [n (%)] | 0.26 | 0.877 | ||
| M0 | 518 (74.21) | 222 (74.50) | ||
| M1 | 23 (3.30) | 8 (2.68) | ||
| Mx | 157 (22.49) | 68 (22.82) | ||
| N stage [n (%)] | - | 0.733 | ||
| N0 | 456 (65.33) | 186 (62.42) | ||
| N1 | 149 (21.35) | 73 (24.50) | ||
| N2 | 75 (10.74) | 34 (11.41) | ||
| N3 | 6 (0.86) | 1 (0.34) | ||
| Nx | 12 (1.72) | 4 (1.34) | ||
| Histology [n (%)] | 0.04 | 0.835 | ||
| LUAD | 351 (50.29) | 152 (51.01) | ||
| LUSC | 347 (49.71) | 146 (48.99) |
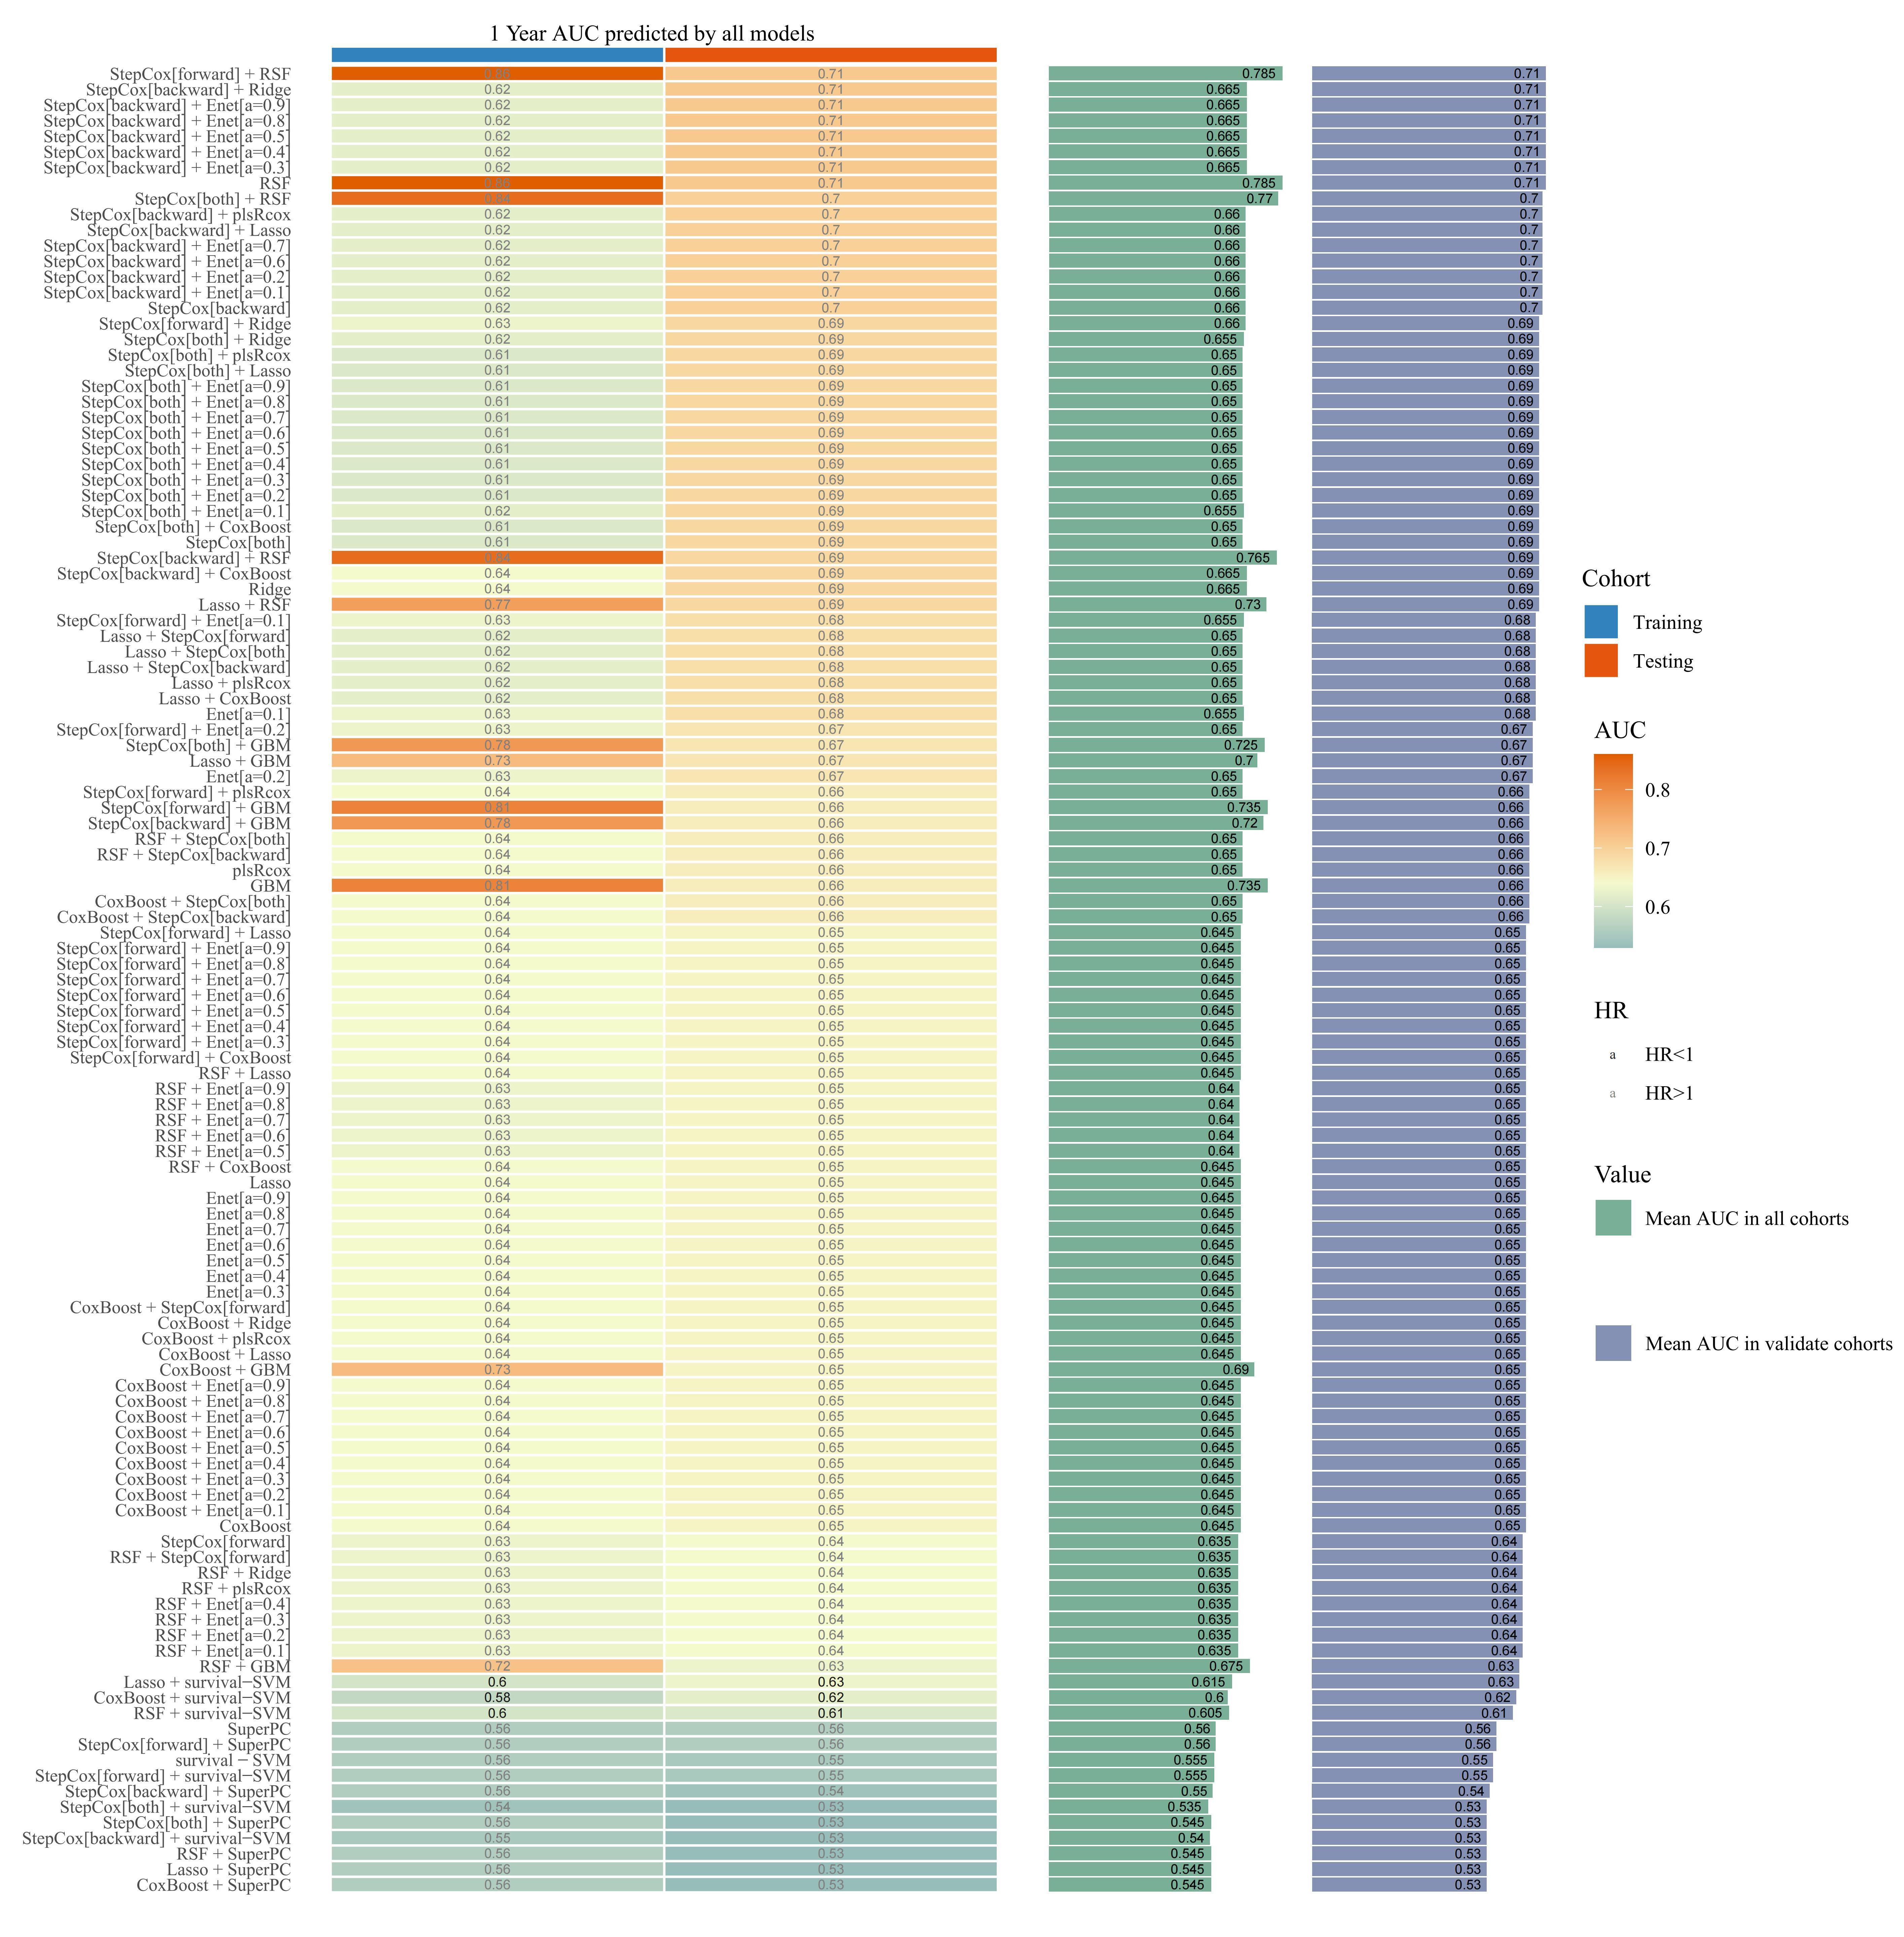
图5 101种机器学习构建预测模型
Fig.5 Predictive models constructed using 101 kinds of machine learning.
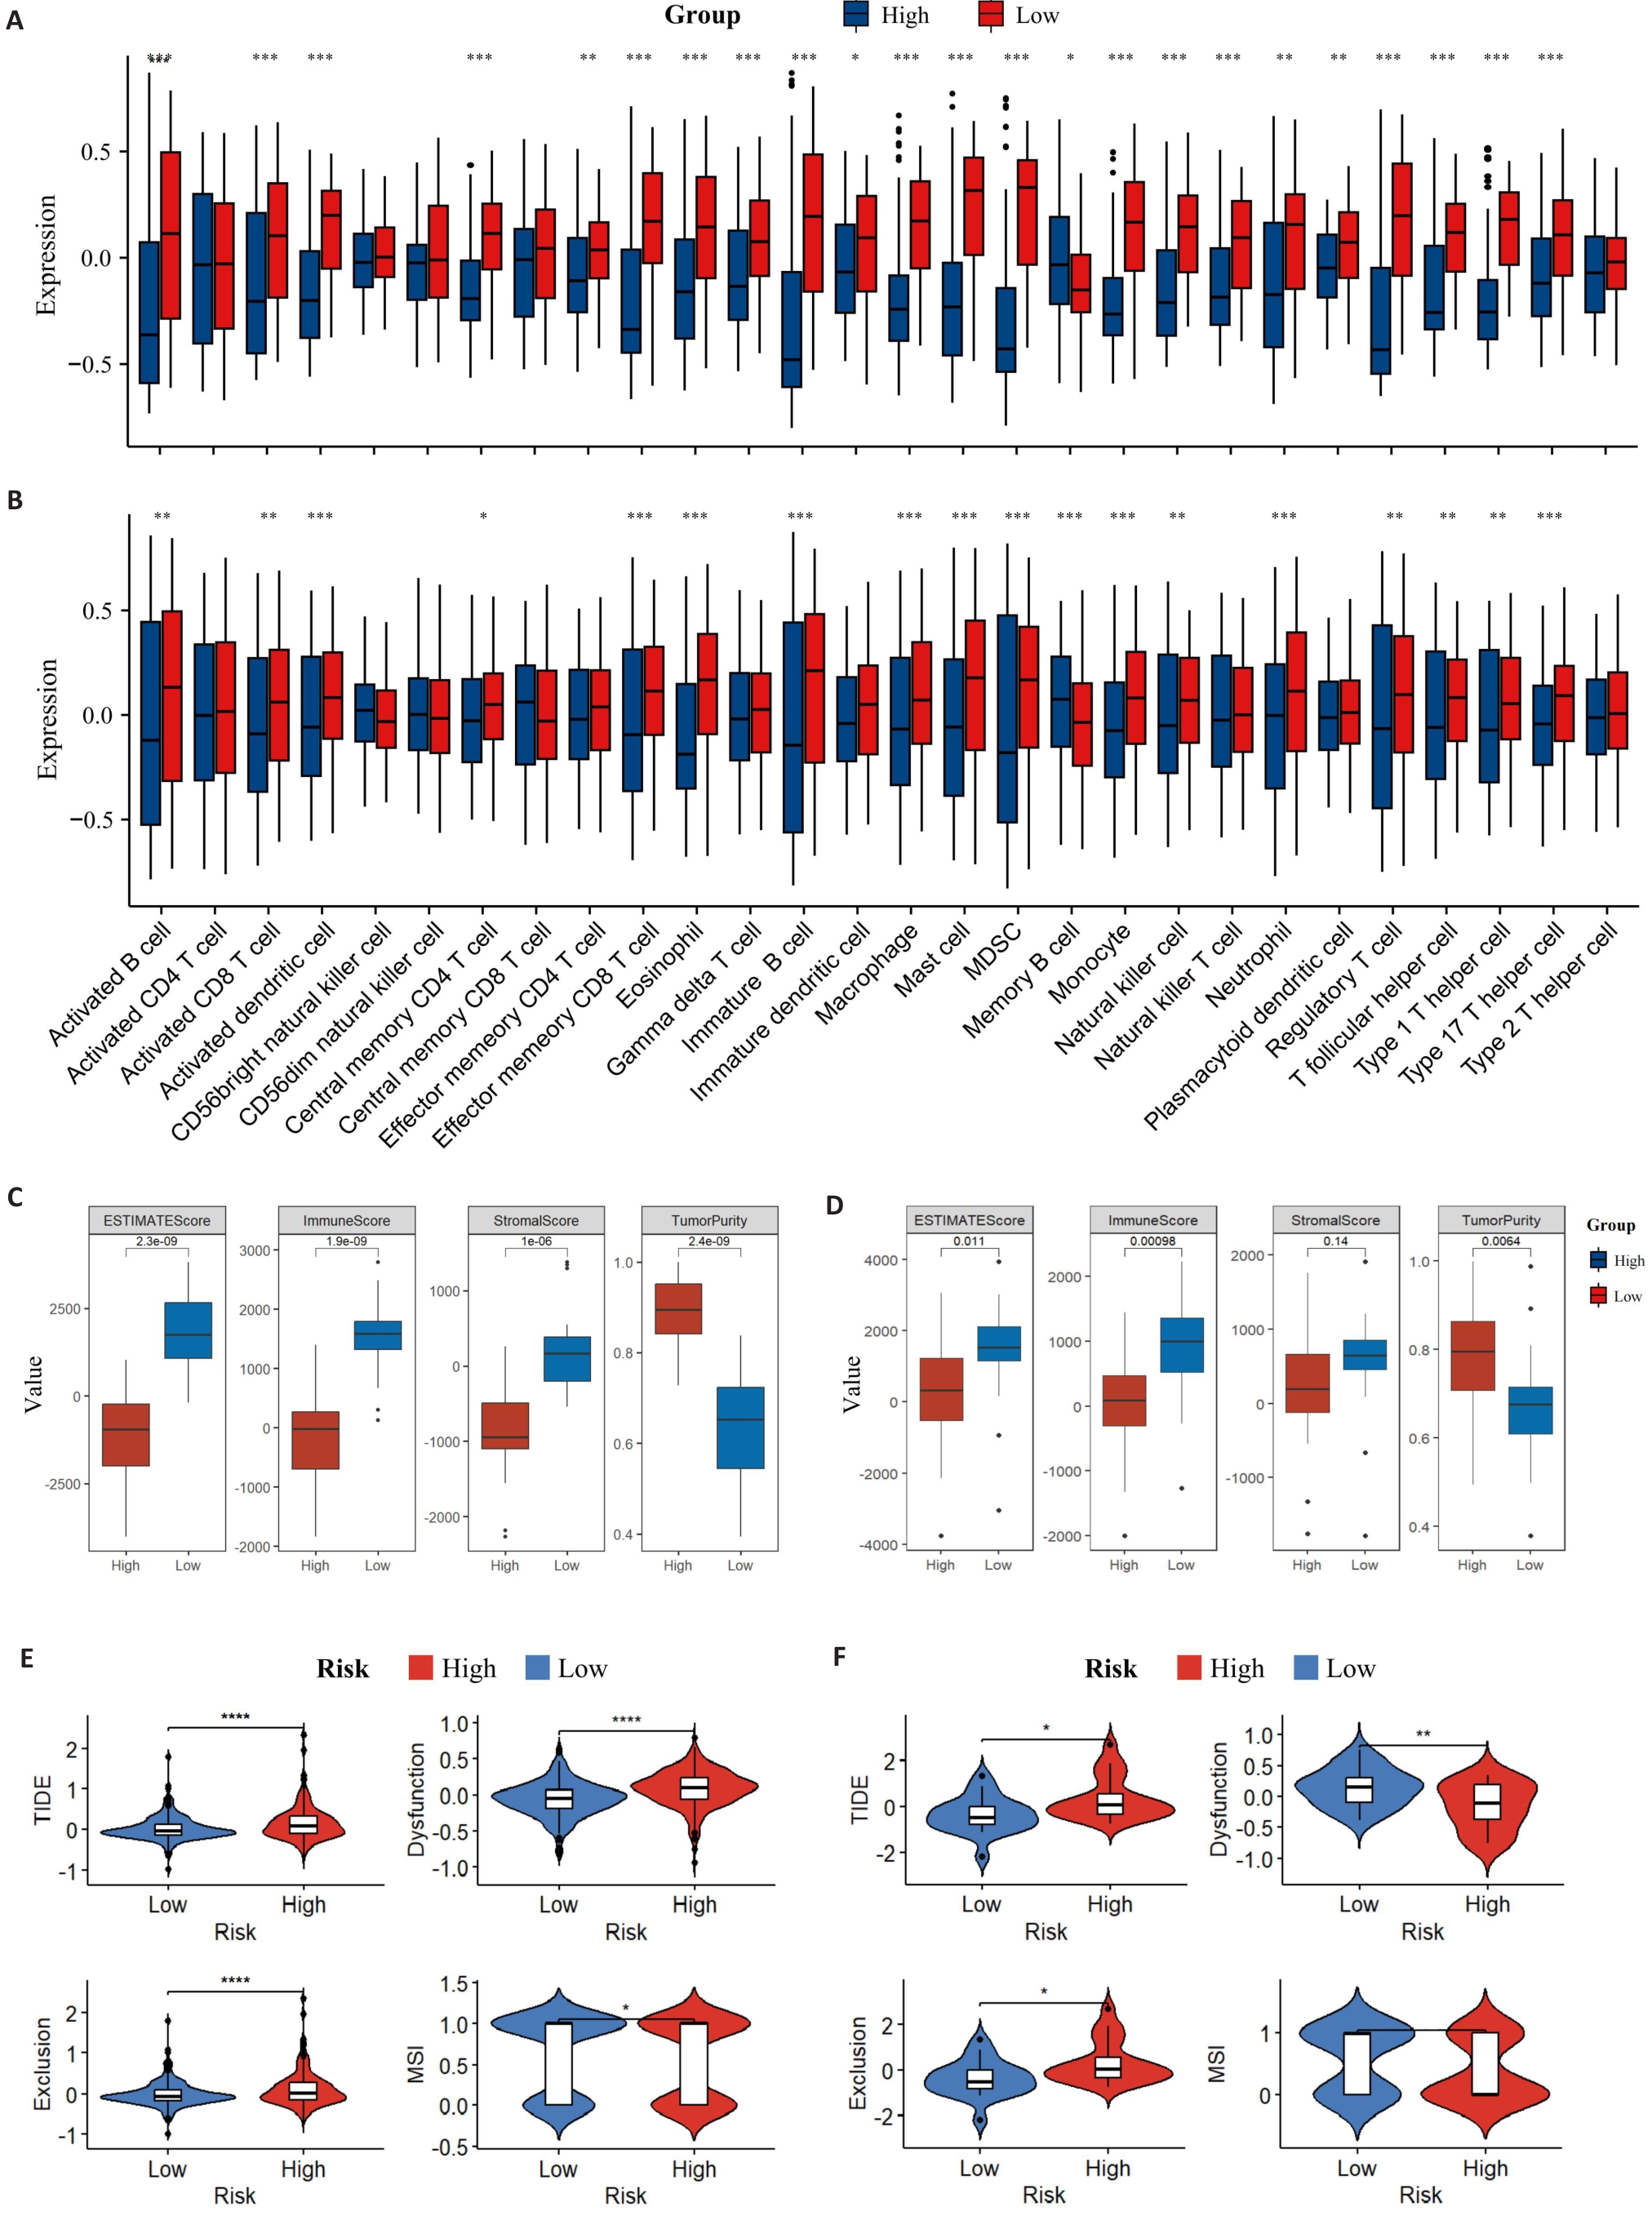
图7 TME免疫浸润情况
Fig.7 Distribution of TME immune infiltration components. A: Distribution of TME immune cell infiltration components of the training set by ssGSEA. B: Distribution of TME immune cell infiltration components of the validation set by ssGSEA. C: ESTIMATE scores of the training set. D: ESTIMATE scores of the validation set. E: TIDE in the training set. F: TIDE in the validation set (B). *P<0.05, **P<0.01, ***P<0.001, ****P<0.0001.
| Variables | Training group | Testing group | ||||||
|---|---|---|---|---|---|---|---|---|
| R (n=69) | nR (n=78) | t/χ² | P | R (n=28) | nR (n=35) | t/χ² | P | |
| Age (year, Mean±SD) | 60.55±10.48 | 60.46±9.78 | 0.05 | 0.958 | 59.86±9.34 | 60.34±8.72 | -0.21 | 0.832 |
| OS (day, Mean±SD) | 681.16±322.46 | 318.42±302.09 | 6.99 | <0.001 | 719.86±348.41 | 283.91±237.60 | 5.65 | <0.001 |
| PFS (day, Mean±SD) | 515.13±60.73 | 81.87±49.70 | 9.89 | <0.001 | 623.96±340.28 | 89.74±111.86 | 7.97 | <0.001 |
| Gender [n (%)] | 10.55 | 0.001 | 0.56 | 0.456 | ||||
| Male | 65 (94.20) | 58 (74.36) | 23 (82.14) | 26 (74.29) | ||||
| Female | 4 (5.80) | 20 (25.64) | 5 (17.86) | 9 (25.71) | ||||
| ECOG [n (%)] | 0.97 | 0.324 | 3.35 | 0.067 | ||||
| 0-1 | 65 (94.20) | 70 (89.74) | 27 (100.00) | 29 (82.86) | ||||
| ≥2 | 4 (5.80) | 8 (10.26) | 0 (0.00) | 6 (17.14) | ||||
| Smoking status [n (%)] | - | 0.031 | 1.83 | 0.176 | ||||
| Never smoked | 25 (36.23) | 42 (53.85) | 12 (42.86) | 21 (60.00) | ||||
| Current or former smoker | 44 (63.77) | 35 (44.87) | 16 (57.14) | 14 (40.00) | ||||
| Missing | 0 (0.00) | 1 (1.28) | - | - | ||||
| Tumor histologic type [n (%)] | 0.05 | 0.825 | 1.24 | 0.265 | ||||
| LUAD | 52 (75.36) | 60 (76.92) | 24 (85.71) | 26 (74.29) | ||||
| LUSC | 17 (24.64) | 18 (23.08) | 4 (14.29) | 9 (25.71) | ||||
| Pathological stage [n (%)] | 5.85 | 0.054 | - | 0.121 | ||||
| III | 7 (10.14) | 7 (8.97) | 4 (14.29) | 3 (8.57) | ||||
| IVA | 31 (44.93) | 21 (26.92) | 13 (46.43) | 9 (25.71) | ||||
| IVB | 31 (44.93) | 50 (64.10) | 11 (39.29) | 23 (65.71) | ||||
| EGFR mutation [n (%)] | 1.24 | 0.265 | 0.45 | 0.504 | ||||
| 0 | 64 (92.75) | 68 (87.18) | 28 (93.33) | 28 (84.85) | ||||
| 1 | 5 (7.25) | 10 (12.82) | 2 (6.67) | 5 (15.15) | ||||
| PD-L1 [n(%)] | 2.68 | 0.444 | - | 0.294 | ||||
| <1% | 5 (7.25) | 7 (8.97) | 1 (3.57) | 4 (11.43) | ||||
| 1%-49% | 13 (18.84) | 10 (12.82) | 1 (3.57) | 4 (11.43) | ||||
| ≥50% | 20 (28.99) | 17 (21.79) | 8 (28.57) | 5 (14.29) | ||||
| NA | 31 (44.93) | 44 (56.41) | 18 (64.29) | 22 (62.86) | ||||
| LOT [n (%)] | 7.10 | 0.008 | 3.96 | 0.047 | ||||
| First line | 27 (39.13) | 15 (19.23) | 14 (50.00) | 9 (25.71) | ||||
| Second line or more | 42 (60.87) | 63 (80.77) | 14 (50.00) | 26 (74.29) | ||||
| ICIs [n (%)] | 1.50 | 0.221 | 1.16 | 0.282 | ||||
| Anti PD-1 | 55 (79.71) | 68 (87.18) | 21 (75.00) | 30 (85.71) | ||||
| Anti PD-L1 | 14 (20.29) | 10 (12.82) | 7 (25.00) | 5 (14.29) | ||||
表3 真实世界队列患者基线表
Tab.3 Baseline characteristics of the real-world cohort
| Variables | Training group | Testing group | ||||||
|---|---|---|---|---|---|---|---|---|
| R (n=69) | nR (n=78) | t/χ² | P | R (n=28) | nR (n=35) | t/χ² | P | |
| Age (year, Mean±SD) | 60.55±10.48 | 60.46±9.78 | 0.05 | 0.958 | 59.86±9.34 | 60.34±8.72 | -0.21 | 0.832 |
| OS (day, Mean±SD) | 681.16±322.46 | 318.42±302.09 | 6.99 | <0.001 | 719.86±348.41 | 283.91±237.60 | 5.65 | <0.001 |
| PFS (day, Mean±SD) | 515.13±60.73 | 81.87±49.70 | 9.89 | <0.001 | 623.96±340.28 | 89.74±111.86 | 7.97 | <0.001 |
| Gender [n (%)] | 10.55 | 0.001 | 0.56 | 0.456 | ||||
| Male | 65 (94.20) | 58 (74.36) | 23 (82.14) | 26 (74.29) | ||||
| Female | 4 (5.80) | 20 (25.64) | 5 (17.86) | 9 (25.71) | ||||
| ECOG [n (%)] | 0.97 | 0.324 | 3.35 | 0.067 | ||||
| 0-1 | 65 (94.20) | 70 (89.74) | 27 (100.00) | 29 (82.86) | ||||
| ≥2 | 4 (5.80) | 8 (10.26) | 0 (0.00) | 6 (17.14) | ||||
| Smoking status [n (%)] | - | 0.031 | 1.83 | 0.176 | ||||
| Never smoked | 25 (36.23) | 42 (53.85) | 12 (42.86) | 21 (60.00) | ||||
| Current or former smoker | 44 (63.77) | 35 (44.87) | 16 (57.14) | 14 (40.00) | ||||
| Missing | 0 (0.00) | 1 (1.28) | - | - | ||||
| Tumor histologic type [n (%)] | 0.05 | 0.825 | 1.24 | 0.265 | ||||
| LUAD | 52 (75.36) | 60 (76.92) | 24 (85.71) | 26 (74.29) | ||||
| LUSC | 17 (24.64) | 18 (23.08) | 4 (14.29) | 9 (25.71) | ||||
| Pathological stage [n (%)] | 5.85 | 0.054 | - | 0.121 | ||||
| III | 7 (10.14) | 7 (8.97) | 4 (14.29) | 3 (8.57) | ||||
| IVA | 31 (44.93) | 21 (26.92) | 13 (46.43) | 9 (25.71) | ||||
| IVB | 31 (44.93) | 50 (64.10) | 11 (39.29) | 23 (65.71) | ||||
| EGFR mutation [n (%)] | 1.24 | 0.265 | 0.45 | 0.504 | ||||
| 0 | 64 (92.75) | 68 (87.18) | 28 (93.33) | 28 (84.85) | ||||
| 1 | 5 (7.25) | 10 (12.82) | 2 (6.67) | 5 (15.15) | ||||
| PD-L1 [n(%)] | 2.68 | 0.444 | - | 0.294 | ||||
| <1% | 5 (7.25) | 7 (8.97) | 1 (3.57) | 4 (11.43) | ||||
| 1%-49% | 13 (18.84) | 10 (12.82) | 1 (3.57) | 4 (11.43) | ||||
| ≥50% | 20 (28.99) | 17 (21.79) | 8 (28.57) | 5 (14.29) | ||||
| NA | 31 (44.93) | 44 (56.41) | 18 (64.29) | 22 (62.86) | ||||
| LOT [n (%)] | 7.10 | 0.008 | 3.96 | 0.047 | ||||
| First line | 27 (39.13) | 15 (19.23) | 14 (50.00) | 9 (25.71) | ||||
| Second line or more | 42 (60.87) | 63 (80.77) | 14 (50.00) | 26 (74.29) | ||||
| ICIs [n (%)] | 1.50 | 0.221 | 1.16 | 0.282 | ||||
| Anti PD-1 | 55 (79.71) | 68 (87.18) | 21 (75.00) | 30 (85.71) | ||||
| Anti PD-L1 | 14 (20.29) | 10 (12.82) | 7 (25.00) | 5 (14.29) | ||||
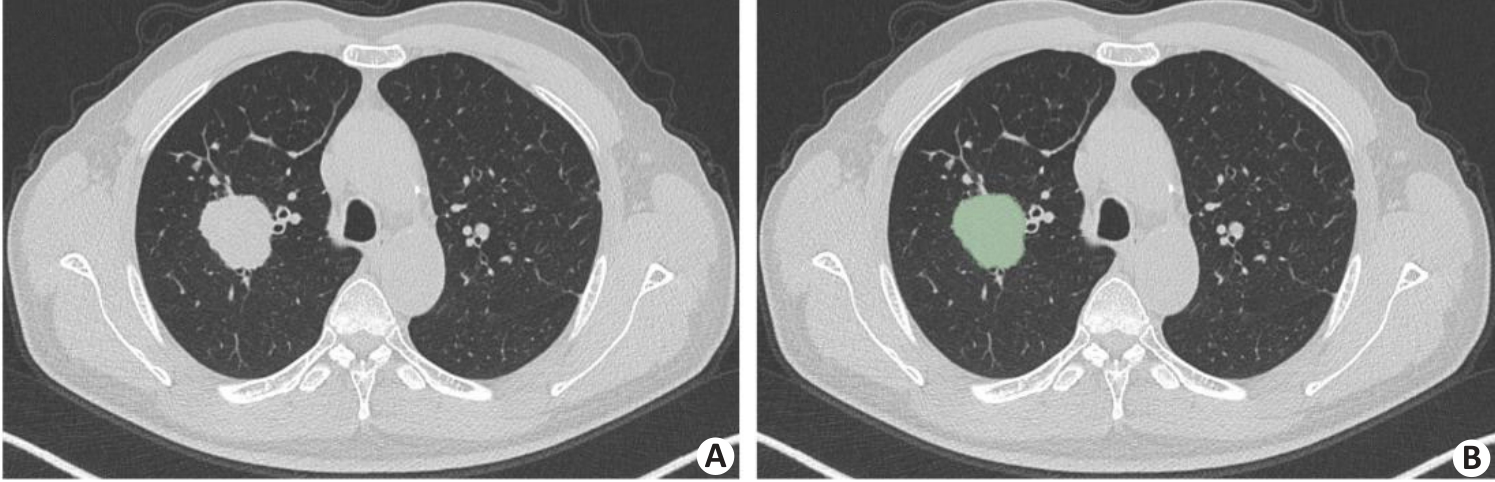
图8 肿瘤分割示例
Fig.8 An example of tumor segmentation. A: Primary tumor lesion in pre-segmentation state. B: Axial image single-layer regions of interest manually outlined using 3D Slicer software.
| Feature | Coefficient |
|---|---|
| Intercept | 0.298 |
| wavelet-HLL-firstorder-Mean | 0.483 |
| wavelet-HHH-gldm-LargeDependenceHighGrayLevelEmphasis | 0.391 |
| wavelet-HHH-glszm-SmallAreaEmphasis | 0.292 |
| wavelet-HHL-gldm-LargeDependenceHighGrayLevelEmphasis | 0.289 |
| wavelet-HHL-firstorder-Kurtosis | 0.936 |
| wavelet-HHL-glszm-SmallAreaLowGrayLevelEmphasis | 0.588 |
| wavelet-LLL-ngtdm-Busyness | 0.390 |
表4 放射组学特征列表及系数
Tab.4 List of radiomics features and coefficients
| Feature | Coefficient |
|---|---|
| Intercept | 0.298 |
| wavelet-HLL-firstorder-Mean | 0.483 |
| wavelet-HHH-gldm-LargeDependenceHighGrayLevelEmphasis | 0.391 |
| wavelet-HHH-glszm-SmallAreaEmphasis | 0.292 |
| wavelet-HHL-gldm-LargeDependenceHighGrayLevelEmphasis | 0.289 |
| wavelet-HHL-firstorder-Kurtosis | 0.936 |
| wavelet-HHL-glszm-SmallAreaLowGrayLevelEmphasis | 0.588 |
| wavelet-LLL-ngtdm-Busyness | 0.390 |
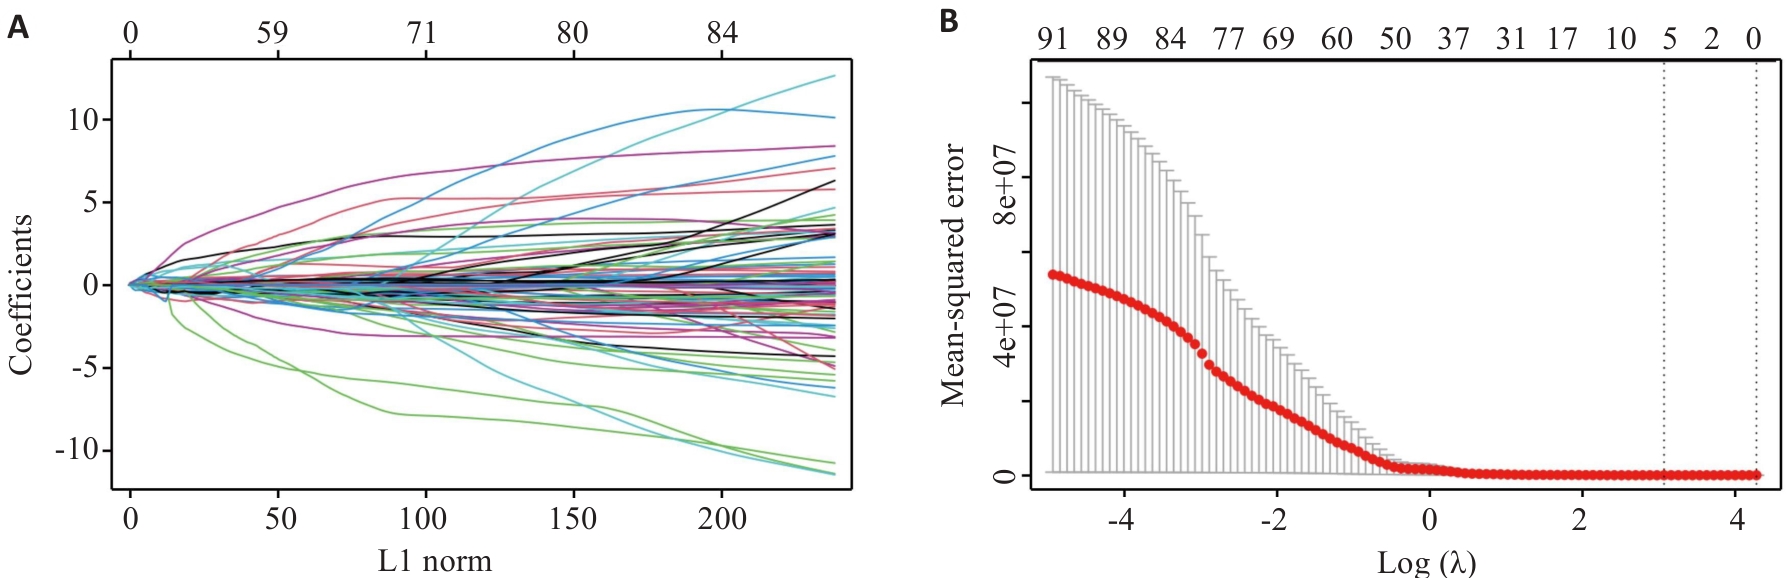
图9 LASSO回归模型筛选出7个影像组学特征
Fig.9 LASSO regression model identifies 7 radiomics features. A: Relationship between L1 norm and model coefficients. B: MSE corresponding to different regularization parameter λ [Log (λ)] during cross-validation.
| Variables | Univariate | Multivariate | ||
|---|---|---|---|---|
| P | OR (95% CI) | P | OR (95% CI) | |
| Age | 0.878 | 1.00 (0.98-1.03) | - | - |
| Gender | 0.003 | 0.29 (0.13-0.65) | 0.137 | 0.48 (0.18-1.26) |
| Smoking status | 0.009 | 2.05 (1.19-3.51) | 0.346 | 1.39 (0.70-2.78) |
| ECOG | 0.028 | 0.35 (0.13-0.89) | 0.164 | 0.41 (0.12-1.43) |
| EGFR mutation | 0.598 | 0.79 (0.34-1.88) | - | - |
| Clinical stage | 0.007 | 0.56 (0.37-0.85) | 0.128 | 0.69 (0.43-1.11) |
| Lines of therapy | 0.002 | 0.67 (0.52-0.86) | 0.438 | 0.89 (0.65-1.20) |
| NLR pre | 0.398 | 0.98 (0.93-1.03) | - | - |
| NLR post | <0.001 | 0.84 (0.76-0.93) | 0.003 | 0.85 (0.77-0.95) |
表5 临床信息经过单因素和多因素logistic回归分析
Tab.5 Clinical information analyzed by univariate and multivariate logistic regression
| Variables | Univariate | Multivariate | ||
|---|---|---|---|---|
| P | OR (95% CI) | P | OR (95% CI) | |
| Age | 0.878 | 1.00 (0.98-1.03) | - | - |
| Gender | 0.003 | 0.29 (0.13-0.65) | 0.137 | 0.48 (0.18-1.26) |
| Smoking status | 0.009 | 2.05 (1.19-3.51) | 0.346 | 1.39 (0.70-2.78) |
| ECOG | 0.028 | 0.35 (0.13-0.89) | 0.164 | 0.41 (0.12-1.43) |
| EGFR mutation | 0.598 | 0.79 (0.34-1.88) | - | - |
| Clinical stage | 0.007 | 0.56 (0.37-0.85) | 0.128 | 0.69 (0.43-1.11) |
| Lines of therapy | 0.002 | 0.67 (0.52-0.86) | 0.438 | 0.89 (0.65-1.20) |
| NLR pre | 0.398 | 0.98 (0.93-1.03) | - | - |
| NLR post | <0.001 | 0.84 (0.76-0.93) | 0.003 | 0.85 (0.77-0.95) |
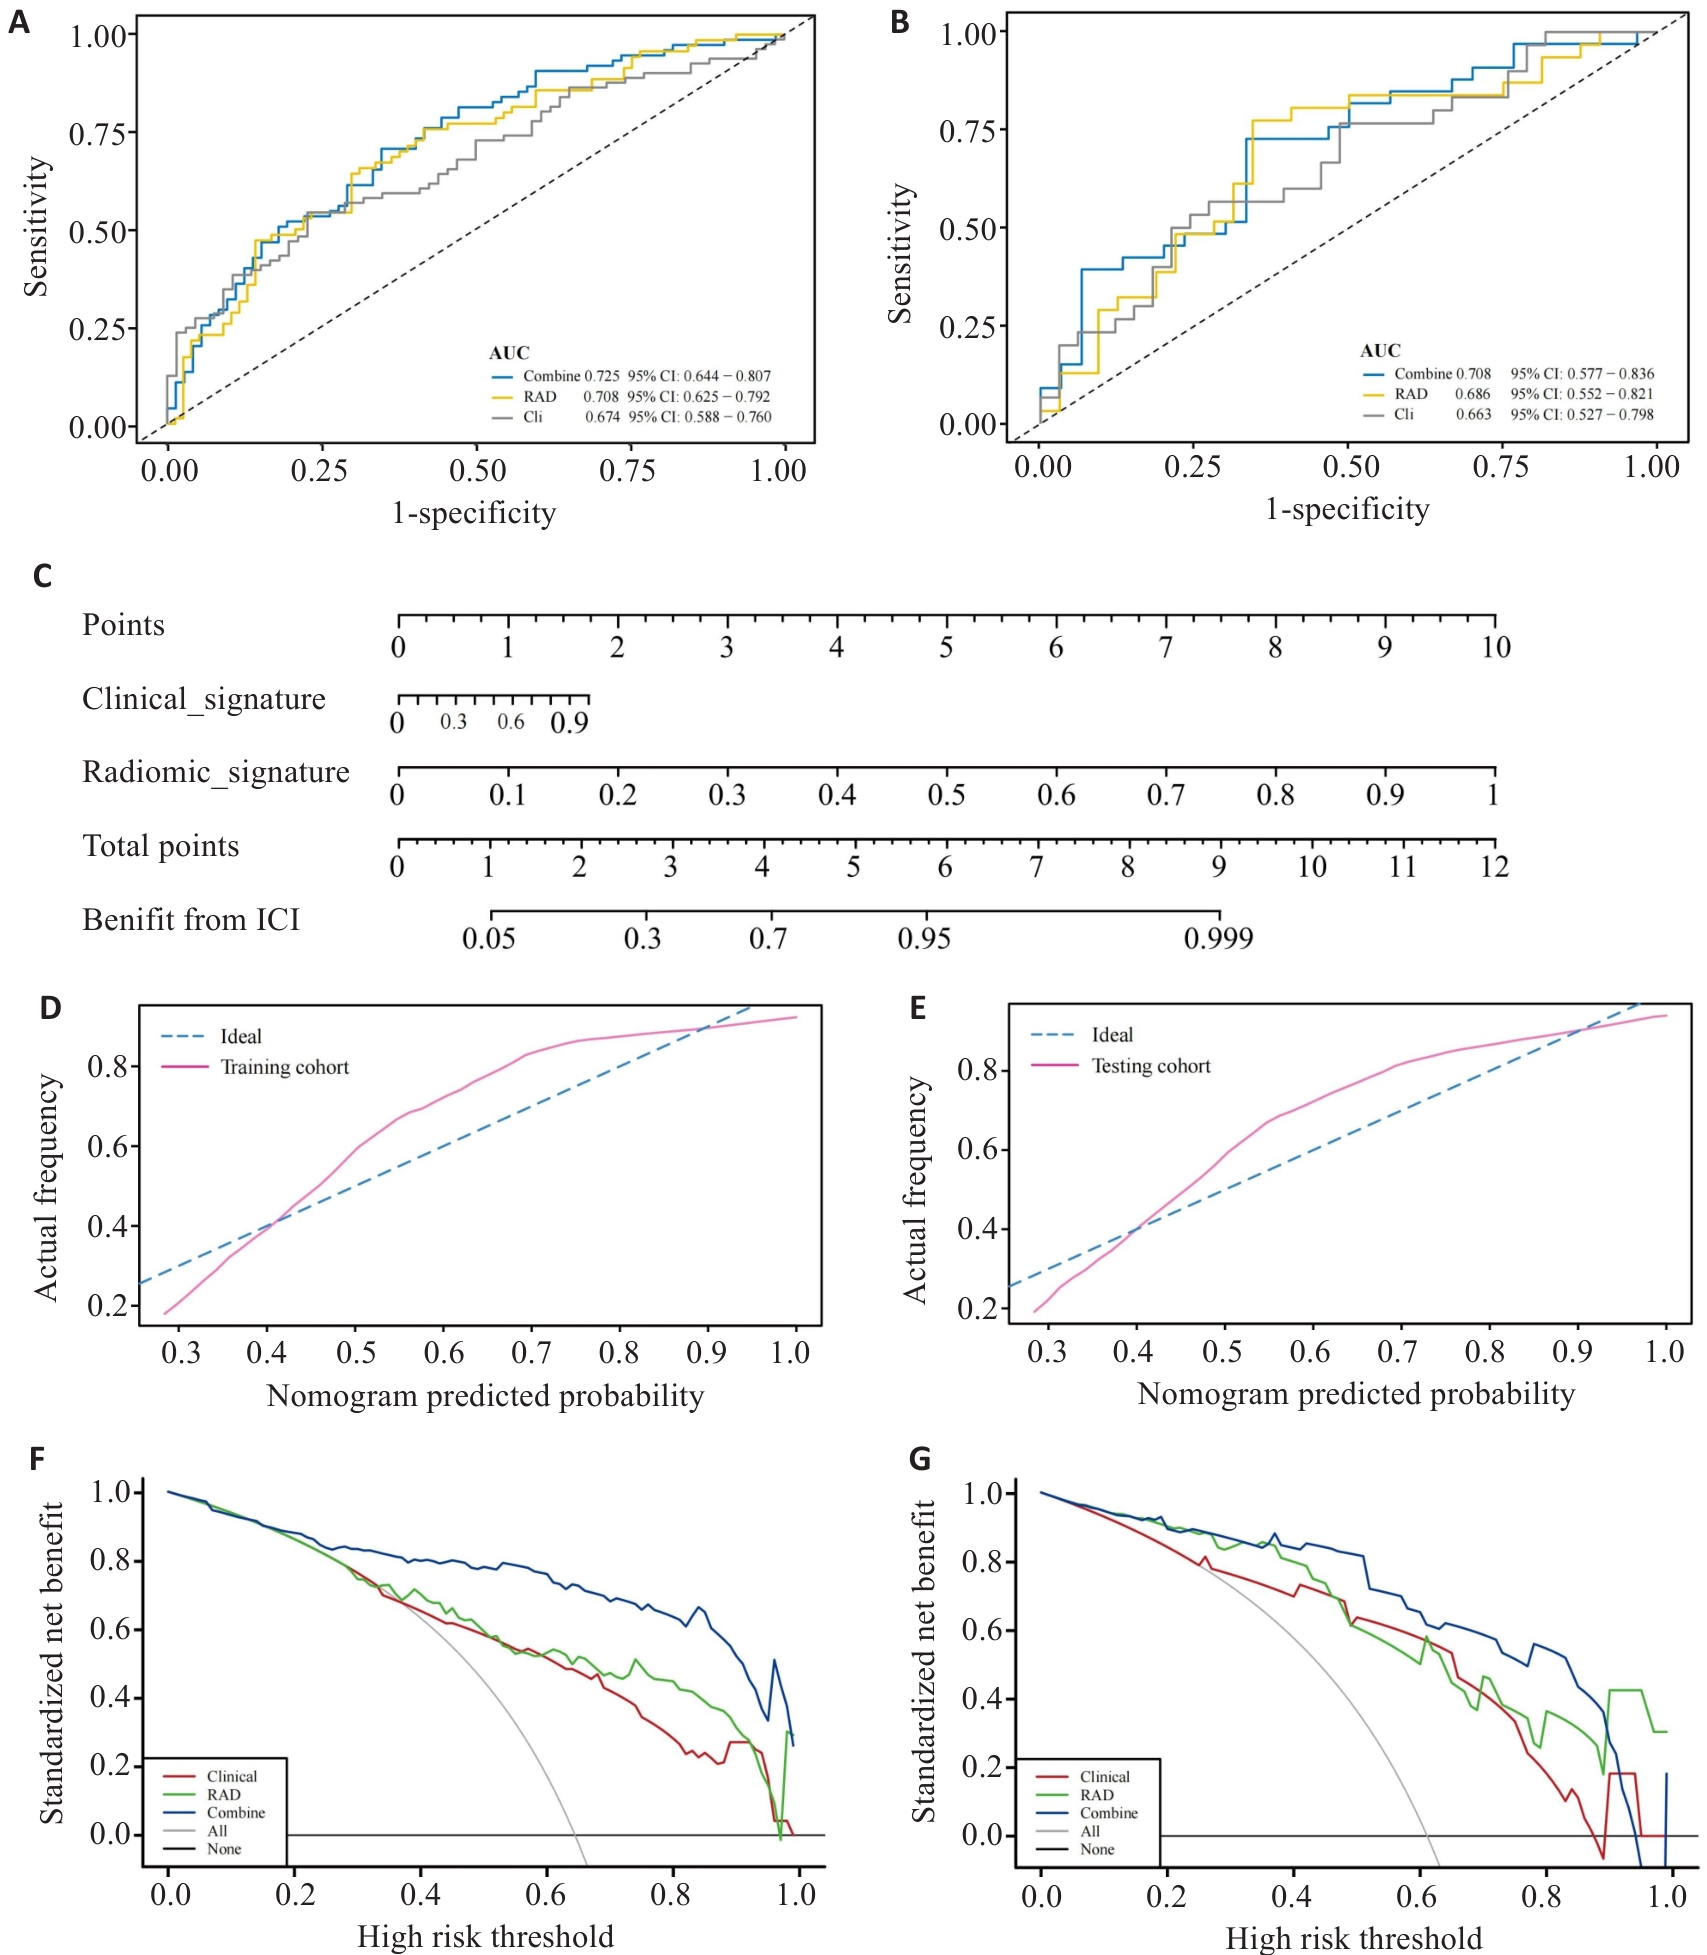
图 10 多模态模型的评估
Fig.10 Evaluation of the multimodal model. A,B: ROC curves of the multimodal model in training group (A) and validation group (B). C: Nomogram for predicting the efficacy of ICIs treatment in aNSCLC. D,E: Calibration curves for the Nomogram in training group (D) and validation group (E). F,G: Decision curve analysis for the multimodal model in training group (F) and validation group (G).
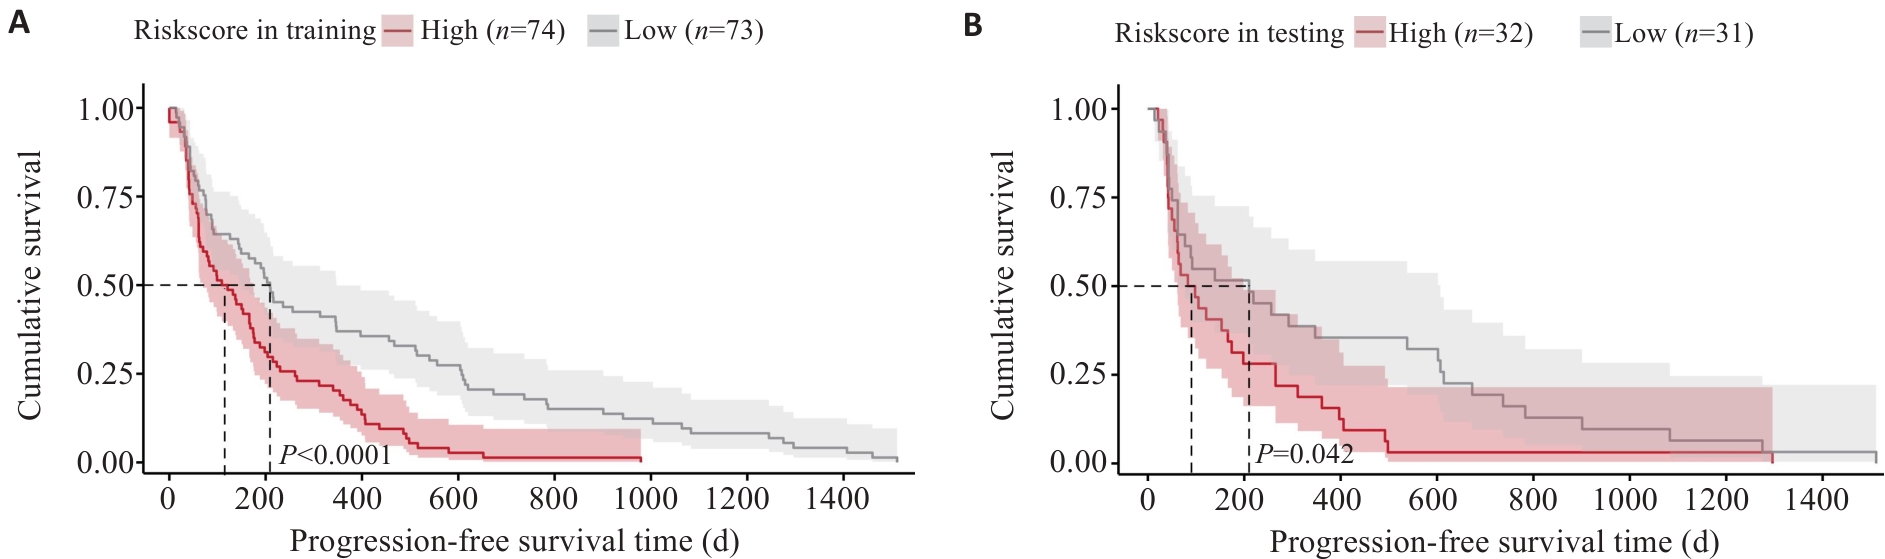
图11 影像模型训练组(A)及验证组(B)的K-M无进展生存期曲线
Fig.11 Kaplan-Meier progression-free survival curve analysis for the radiomics model in the training group (A) and validation group (B).
| [1] | Siegel RL, Giaquinto AN, Jemal A. Cancer statistics, 2024[J]. CA A Cancer J Clinicians, 2024, 74(1): 12-49. doi:10.3322/caac.21820 |
| [2] | Mok TSK, Wu YL, Kudaba I, et al. Pembrolizumab versus chemotherapy for previously untreated, PD-L1-expressing, locally advanced or metastatic non-small-cell lung cancer (KEYNOTE-042): a randomised, open-label, controlled, phase 3 trial[J]. Lancet, 2019, 393(10183): 1819-30. |
| [3] | Wu YL, Zhang L, Fan Y, et al. Randomized clinical trial of pembrolizumab vs chemotherapy for previously untreated Chinese patients with PD-L1-positive locally advanced or metastatic non-small-cell lung cancer: KEYNOTE-042 China Study[J]. Int J Cancer, 2021, 148(9): 2313-20. doi:10.1002/ijc.33399 |
| [4] | Gray J, Rodríguez-Abreu D, Powell SF, et al. FP13.02 pembrolizumab + pemetrexed-platinum vs pemetrexed-platinum for metastatic NSCLC: 4-year follow-up from KEYNOTE-189[J]. J Thorac Oncol, 2021, 16(3): S224. doi:10.1016/j.jtho.2021.01.141 |
| [5] | Robinson AG, Vicente D, Tafreshi A, et al. 97O First-line pembrolizumab plus chemotherapy for patients with advanced squamous NSCLC: 3-year follow-up from KEYNOTE-407[J]. J Thorac Oncol, 2021, 16(4): S748-9. doi:10.1016/s1556-0864(21)01939-0 |
| [6] | André T, Shiu KK, Kim TW, et al. Pembrolizumab in microsatellite-instability-high advanced colorectal cancer[J]. N Engl J Med, 2020, 383(23): 2207-18. doi:10.1056/nejmoa2017699 |
| [7] | Samstein RM, Lee CH, Shoushtari AN, et al. Tumor mutational load predicts survival after immunotherapy across multiple cancer types[J]. Nat Genet, 2019, 51(2): 202-6. doi:10.1038/s41588-018-0312-8 |
| [8] | Kim K, Khang D. Past, present, and future of anticancer nanomedicine[J]. Int J Nanomedicine, 2020, 15: 5719-43. doi:10.2147/ijn.s254774 |
| [9] | Freitas-Dias C, Gonçalves F, Martins F, et al. Interaction between NSCLC cells, CD8+ T-cells and immune checkpoint inhibitors potentiates coagulation and promotes metabolic remodeling-new cues on CAT-VTE[J]. Cells, 2024, 13(4): 305. doi:10.3390/cells13040305 |
| [10] | He BX, Dong D, She YL, et al. Predicting response to immunotherapy in advanced non-small-cell lung cancer using tumor mutational burden radiomic biomarker[J]. J Immunother Cancer, 2020, 8(2): e000550. doi:10.1136/jitc-2020-000550 |
| [11] | Sun R, Limkin EJ, Vakalopoulou M, et al. A radiomics approach to assess tumour-infiltrating CD8 cells and response to anti-PD-1 or anti-PD-L1 immunotherapy: an imaging biomarker, retrospective multicohort study[J]. Lancet Oncol, 2018, 19(9): 1180-91. doi:10.1016/s1470-2045(18)30413-3 |
| [12] | Tomassini S, Falcionelli N, Bruschi G, et al. On-cloud decision-support system for non-small cell lung cancer histology characterization from Thorax computed tomography scans[J]. Comput Med Imaging Graph, 2023, 110: 102310. doi:10.1016/j.compmedimag.2023.102310 |
| [13] | Clark K, Vendt B, Smith K, et al. The cancer imaging archive (TCIA): maintaining and operating a public information repository[J]. J Digit Imag, 2013, 26(6): 1045-57. doi:10.1007/s10278-013-9622-7 |
| [14] | Rizvi NA, Hellmann MD, Snyder A, et al. Cancer immunology. Mutational landscape determines sensitivity to PD-1 blockade in non-small cell lung cancer[J]. Science, 2015, 348(6230): 124-8. doi:10.1126/science.aaa1348 |
| [15] | Leek JT, Johnson WE, Parker HS, et al. The sva package for removing batch effects and other unwanted variation in high-throughput experiments[J]. Bioinformatics, 2012, 28(6): 882-3. doi:10.1093/bioinformatics/bts034 |
| [16] | Langfelder P, Horvath S. WGCNA: an R package for weighted correlation network analysis[J]. BMC Bioinformatics, 2008, 9: 559. doi:10.1186/1471-2105-9-559 |
| [17] | Langfelder P, Horvath S. Fast R functions for robust correlations and hierarchical clustering[J]. J Stat Softw, 2012, 46(11): i11. doi:10.18637/jss.v046.i11 |
| [18] | Liu HW, Zhang W, Zhang YH, et al. Mime: a flexible machine-learning framework to construct and visualize models for clinical characteristics prediction and feature selection[J]. Comput Struct Biotechnol J, 2024, 23: 2798-810. doi:10.1016/j.csbj.2024.06.035 |
| [19] | Wu TZ, Hu EQ, Xu SB, et al. clusterProfiler 4.0: a universal enrichment tool for interpreting omics data[J]. Innovation (Camb), 2021, 2(3): 100141. doi:10.1016/j.xinn.2021.100141 |
| [20] | Hänzelmann S, Castelo R, Guinney J. GSVA gene set variation analysis for microarray and RNA-seq data[J]. BMC Bioinformatics, 2013, 14: 7. doi:10.1186/1471-2105-14-7 |
| [21] | Yoshihara K, Shahmoradgoli M, Martínez E, et al. Inferring tumour purity and stromal and immune cell admixture from expression data[J]. Nat Commun, 2013, 4: 2612. doi:10.1038/ncomms3612 |
| [22] | Jiang P, Gu SQ, Pan D, et al. Signatures of T cell dysfunction and exclusion predict cancer immunotherapy response[J]. Nat Med, 2018, 24(10): 1550-8. doi:10.1038/s41591-018-0136-1 |
| [23] | Vickers AJ, Cronin AM, Elkin EB, et al. Extensions to decision curve analysis, a novel method for evaluating diagnostic tests, prediction models and molecular markers[J]. BMC Med Inform Decis Mak, 2008, 8: 53. doi:10.1186/1472-6947-8-53 |
| [24] | Meng XJ, Huang ZQ, Teng FF, et al. Predictive biomarkers in PD-1/PD-L1 checkpoint blockade immunotherapy[J]. Cancer Treat Rev, 2015, 41(10): 868-76. doi:10.1016/j.ctrv.2015.11.001 |
| [25] | Scholler N, Perbost R, Locke FL, et al. Tumor immune contexture is a determinant of anti-CD19 CAR T cell efficacy in large B cell lymphoma[J]. Nat Med, 2022, 28(9): 1872-82. doi:10.1038/s41591-022-01916-x |
| [26] | Huang YH, Wei LH, Hu YL, et al. Multi-parametric MRI-based radiomics models for predicting molecular subtype and androgen receptor expression in breast cancer[J]. Front Oncol, 2021, 11: 706733. doi:10.3389/fonc.2021.706733 |
| [27] | Wang GZ, Ding FE, Chen KG, et al. CT-based radiomics nomogram to predict proliferative hepatocellular carcinoma and explore the tumor microenvironment[J]. J Transl Med, 2024, 22(1): 683. doi:10.1186/s12967-024-05393-3 |
| [28] | Campesato LF, Barroso-Sousa R, Jimenez L, et al. Comprehensive cancer-gene panels can be used to estimate mutational load and predict clinical benefit to PD-1 blockade in clinical practice[J]. Oncotarget, 2015, 6(33): 34221-7. doi:10.18632/oncotarget.5950 |
| [29] | Zhou ZH, Guo WJ, Liu DQ, et al. Multiparameter prediction model of immune checkpoint inhibitors combined with chemotherapy for non-small cell lung cancer based on support vector machine learning[J]. Sci Rep, 2023, 13(1): 4469. doi:10.1038/s41598-023-31189-4 |
| [30] | Yang B, Zhou L, Zhong J, et al. Combination of computed tomography imaging-based radiomics and clinicopathological characteristics for predicting the clinical benefits of immune checkpoint inhibitors in lung cancer[J]. Respir Res, 2021, 22(1): 189. doi:10.1186/s12931-021-01780-2 |
| [31] | Liu YP, Jiao Y, He D, et al. Deriving time-varying cellular motility parameters via wavelet analysis[J]. Phys Biol, 2021, 18(4): 046007. doi:10.1088/1478-3975/abfcad |
| [32] | McNamara MG, Templeton AJ, Maganti M, et al. Neutrophil/lymphocyte ratio as a prognostic factor in biliary tract cancer[J]. Eur J Cancer, 2014, 50(9): 1581-9. doi:10.1016/j.ejca.2014.02.015 |
| [33] | Viers BR, Boorjian SA, Frank I, et al. Pretreatment neutrophil-to-lymphocyte ratio is associated with advanced pathologic tumor stage and increased cancer-specific mortality among patients with urothelial carcinoma of the bladder undergoing radical cystectomy[J]. Eur Urol, 2014, 66(6): 1157-64. doi:10.1016/j.eururo.2014.02.042 |
| [34] | Valero C, Lee M, Hoen D, et al. Pretreatment neutrophil-to-lymphocyte ratio and mutational burden as biomarkers of tumor response to immune checkpoint inhibitors[J]. Nat Commun, 2021, 12(1): 729. doi:10.1038/s41467-021-20935-9 |
| [35] | Bryant AK, Sankar K, Strohbehn GW, et al. Prognostic and predictive value of neutrophil-to-lymphocyte ratio with adjuvant immunotherapy in stage III non-small-cell lung cancer[J]. Lung Cancer, 2022, 163: 35-41. doi:10.1016/j.lungcan.2021.11.021 |
| [1] | 陈子贤, 周家伟, 谭磊, 黄志鹏, 薛康颐, 陈明坤. 基于免疫抑制性Neu_2中性粒细胞亚群模型精准预测前列腺癌生存预后及免疫治疗应答[J]. 南方医科大学学报, 2025, 45(8): 1643-1653. |
| [2] | 何丽君, 陈晓菲, 闫陈昕, 师林. 扶正化积汤治疗非小细胞肺癌的分子机制:基于网络药理学及体外实验验证[J]. 南方医科大学学报, 2025, 45(6): 1143-1152. |
| [3] | 李丹丹, 楚佳鑫, 闫妍, 徐文隽, 朱行春, 孙韵, 丁浩峰, 任丽, 朱博. 姜黄素通过下调HIF-1α通路抑制非小细胞肺癌脂质代谢[J]. 南方医科大学学报, 2025, 45(5): 1039-1046. |
| [4] | 郭晓娟, 杜瑞娟, 陈丽平, 郭克磊, 周彪, 卞华, 韩立. WW结构域E3泛素连接酶1调控卵巢癌肿瘤微环境中的免疫浸润[J]. 南方医科大学学报, 2025, 45(5): 1063-1073. |
| [5] | 陈梅妹, 王洋, 雷黄伟, 张斐, 黄睿娜, 杨朝阳. 基于多种机器学习算法和语音情绪特征的阈下抑郁辨识模型构建[J]. 南方医科大学学报, 2025, 45(4): 711-717. |
| [6] | 钟娜, 王会杰, 赵文英, 孙珍贵, 耿彪. 高表达RNF7增强非小细胞肺癌细胞的PD-1耐药:基于活化NF-kB通路促进CXCL1表达和髓源性抑制细胞的募集[J]. 南方医科大学学报, 2024, 44(9): 1704-1711. |
| [7] | 陈莉莉, 吴天宇, 张铭, 丁子夏, 张妍, 杨依清, 郑佳倩, 张小楠. 类风湿关节炎的潜在生物标志物及其免疫调控机制:基于GEO数据库[J]. 南方医科大学学报, 2024, 44(6): 1098-1108. |
| [8] | 申采玉, 王帅, 周锐盈, 汪雨贺, 高琴, 陈兴智, 杨枢. 慢性心力衰竭合并肺部感染患者院内死亡风险预测:基于可解释性机器学习方法[J]. 南方医科大学学报, 2024, 44(6): 1141-1148. |
| [9] | 李菲凡, 向俊馨, 刘佳慧, 王效静, 江浩. LncRNA FEZF1-AS1通过miR-130a-5p/CCND1轴促进非小细胞肺癌发展的分子机制研究[J]. 南方医科大学学报, 2024, 44(5): 841-850. |
| [10] | 左志威, 孟庆良, 崔家康, 郭克磊, 卞华. 基于硬皮病线粒体相关基因的人工神经网络模型的构建[J]. 南方医科大学学报, 2024, 44(5): 920-929. |
| [11] | 邵 珊, 白薇超, 邹鹏程, 罗敏娜, 赵新汉, 雷建军. 二甲双胍阻断乳腺癌细胞-间质细胞的交互作用:基于抑制肿瘤相关成纤维细胞缺氧诱导因子-1α的表达[J]. 南方医科大学学报, 2024, 44(3): 428-436. |
| [12] | 韩齐齐, 叶梦然, 金齐力. 去甲泽拉木醛通过抑制 AKT/CREB 信号通路抑制非小细胞肺癌细胞的增殖、迁移和侵袭[J]. 南方医科大学学报, 2024, 44(2): 280-288. |
| [13] | 刘云泽, 李宬润, 郭俊唐, 刘 阳. 基于临床-影像组学列线图模型鉴别局灶性机化性肺炎与肺腺癌[J]. 南方医科大学学报, 2024, 44(2): 397-404. |
| [14] | 刘雪柔, 杨玉梅, 刘伟, 张振, 周星琦, 谢文宇, 申林, 张梦晓, 李娴, 臧家兰, 李姗姗. 中药泽漆抑制非小细胞肺癌细胞增殖、侵袭、迁移以及促进细胞凋亡[J]. 南方医科大学学报, 2024, 44(10): 1918-1925. |
| [15] | 杨玉梅, 刘雪柔, 刘伟, 周星琦, 张振, 胡妍, 刘培培, 李娴, 刘浩, 李姗姗. 阿美替尼联合安罗替尼通过下调PI3K/AKT通路抑制非小细胞肺癌细胞的增殖[J]. 南方医科大学学报, 2024, 44(10): 1965-1975. |
| 阅读次数 | ||||||
|
全文 |
|
|||||
|
摘要 |
|
|||||