Journal of Southern Medical University ›› 2024, Vol. 44 ›› Issue (5): 827-840.doi: 10.12122/j.issn.1673-4254.2024.05.04
• Clinical Research • Previous Articles Next Articles
Pengcheng LIU( ), Lijuan LOU, Xia LIU, Jian WANG, Ying JIANG()
Received:2024-03-10
Online:2024-05-20
Published:2024-06-04
Contact:
Ying JIANG
E-mail:pc18782995020@163.com;jiangying@ncpsb.org.cn
Supported by:Pengcheng LIU, Lijuan LOU, Xia LIU, Jian WANG, Ying JIANG. A risk scoring model based on M2 macrophage-related genes for predicting prognosis of HBV-related hepatocellular carcinoma[J]. Journal of Southern Medical University, 2024, 44(5): 827-840.
Add to citation manager EndNote|Ris|BibTeX
URL: https://www.j-smu.com/EN/10.12122/j.issn.1673-4254.2024.05.04
| Item | Overall | GSE10140 | TCGA-LIHC |
|---|---|---|---|
| n | 155 | 82 | 73 |
| Futime (median [IQR]) | 1613.00 [630.50, 2871.75] | 2854.00 [1368.00, 3662.50] | 682.50 [437.00, 1632.50] |
| Fustat =1 [n (%)] | 48 (30.9) | 32 (39.0) | 16 (21.9) |
| EGF [n (%)] | |||
| High | 9 (5.8) | 9 (11.0) | 0 (0.0) |
| Low | 73 (47.1) | 73 (89.0) | 0 (0.0) |
| NA | 73 (47.1) | 0 (0.0) | 73 (100.0) |
| Age (year, median [IQR]) | 52.00 [46.00, 62.75] | NA [NA, NA] | 52.00 [46.00, 62.75] |
| Gender [n (%)] | |||
| Female | 15 (9.7) | 0 (0.0) | 15 (20.5) |
| Male | 58 (37.4) | 0 (0.0) | 58 (79.5) |
| NA | 82 (52.9) | 82 (100.0) | 0 (0.0) |
| Grade (%) | |||
| G1 | 6 (3.8) | 0 (0.0) | 6 (8.2) |
| G2 | 27 (17.4) | 0 (0.0) | 27 (37.0) |
| G3 | 34 (21.9) | 0 (0.0) | 34 (46.6) |
| G4 | 6 (3.9) | 0 (0.0) | 6 (8.2) |
| NA | 82 (52.9) | 82 (100.0) | 0 (0.0) |
| Stage [n (%)] | |||
| Stage I | 49 (31.6) | 0 (0.0) | 49 (67.1) |
| Stage II | 15 (9.8) | 0 (0.0) | 15 (20.5) |
| Stage III | 5 (3.2) | 0 (0.0) | 5 (6.8) |
| Stage IV | 1 (0.6) | 0 (0.0) | 1 (1.4) |
| Unknow | 3 (1.8) | 0 (0.0) | 3 (4.2) |
| NA | 82 (52.9) | 82 (100.0) | 0 |
| T stage [n (%)] | |||
| T1 | 52(33.5) | 0 (0.0) | 52 (71.3) |
| T2 | 15 (9.8) | 0 (0.0) | 15 (20.5) |
| T3 | 5 (3.2) | 0 (0.0) | 5 (6.8) |
| T4 | 1 (0.6) | 0 (0.0) | 1 (1.4) |
| NA | 82 (52.9) | 82 (100.0) | 0 (0.0) |
| Metastasis [n (%)] | |||
| M0 | 70 (45.3) | 0 (0.0) | 70 (95.8) |
| M1 | 2 (1.2) | 0 (0.0) | 2 (2.8) |
| MX | 1 (0.6) | 0 (0.0) | 1 (1.4) |
| NA | 82 (52.9) | 82 (100.0) | 0 (0.0) |
| Nodes [n (%)] | |||
| N0 | 70 (45.3) | 0 (0.0) | 70 (95.8) |
| NX | 3 (1.8) | 0 (0.0) | 3 (4.2) |
| NA | 82 (52.9) | 82 (100.0) | 0 (0.0) |
Tab.1 Baseline characteristics of HCC patients in TCGA dataset and GEO dataset
| Item | Overall | GSE10140 | TCGA-LIHC |
|---|---|---|---|
| n | 155 | 82 | 73 |
| Futime (median [IQR]) | 1613.00 [630.50, 2871.75] | 2854.00 [1368.00, 3662.50] | 682.50 [437.00, 1632.50] |
| Fustat =1 [n (%)] | 48 (30.9) | 32 (39.0) | 16 (21.9) |
| EGF [n (%)] | |||
| High | 9 (5.8) | 9 (11.0) | 0 (0.0) |
| Low | 73 (47.1) | 73 (89.0) | 0 (0.0) |
| NA | 73 (47.1) | 0 (0.0) | 73 (100.0) |
| Age (year, median [IQR]) | 52.00 [46.00, 62.75] | NA [NA, NA] | 52.00 [46.00, 62.75] |
| Gender [n (%)] | |||
| Female | 15 (9.7) | 0 (0.0) | 15 (20.5) |
| Male | 58 (37.4) | 0 (0.0) | 58 (79.5) |
| NA | 82 (52.9) | 82 (100.0) | 0 (0.0) |
| Grade (%) | |||
| G1 | 6 (3.8) | 0 (0.0) | 6 (8.2) |
| G2 | 27 (17.4) | 0 (0.0) | 27 (37.0) |
| G3 | 34 (21.9) | 0 (0.0) | 34 (46.6) |
| G4 | 6 (3.9) | 0 (0.0) | 6 (8.2) |
| NA | 82 (52.9) | 82 (100.0) | 0 (0.0) |
| Stage [n (%)] | |||
| Stage I | 49 (31.6) | 0 (0.0) | 49 (67.1) |
| Stage II | 15 (9.8) | 0 (0.0) | 15 (20.5) |
| Stage III | 5 (3.2) | 0 (0.0) | 5 (6.8) |
| Stage IV | 1 (0.6) | 0 (0.0) | 1 (1.4) |
| Unknow | 3 (1.8) | 0 (0.0) | 3 (4.2) |
| NA | 82 (52.9) | 82 (100.0) | 0 |
| T stage [n (%)] | |||
| T1 | 52(33.5) | 0 (0.0) | 52 (71.3) |
| T2 | 15 (9.8) | 0 (0.0) | 15 (20.5) |
| T3 | 5 (3.2) | 0 (0.0) | 5 (6.8) |
| T4 | 1 (0.6) | 0 (0.0) | 1 (1.4) |
| NA | 82 (52.9) | 82 (100.0) | 0 (0.0) |
| Metastasis [n (%)] | |||
| M0 | 70 (45.3) | 0 (0.0) | 70 (95.8) |
| M1 | 2 (1.2) | 0 (0.0) | 2 (2.8) |
| MX | 1 (0.6) | 0 (0.0) | 1 (1.4) |
| NA | 82 (52.9) | 82 (100.0) | 0 (0.0) |
| Nodes [n (%)] | |||
| N0 | 70 (45.3) | 0 (0.0) | 70 (95.8) |
| NX | 3 (1.8) | 0 (0.0) | 3 (4.2) |
| NA | 82 (52.9) | 82 (100.0) | 0 (0.0) |
| MRG | Forword primer (5'-3') | Reverse primer (5'-3') |
|---|---|---|
| GAPDH | AGATCCCTCCAAAATCAAGTGG | GGCAGAGATGATGACCCTTTT |
| VTN | AAGCCCCAAGTGACTCGC | TTTTCTCCTCGCCATCGTCA |
| GCLC | ACTTCATTTCCCAGTACCTTAACA | GCAGCACTCAAAGCCATAACA |
| GMPR | GGGCCACATCATCTCTGATGGA | TCAGTCCCCCGAGAATATCCAG |
| PARVB | GGTTCACTTCTCCCTGGCTC | CGCTCCTCGTTCTCCTCAAG |
| TRIM27 | AGCATGAGTATCGCCTCCTG | CTGATTCTTTCAGCCCTGCTC |
Tab.2 RT-qPCR primer sequences
| MRG | Forword primer (5'-3') | Reverse primer (5'-3') |
|---|---|---|
| GAPDH | AGATCCCTCCAAAATCAAGTGG | GGCAGAGATGATGACCCTTTT |
| VTN | AAGCCCCAAGTGACTCGC | TTTTCTCCTCGCCATCGTCA |
| GCLC | ACTTCATTTCCCAGTACCTTAACA | GCAGCACTCAAAGCCATAACA |
| GMPR | GGGCCACATCATCTCTGATGGA | TCAGTCCCCCGAGAATATCCAG |
| PARVB | GGTTCACTTCTCCCTGGCTC | CGCTCCTCGTTCTCCTCAAG |
| TRIM27 | AGCATGAGTATCGCCTCCTG | CTGATTCTTTCAGCCCTGCTC |
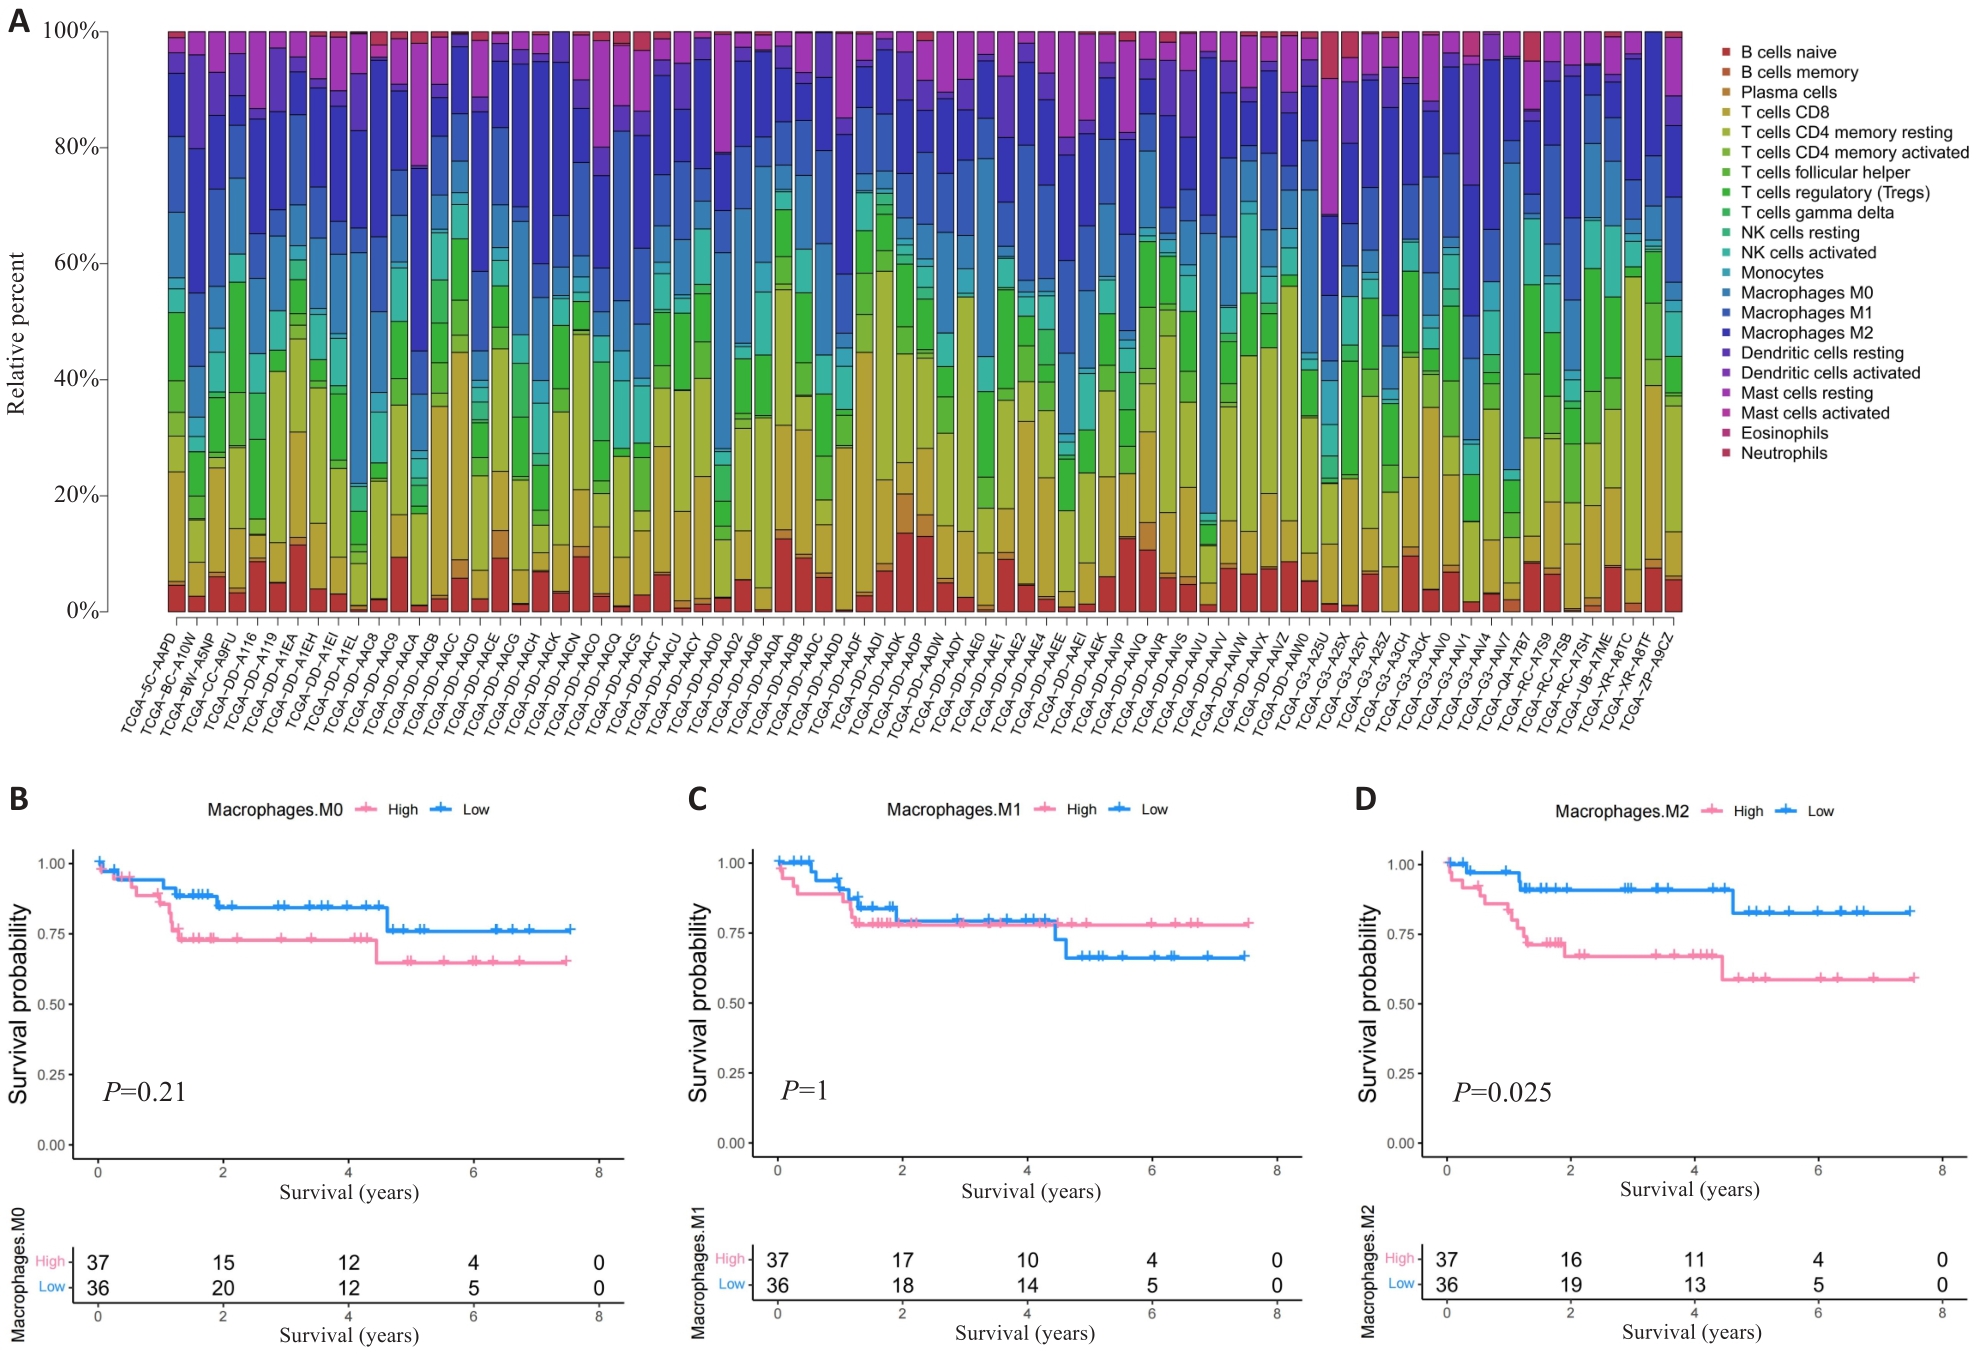
Fig.1 HCC patients with high M2 macrophage infiltration level have poor prognosis. A: Proportion of immune cells in HBV-related HCC patients. B-D: Prognosis of patients stratified by the number of M0 macrophage (B), M1 macrophage (C) and M2 macrophage (D).
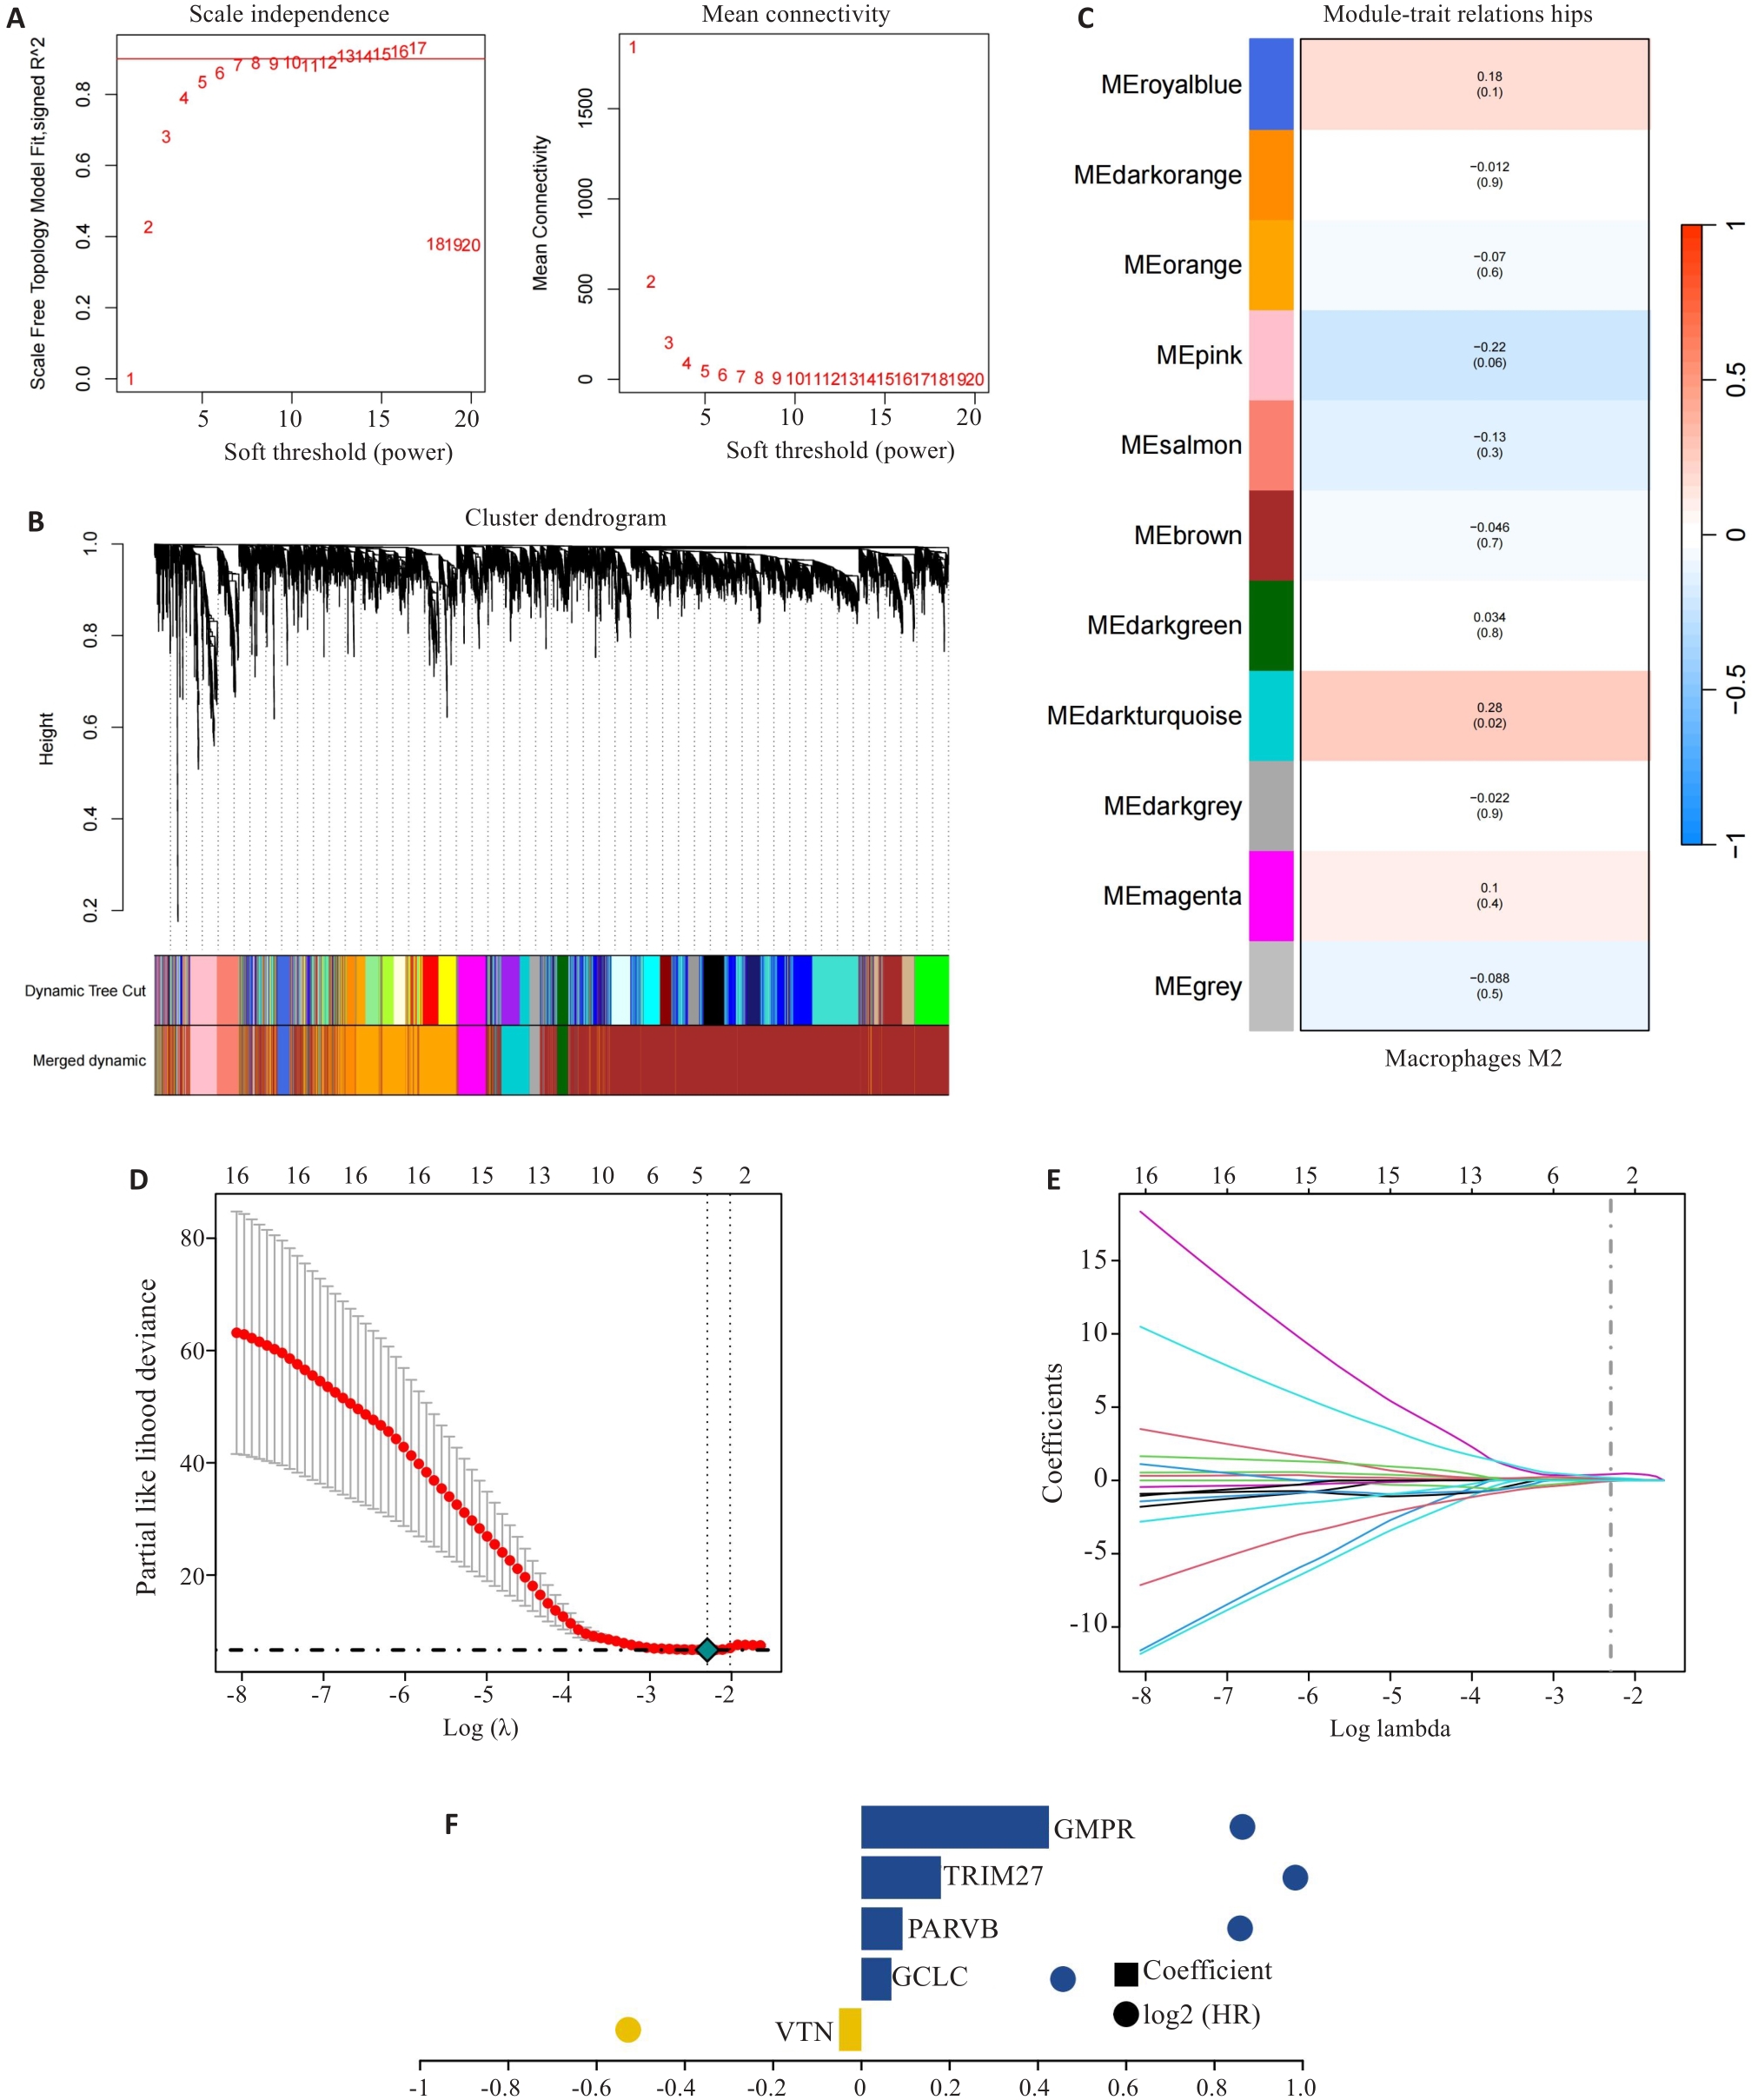
Fig.2 Construction of prognostic risk scoring model. A-C: Identification of M2 macrophage-related gene (MRG) modules by WGCNA. D-F: Five hub MRGs (VTN, GCLC, PARVB, TRIM27 and GMPR) identified by LASSO regression analysis for constructing the risk scoring model.
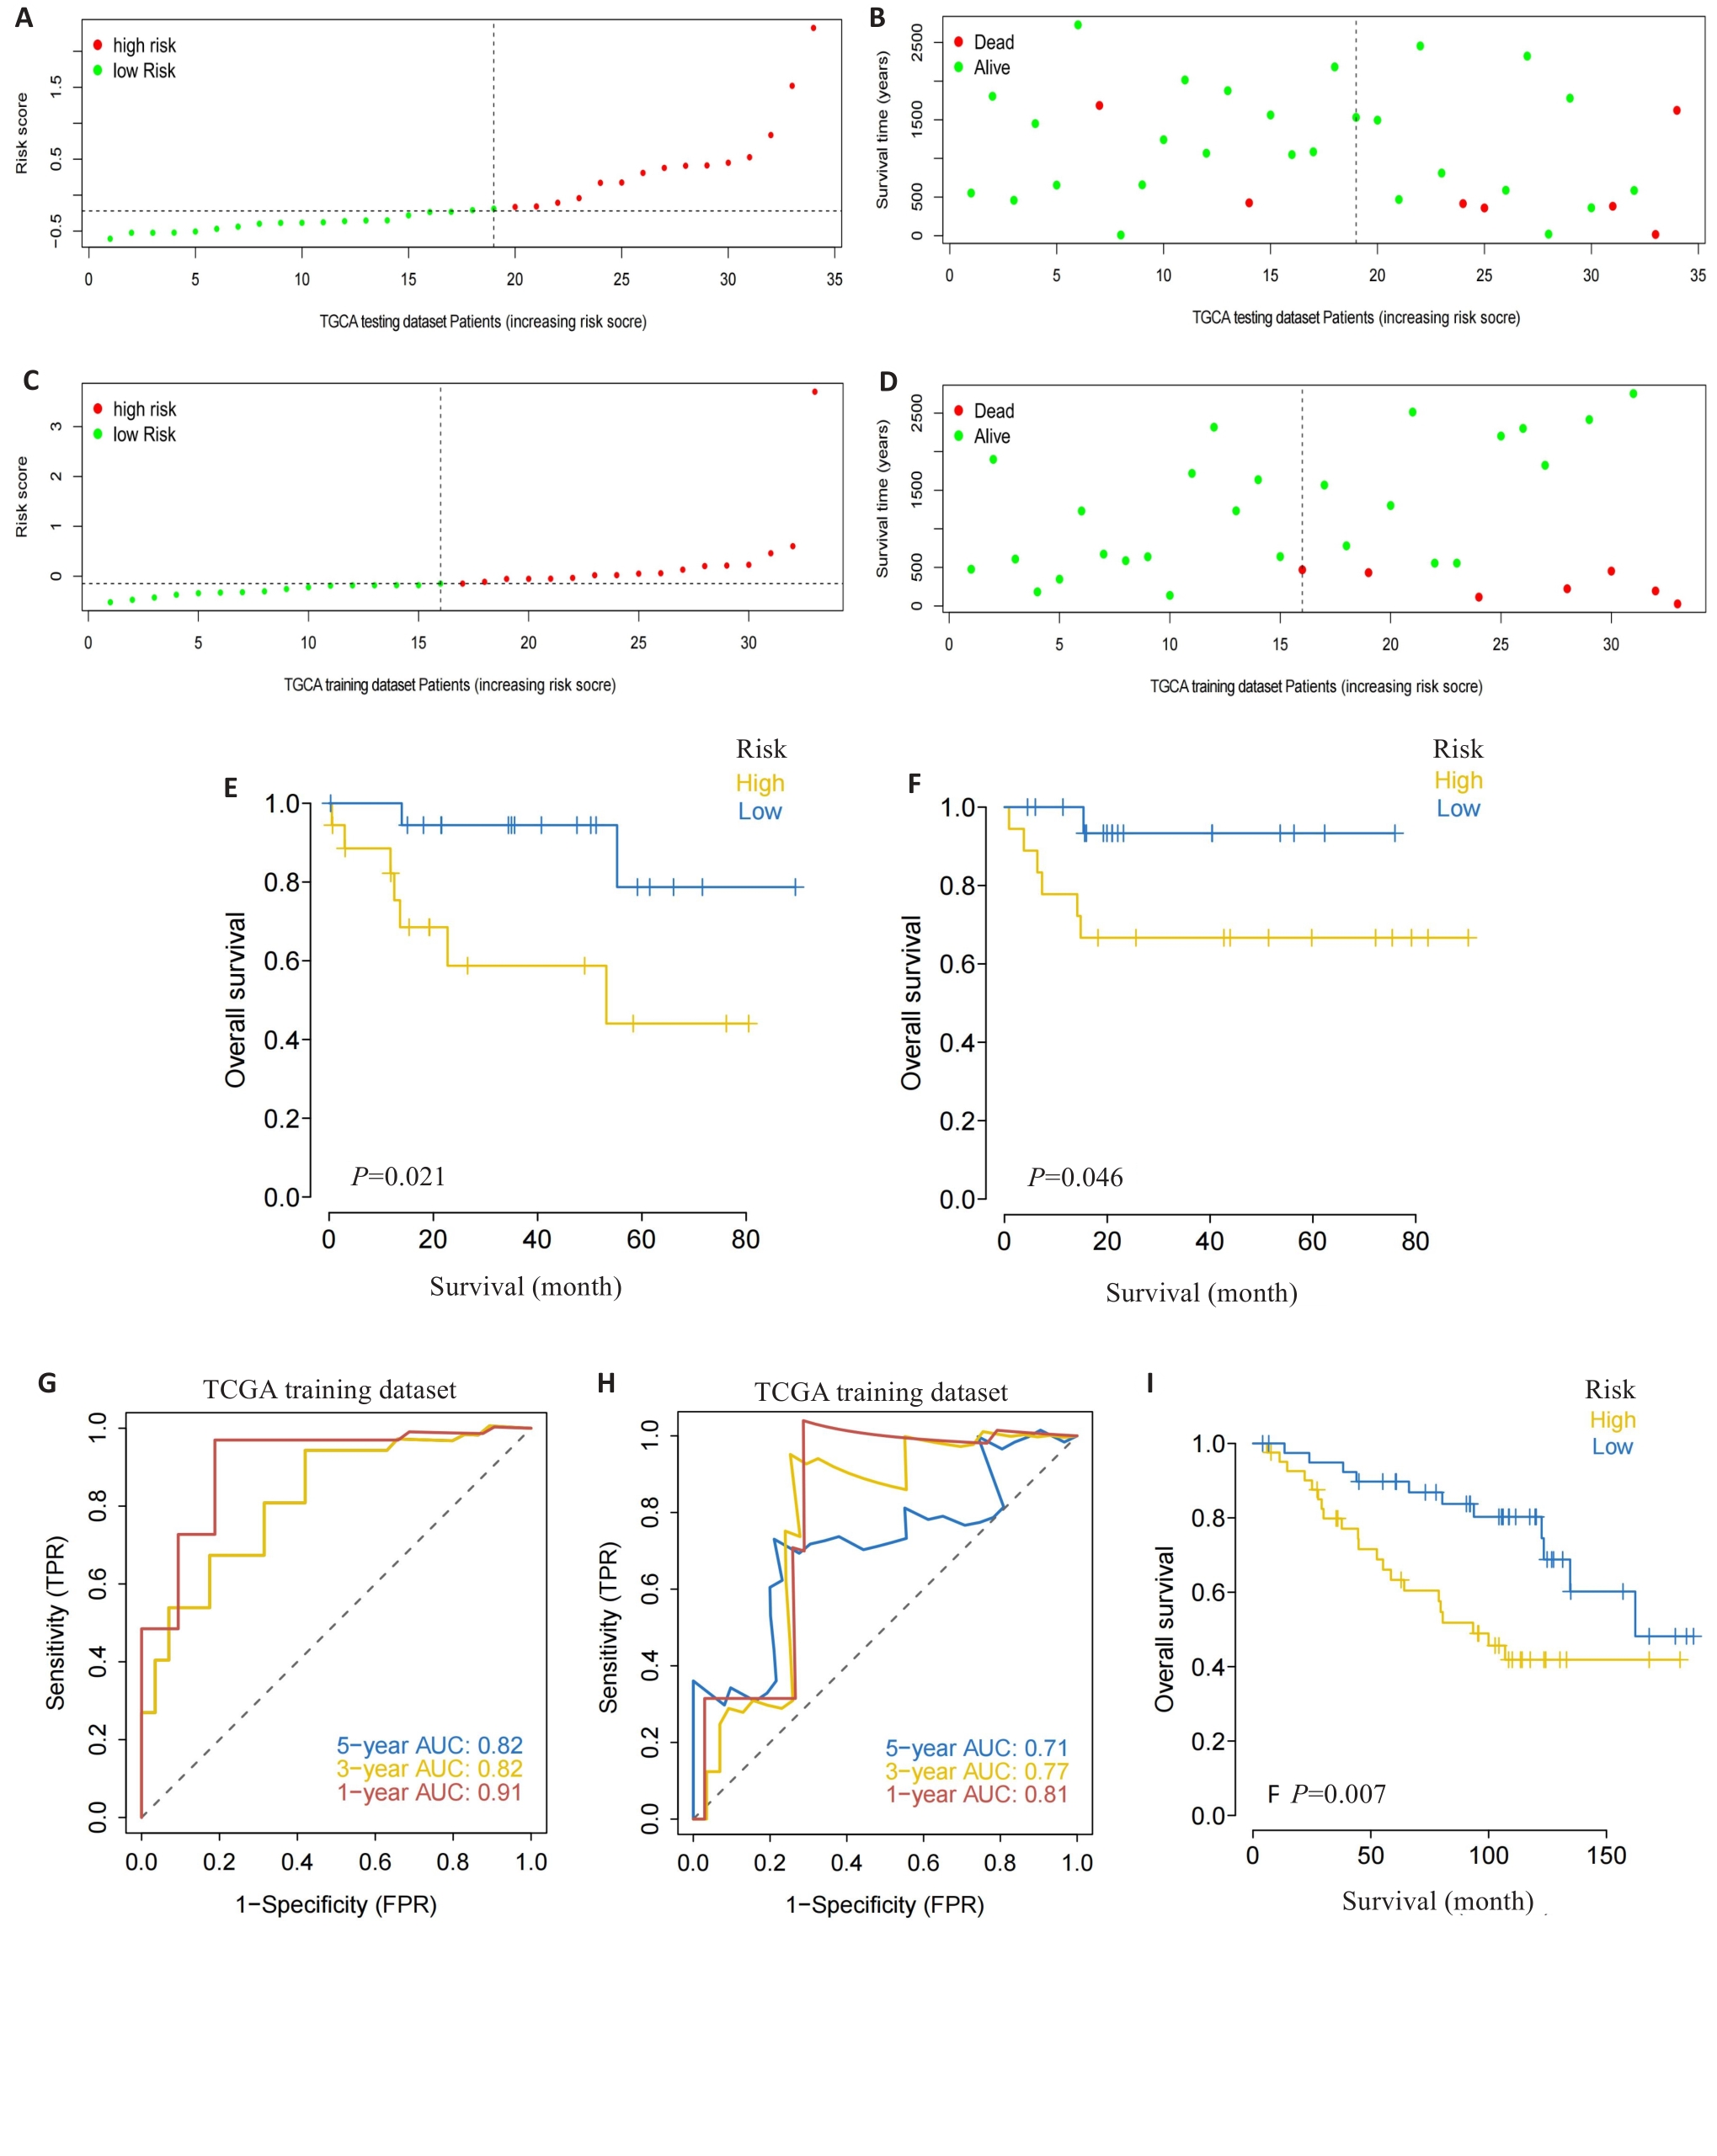
Fig.3 Validation of the risk scoring model. A-D: Different patterns of survival status and survival time between the high-risk group (A, B) and low-risk group (C, D). E, F: Validation of the MRG prognostic model in the training dataset (E) and testing dataset (F). G, H: ROC curves of the risk score for predicting overall survival (OS) in the training dataset (G) and testing dataset (H). I: Validation of the MRG prognostic model using the external dataset.
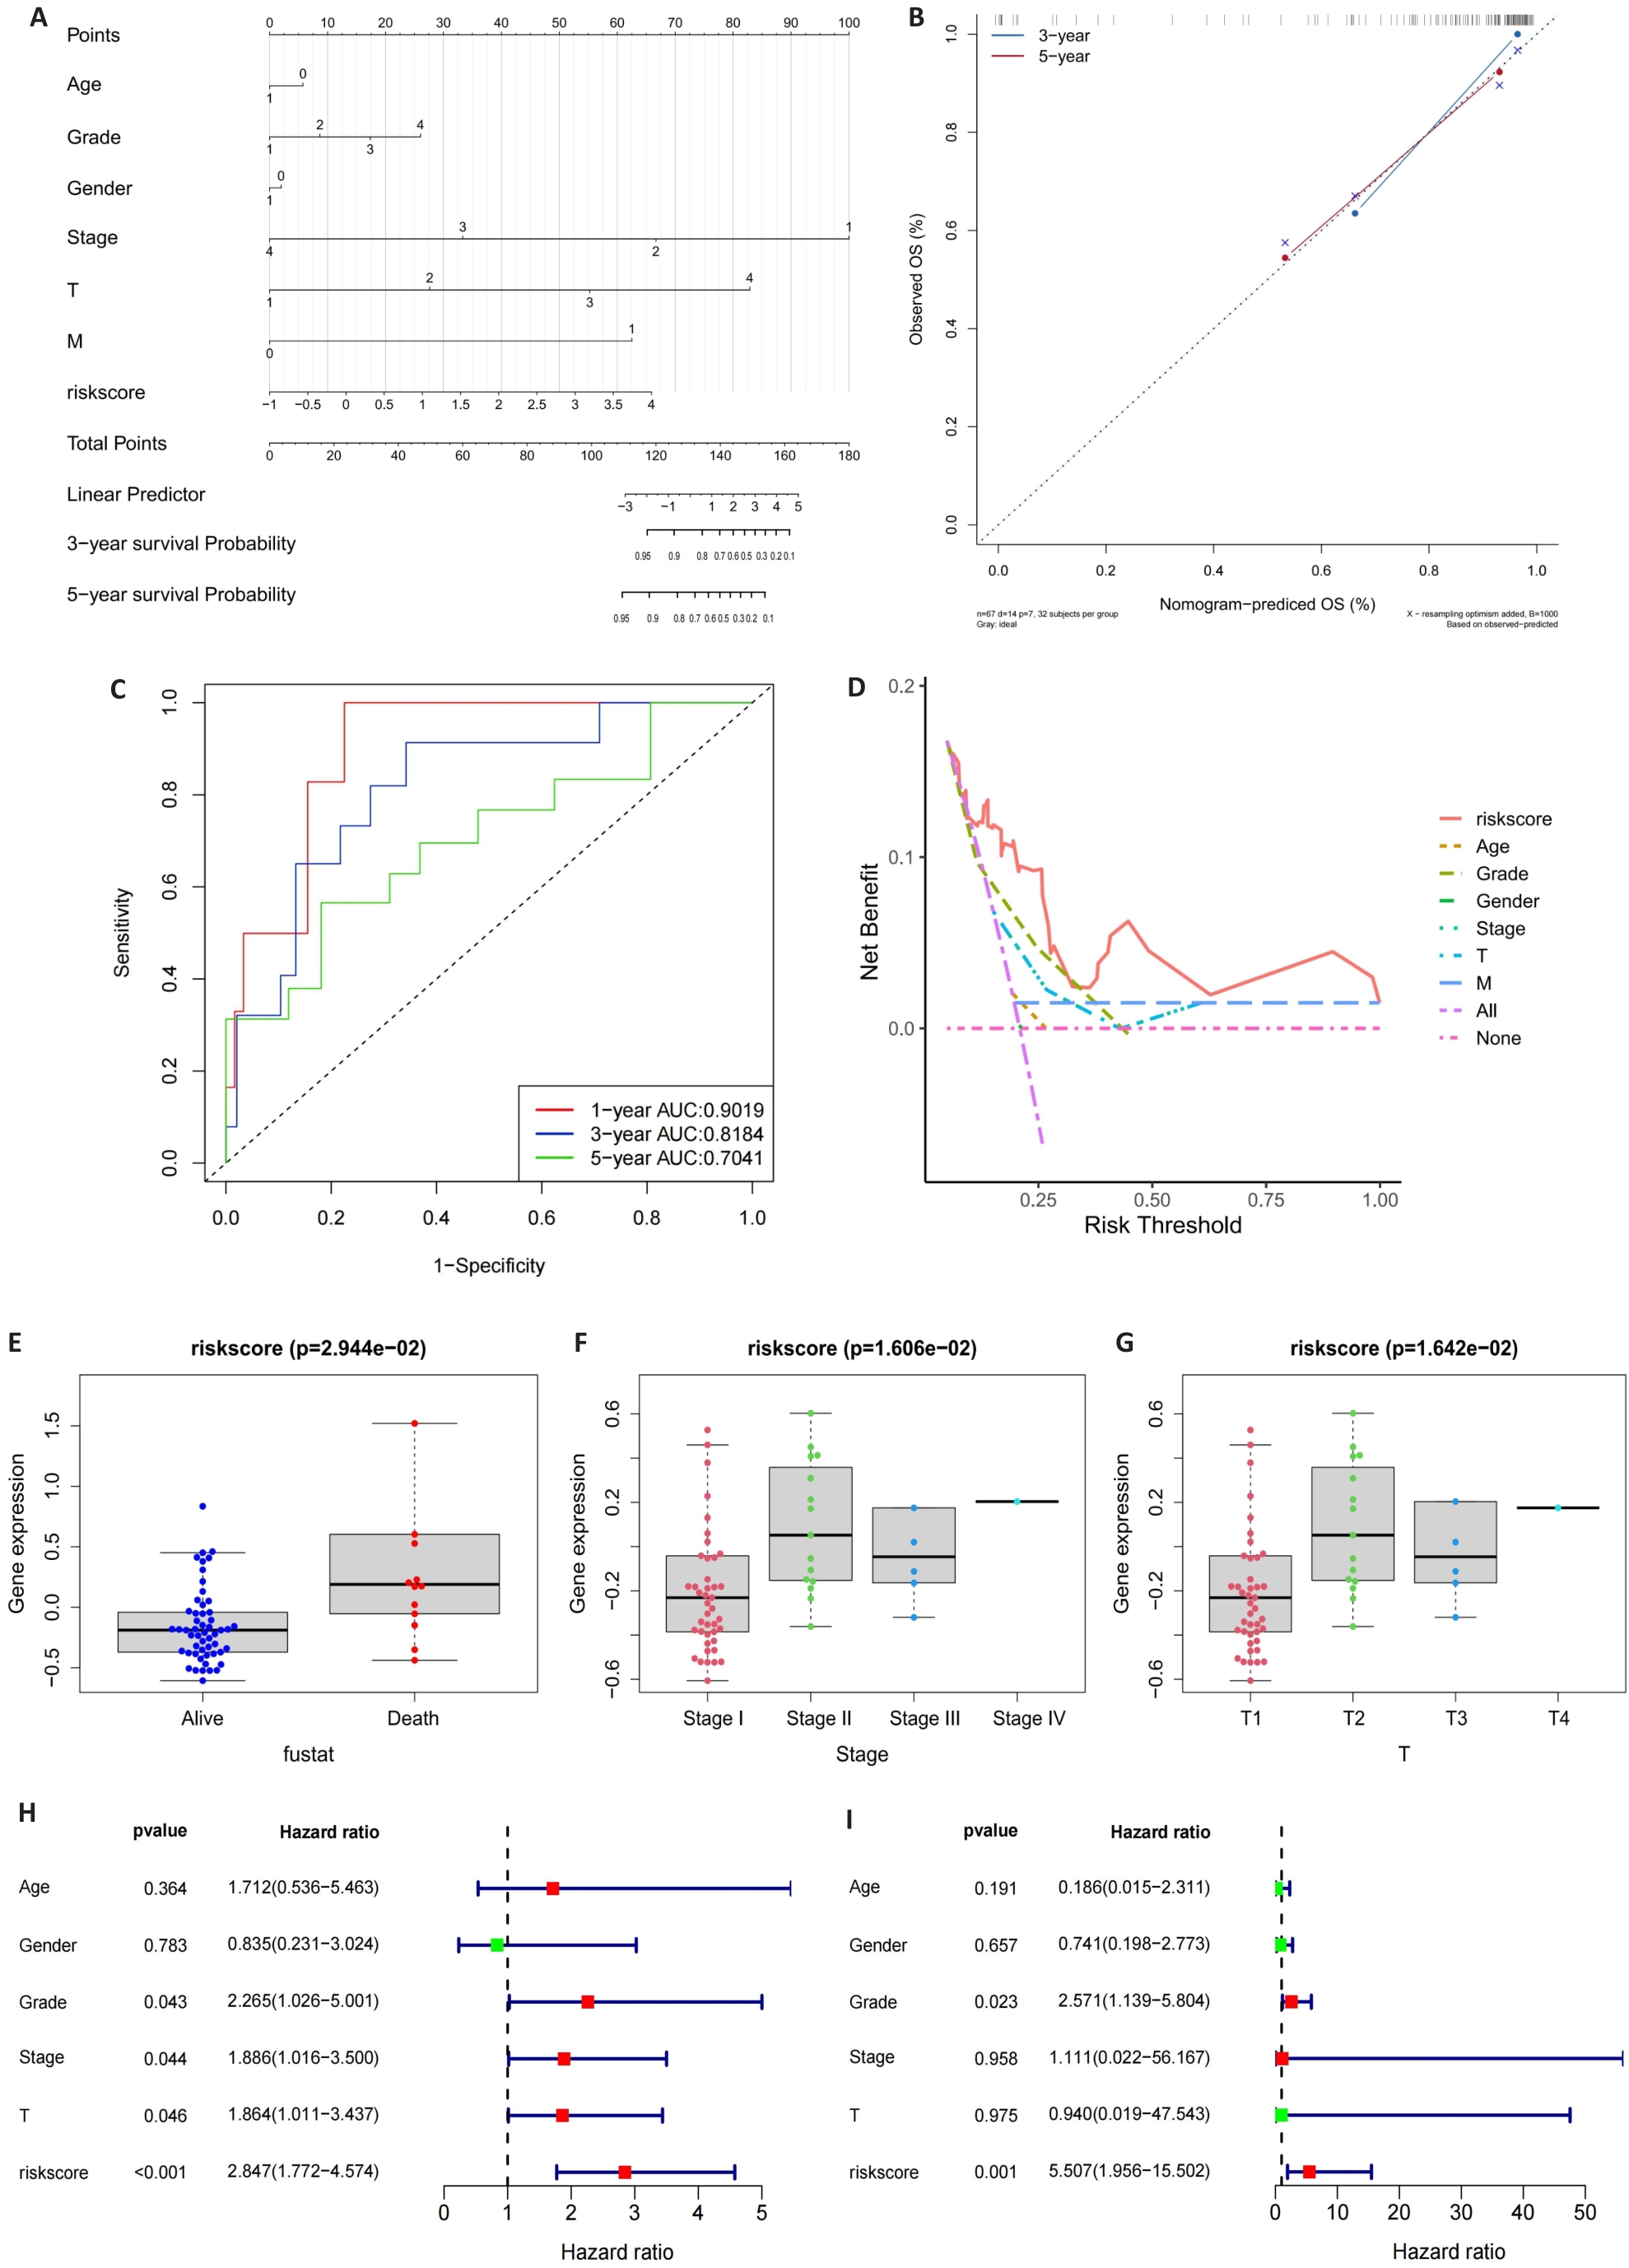
Fig.4 Construction of the nomogram. A: Nomogram of the risk scores and clinical characteristics. B: Calibration curves for evaluating OS predictions at 3 and 5 years. C, D: ROC and DCA curves for determining the accuracy of the nomogram for OS at 1, 3 and 5 years, respectively. E-G: Correlation of the risk scores with clinical stages. H, I: Univariate analysis and multivariate analysis for validating the independent prognostic value of the risk scores.
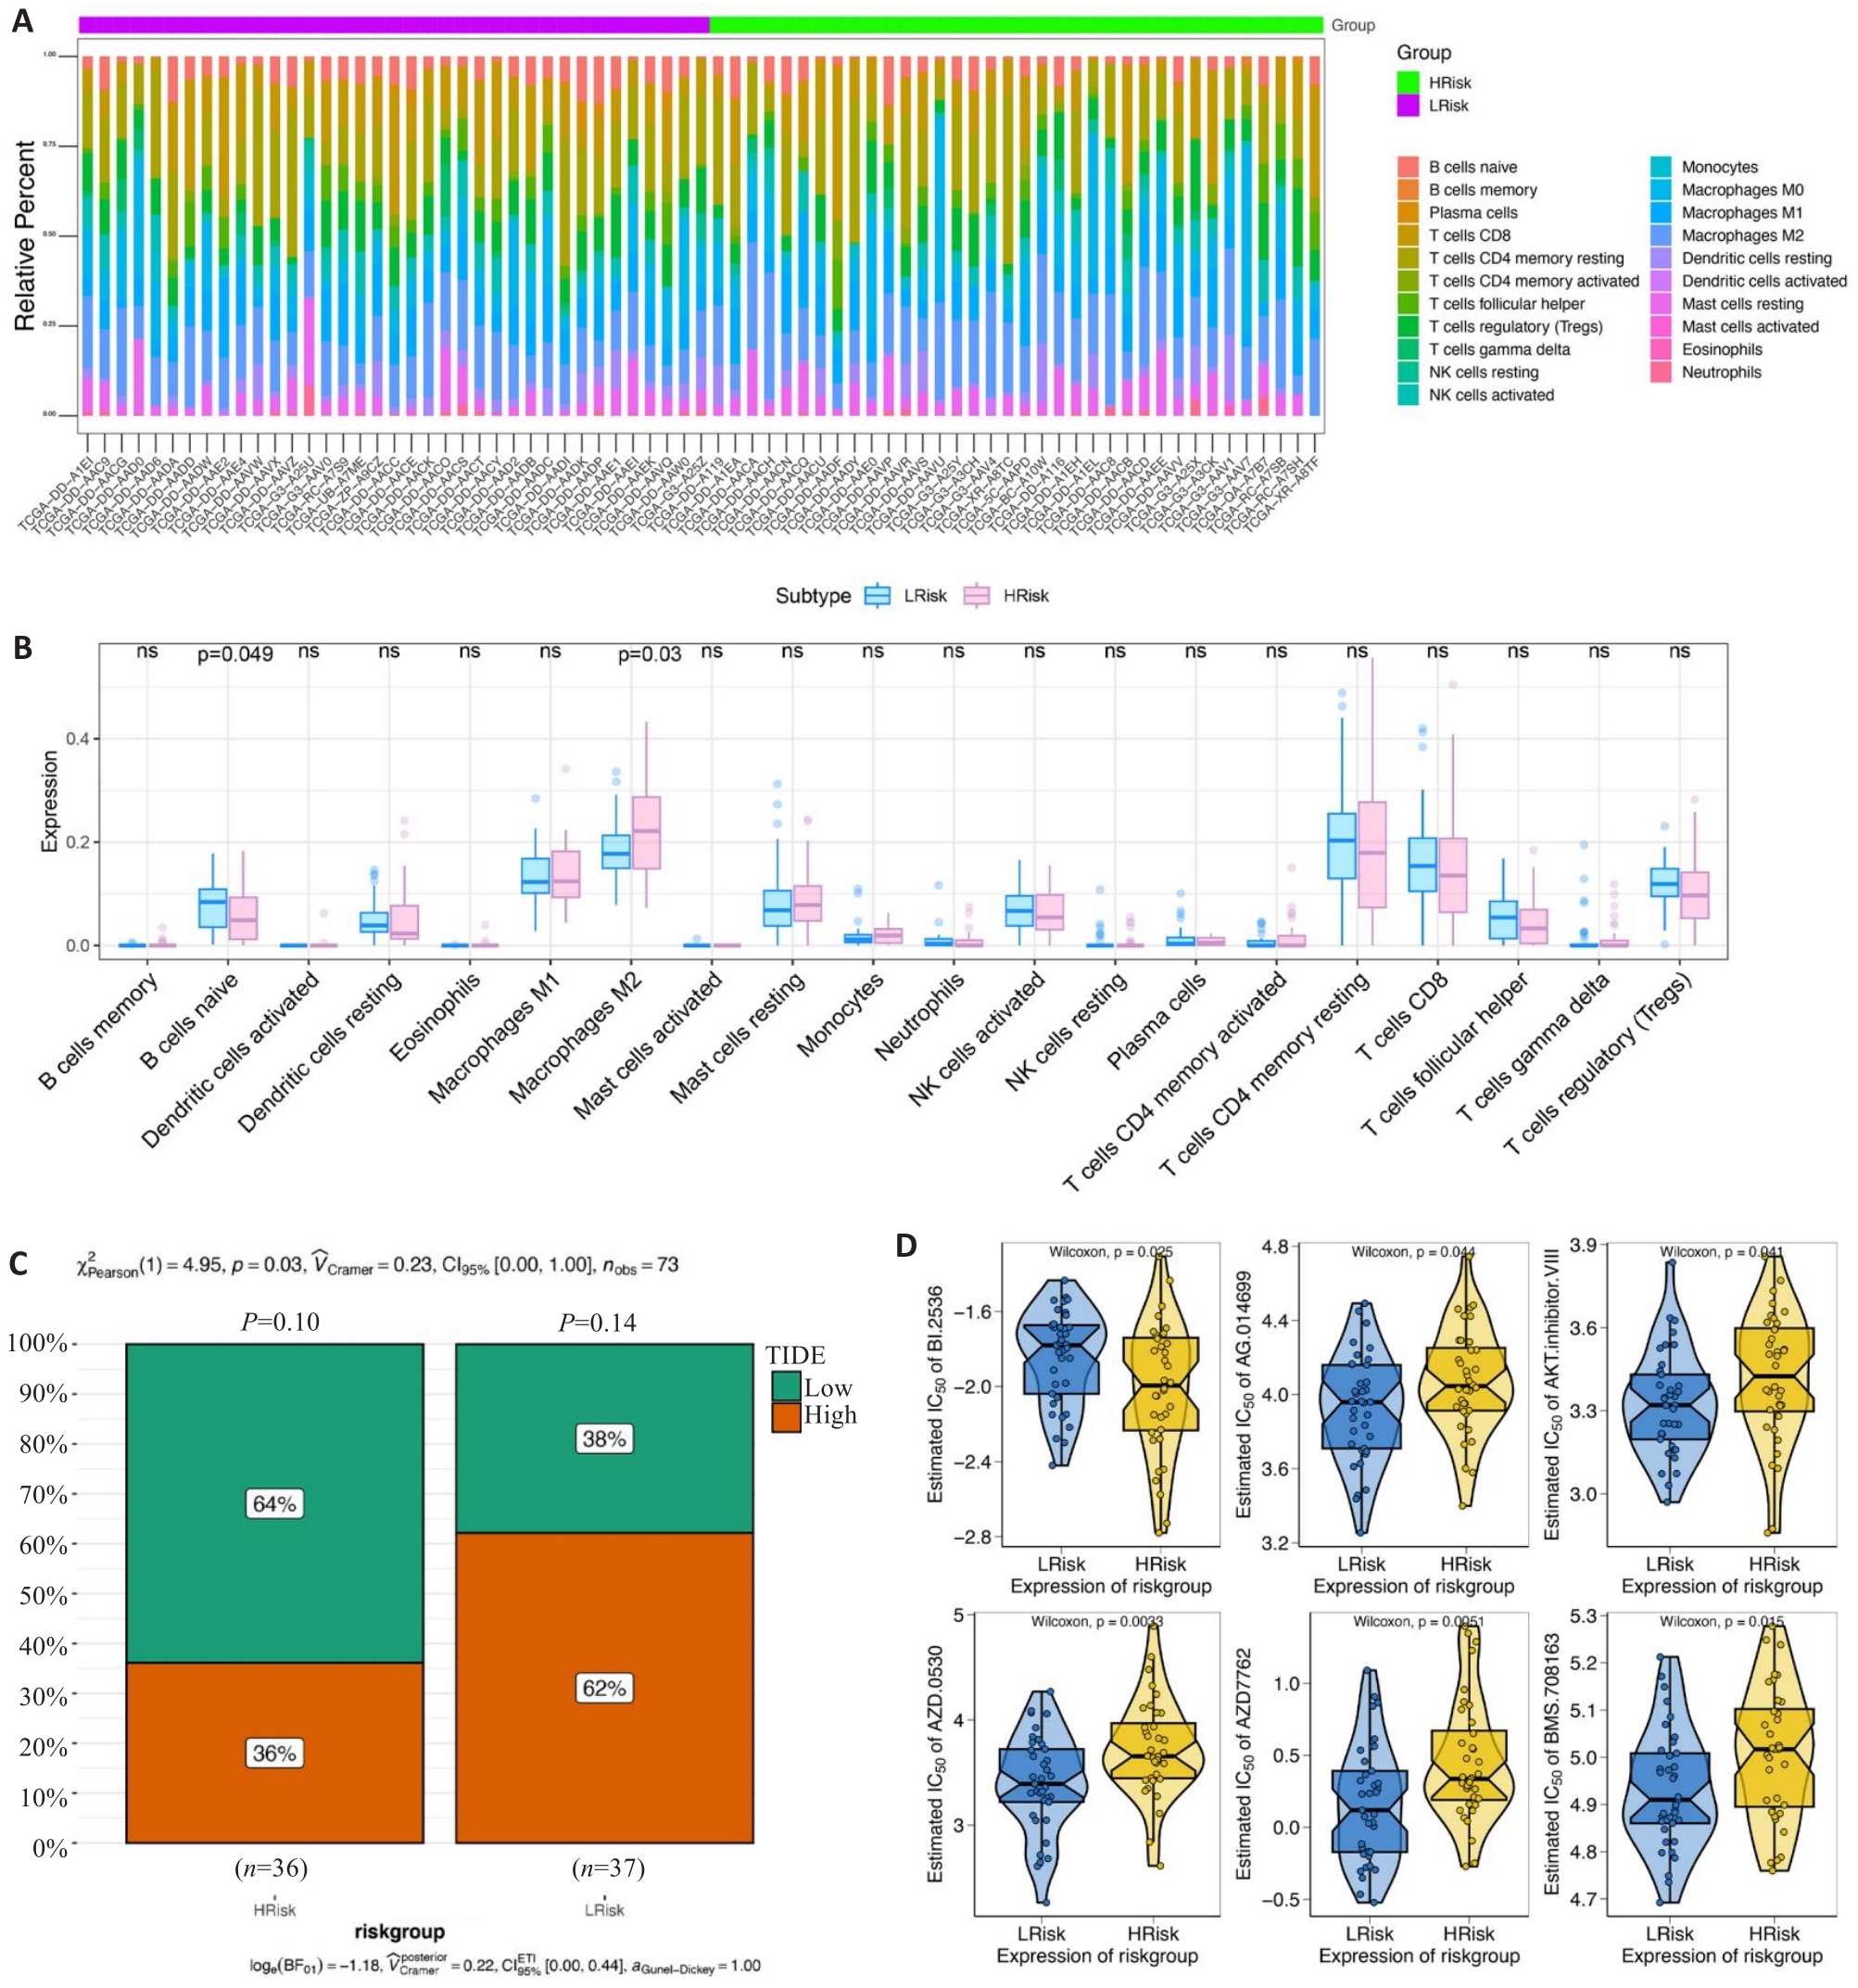
Fig.5 Clinical predictive value of the risk scoring model. A, B: Infiltrating level of immune cells in the high- and low-risk groups. C: Sensitivity of anti-tumor immunotherapy in the high- and low-risk groups. D: IC50 values of common chemotherapy drugs.
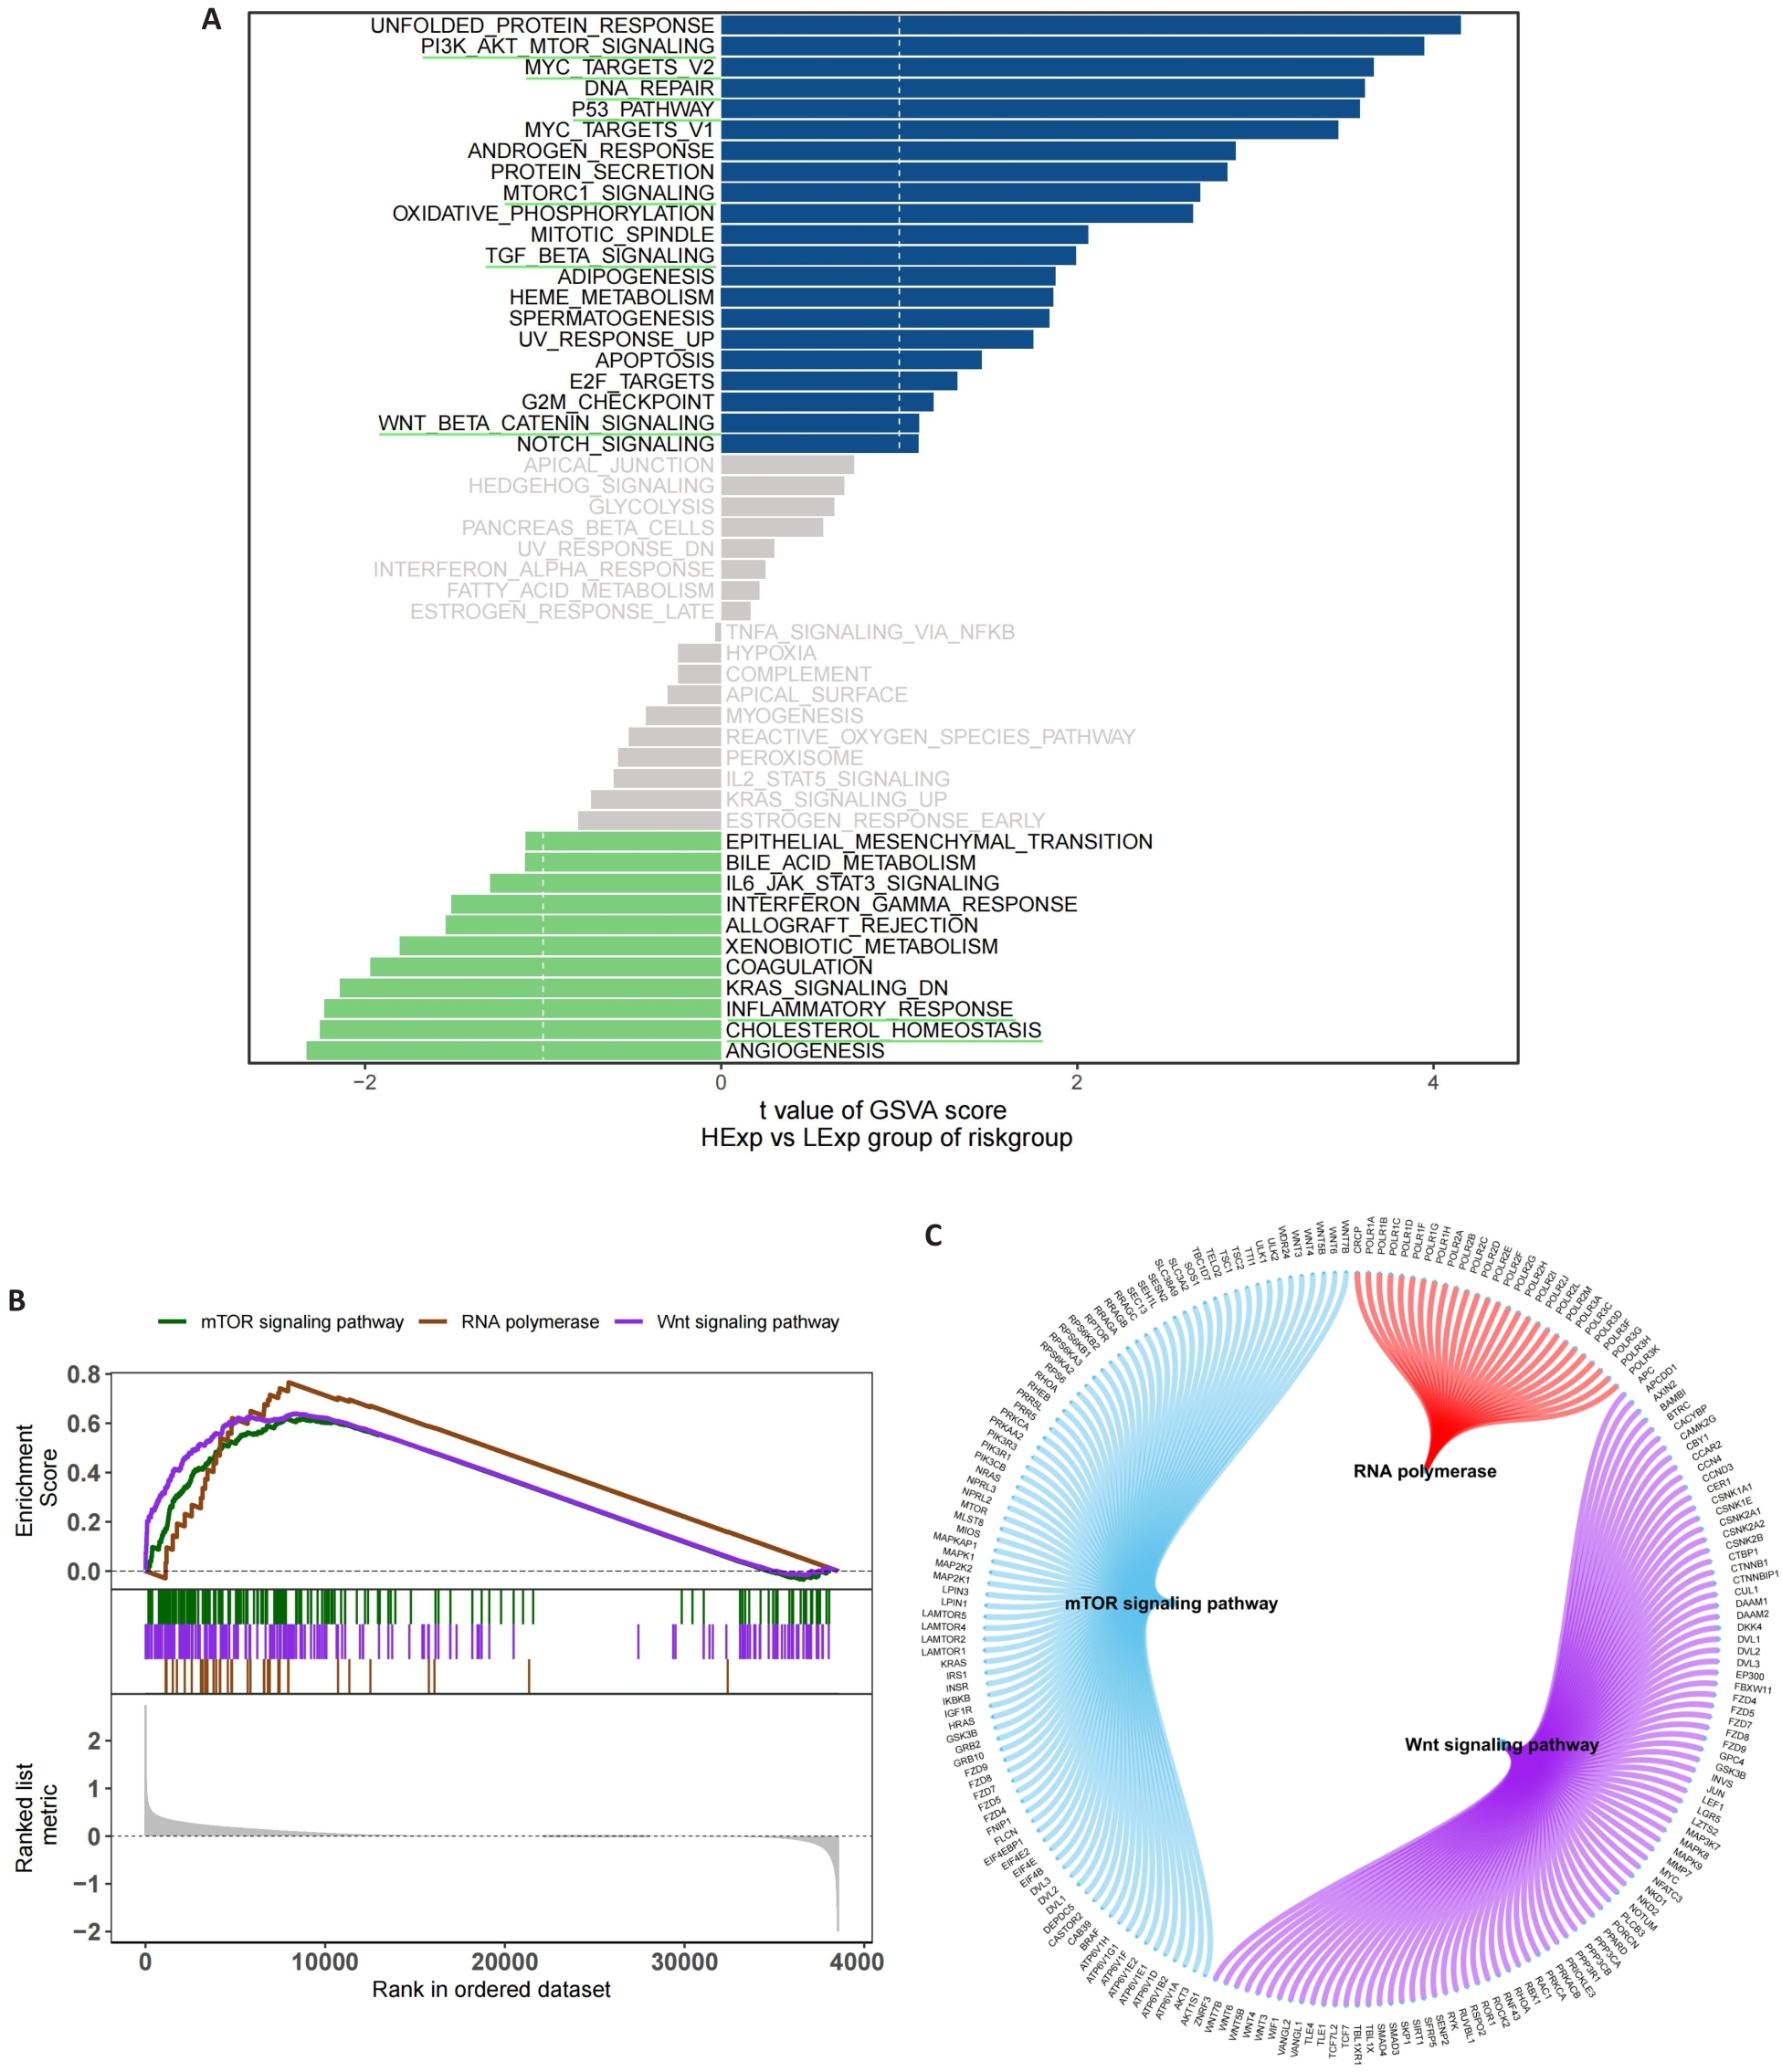
Fig.6 Functional enrichment analysis of signaling pathways related to the risk scoring model. A: GSVA in the high- and low-risk groups. B: GSEA in the high- and low-risk groups. C: Molecular interaction networks between the pathways.
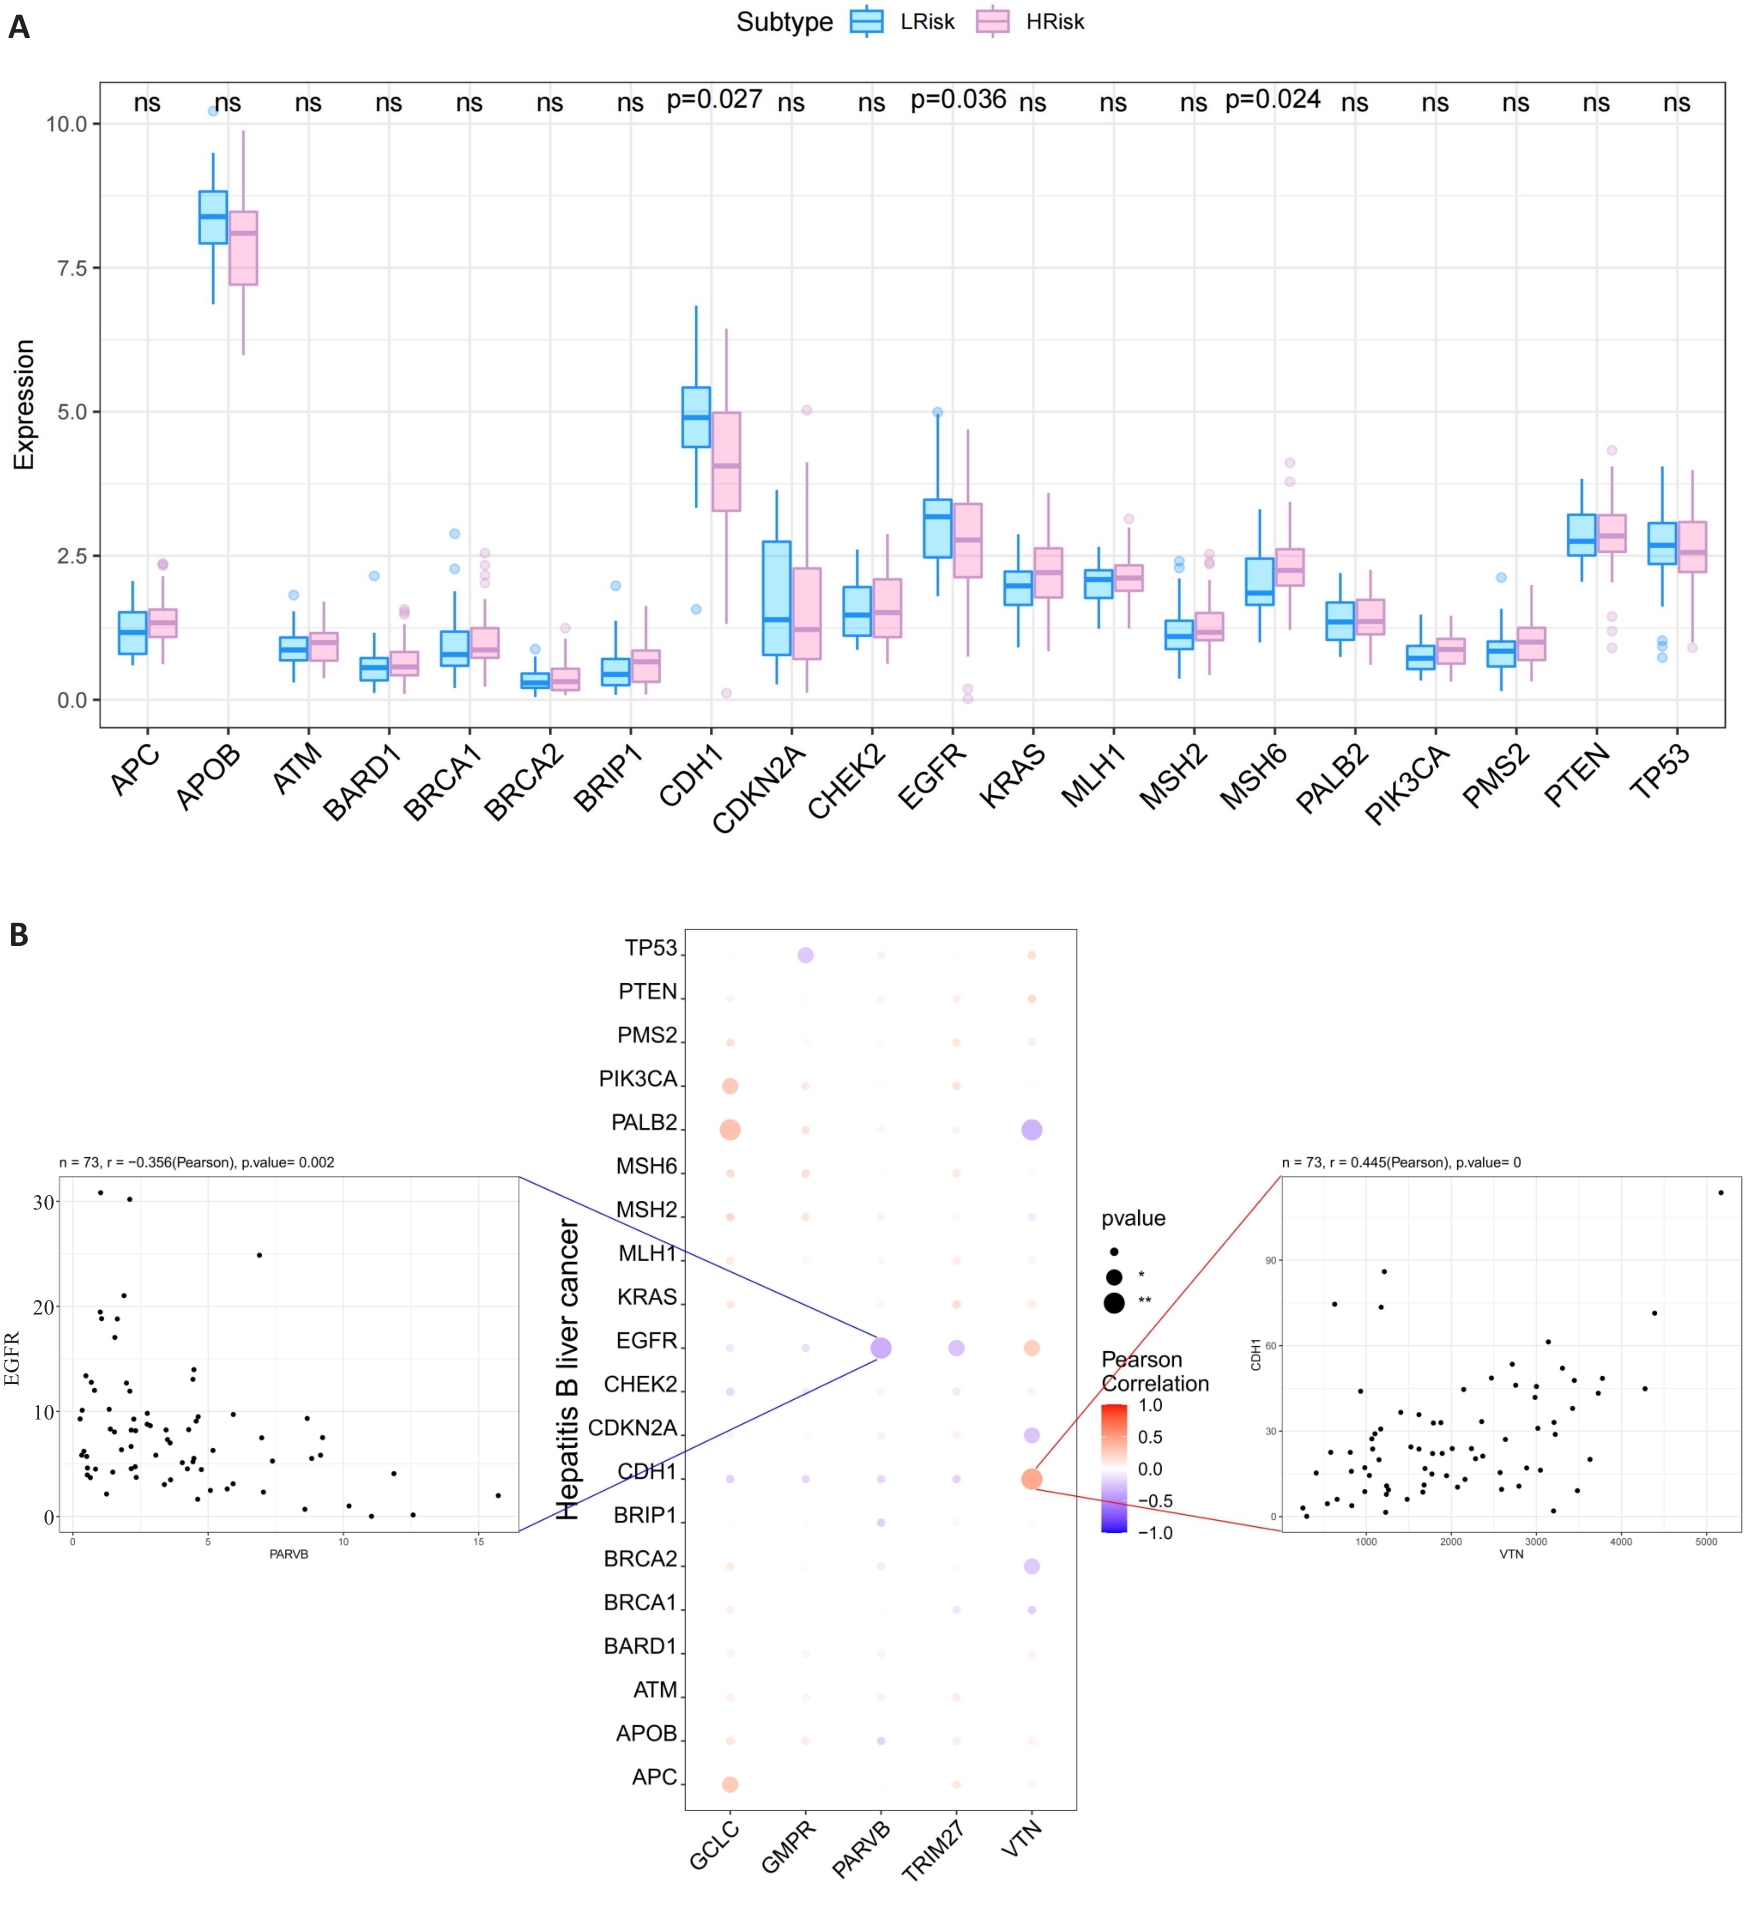
Fig.7 Relationship between the 5 hub MRGs and HCC pathogenic genes. A: Relationship between the hub genes and the top 20 HCC pathogenic genes. B: A bubble plot illustrating the Pearson correlation between 5 hub MRGs (VTN, GCLC, PARVB, TRIM27 and GMPR) and the top 20 HCC pathogenic genes.
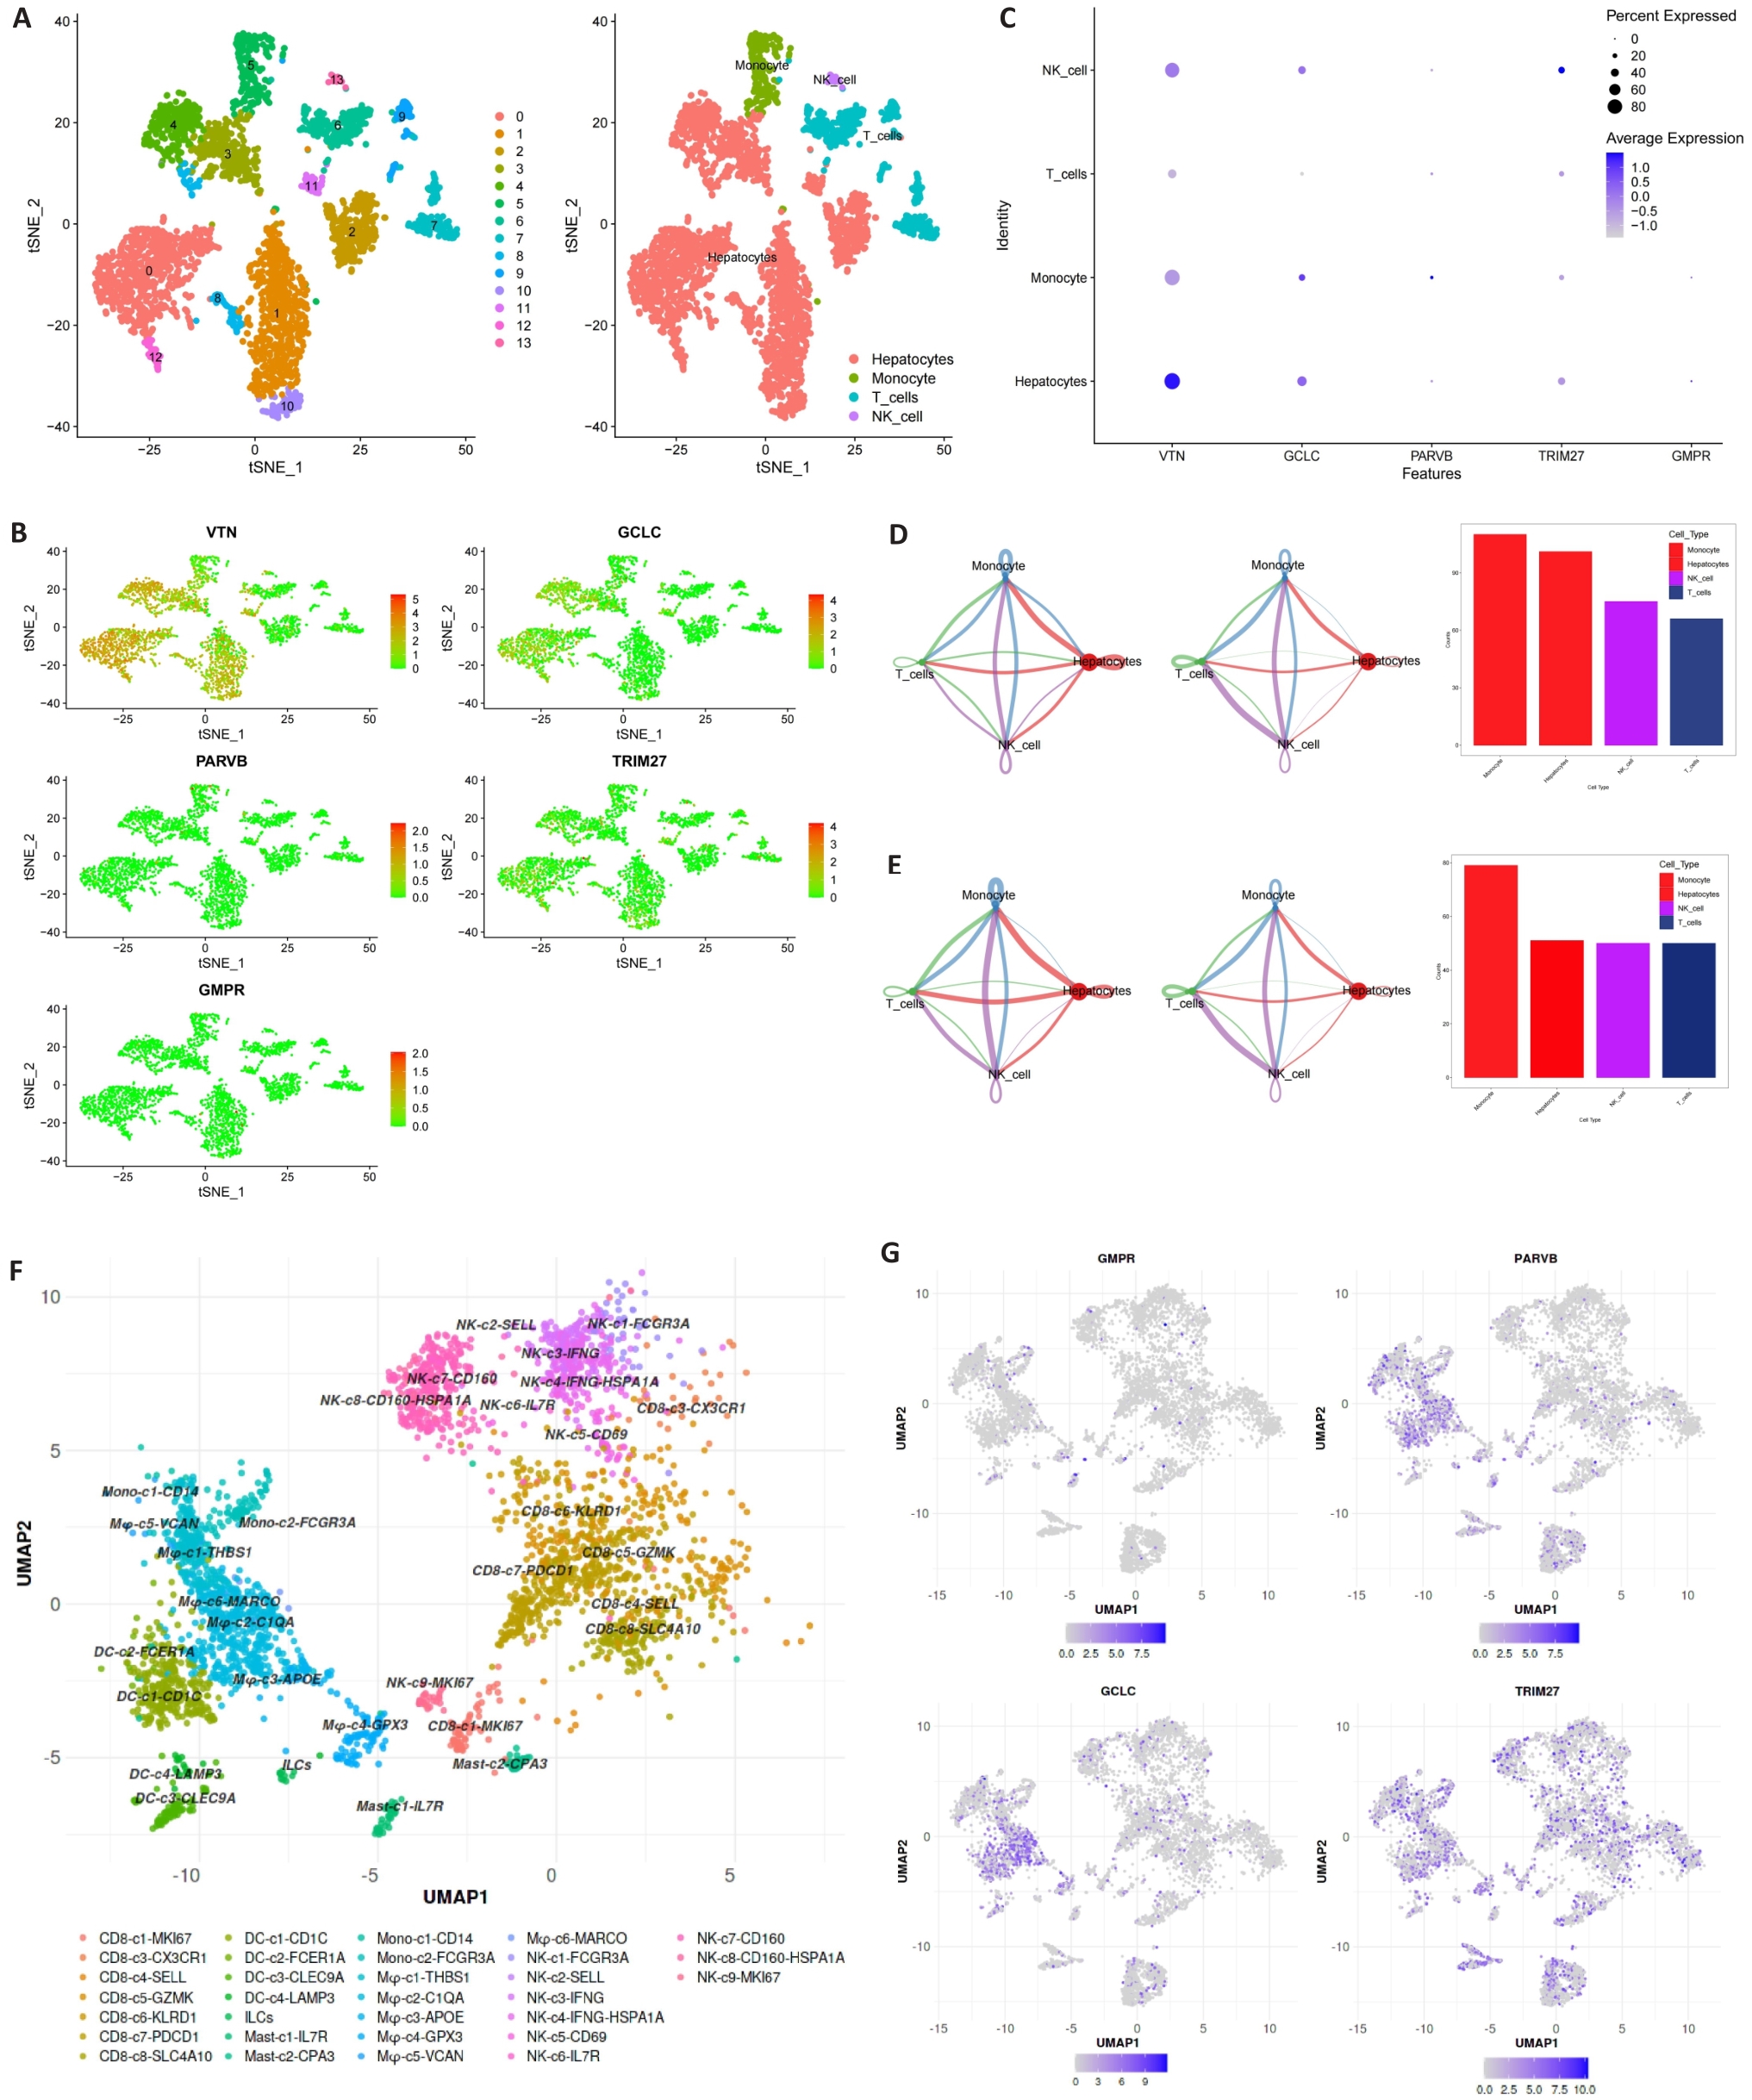
Fig.8 Expression of MRGs in different cell types. A-C: 5 hub MRGs are mainly expressed in hepatocytes, monocyte, T cells and NK cell. D, E: Cell chat intensity in high- and low-risk groups. F: UMAP projection showing the immune landscape of HCC, colored by cluster. G: Expressions of GCLC, PARVB, GMPR and TRIM27 in HCC immune microenvironment.
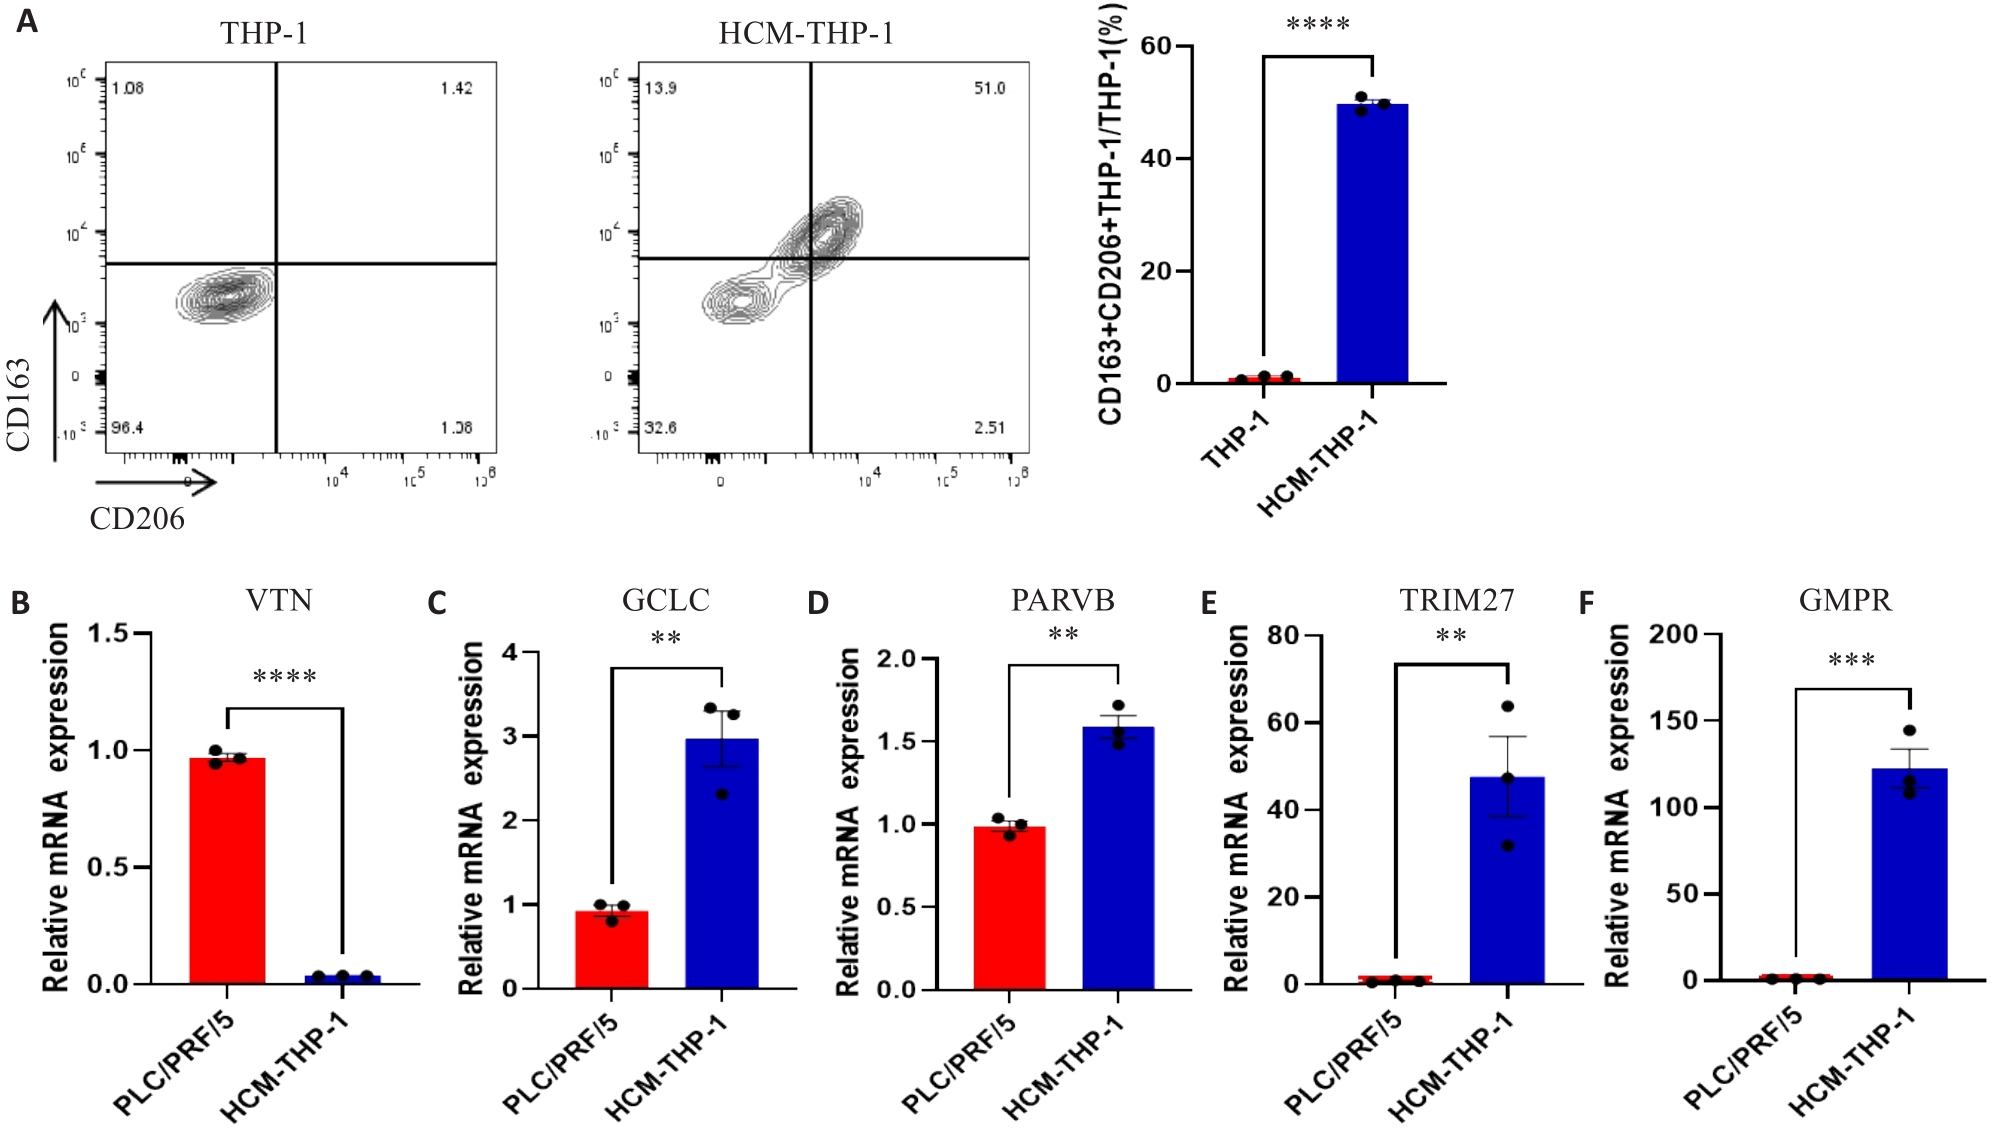
Fig.9 Expressions of MRGs in HCC cell lines and macrophages. A: Expression of CD163 and CD206 on THP-1 cells detected by flow cytometry. B-F: Expression of MRGs in PLC/PRF/5 and HCM-THP-1 cells. **P<0.01, ***P<0.001, ****P<0.0001.
| 1 | Craig AJ, von Felden J, Garcia-Lezana T, et al. Tumour evolution in hepatocellular carcinoma[J]. Nat Rev Gastroenterol Hepatol, 2020, 17(3): 139-52. DOI: 10.1038/s41575-019-0229-4 |
| 2 | Vogel A, Meyer T, Sapisochin G, et al. Hepatocellular carcinoma [J]. Lancet, 2022, 400(10360): 1345-62. DOI: 10.1016/s0140-6736(22)01200-4 |
| 3 | Koga H, Iwamoto H, Suzuki H, et al. Clinical practice guidelines and real-life practice in hepatocellular carcinoma: a Japanese perspective[J]. Clin Mol Hepatol, 2023, 29(2): 242-51. DOI: 10.3350/cmh.2023.0102 |
| 4 | Bruix J, Sherman M, American Association for the Study of Liver Diseases. Management of hepatocellular carcinoma: an update[J]. Hepatology, 2011, 53(3): 1020-2. DOI: 10.1002/hep.24199 |
| 5 | Prospective validation of the CLIP score: a new prognostic system for patients with cirrhosis and hepatocellular carcinoma[J]. Hepatology, 2000, 31(4): 840-5. DOI: 10.1053/he.2000.5628 |
| 6 | Chevret S, Trinchet JC, Mathieu D, et al. A new prognostic classification for predicting survival in patients with hepatocellular carcinoma. Groupe d’Etude et de Traitement du Carcinome Hépatocellulaire[J]. J Hepatol, 1999, 31(1): 133-41. DOI: 10.1016/s0168-8278(99)80173-1 |
| 7 | Llovet JM, Brú C, Bruix J. Prognosis of hepatocellular carcinoma: the BCLC staging classification[J]. Semin Liver Dis, 1999, 19(3): 329-38. DOI: 10.1055/s-2007-1007122 |
| 8 | Yau T, Tang VYF, Yao TJ, et al. Development of Hong Kong Liver Cancer staging system with treatment stratification for patients with hepatocellular carcinoma[J]. Gastroenterology, 2014, 146(7): 1691-700.e3. DOI: 10.1053/j.gastro.2014.02.032 |
| 9 | Primack A, Vogel CL, Kyalwazi SK, et al. A staging system for hepatocellular carcinoma: prognostic factors in Ugandan patients[J]. Cancer, 1975, 35(5): 1357-64. DOI: 10.1002/1097-0142(197505)35:5<1357::aid-cncr2820350518>3.0.co;2-8 |
| 10 | Kamel HFM, Al-Amodi HSAB. Exploitation of gene expression and cancer biomarkers in paving the path to era of personalized medicine[J]. Genomics Proteomics Bioinformatics, 2017, 15(4): 220-35. DOI: 10.1016/j.gpb.2016.11.005 |
| 11 | Ahluwalia P, Kolhe R, Gahlay GK. The clinical relevance of gene expression based prognostic signatures in colorectal cancer[J]. Biochim Biophys Acta Rev Cancer, 2021, 1875(2): 188513. DOI: 10.1016/j.bbcan.2021.188513 |
| 12 | Ye ZM, Zou SM, Niu ZY, et al. A novel risk model based on lipid metabolism-associated genes predicts prognosis and indicates immune microenvironment in breast cancer[J]. Front Cell Dev Biol, 2021, 9: 691676. DOI: 10.3389/fcell.2021.691676 |
| 13 | Bussard KM, Mutkus L, Stumpf K, et al. Tumor-associated stromal cells as key contributors to the tumor microenvironment[J]. Breast Cancer Res, 2016, 18(1): 84. DOI: 10.1186/s13058-016-0740-2 |
| 14 | Jensen C, Nissen NI, Von Arenstorff CS, et al. Serological assessment of collagen fragments and tumor fibrosis may guide immune checkpoint inhibitor therapy[J]. J Exp Clin Cancer Res, 2021, 40(1): 326. DOI: 10.1186/s13046-021-02133-z |
| 15 | de Visser KE, Joyce JA. The evolving tumor microenvironment: from cancer initiation to metastatic outgrowth[J]. Cancer Cell, 2023, 41(3): 374-403. DOI: 10.1016/j.ccell.2023.02.016 |
| 16 | Sherman MH, Beatty GL. Tumor microenvironment in pancreatic cancer pathogenesis and therapeutic resistance[J]. Annu Rev Pathol, 2023, 18: 123-48. DOI: 10.1146/annurev-pathmechdis-031621-024600 |
| 17 | Liu YD, Li CF, Lu YP, et al. Tumor microenvironment-mediated immune tolerance in development and treatment of gastric cancer[J]. Front Immunol, 2022, 13: 1016817. DOI: 10.3389/fimmu.2022.1016817 |
| 18 | Donne R, Lujambio A. The liver cancer immune microenvironment: therapeutic implications for hepatocellular carcinoma[J]. Hepatology, 2023, 77(5): 1773-96. DOI: 10.1002/hep.32740 |
| 19 | Hanahan D, Coussens LM. Accessories to the crime: functions of cells recruited to the tumor microenvironment[J]. Cancer Cell, 2012, 21(3): 309-22. DOI: 10.1016/j.ccr.2012.02.022 |
| 20 | Zhou DX, Luan JJ, Huang C, et al. Tumor-associated macrophages in hepatocellular carcinoma: friend or foe[J]? Gut Liver, 2021, 15(4): 500-16. DOI: 10.5009/gnl20223 |
| 21 | Pan YY, Yu YD, Wang XJ, et al. Tumor-associated macrophages in tumor immunity[J]. Front Immunol, 2020, 11: 583084. DOI: 10.3389/fimmu.2020.583084 |
| 22 | Zhang QM, He Y, Luo N, et al. Landscape and dynamics of single immune cells in hepatocellular carcinoma[J]. Cell, 2019, 179(4): 829-45.e20. DOI: 10.1016/j.cell.2019.10.003 |
| 23 | Yeung OWH, Lo CM, Ling CC, et al. Alternatively activated (M2) macrophages promote tumour growth and invasiveness in hepatocellular carcinoma[J]. J Hepatol, 2015, 62(3): 607-16. DOI: 10.1016/j.jhep.2014.10.029 |
| 24 | Nosaka T, Murata Y, Takahashi K, et al. Hepatocellular carcinoma progression promoted by 5-lipoxygenase activity in CD163+ tumor-associated macrophages[J]. Biomed Pharmacother, 2023, 162: 114592. DOI: 10.1016/j.biopha.2023.114592 |
| 25 | Song HQ, Wang XX, Zhang C, et al. Construction of an M2 macrophage-related prognostic model in hepatocellular carcinoma[J]. Front Oncol, 2023, 13: 1170775. DOI: 10.3389/fonc.2023.1170775 |
| 26 | Chen BB, Khodadoust MS, Liu CL, et al. Profiling tumor infiltrating immune cells with CIBERSORT[J]. Methods Mol Biol, 2018, 1711: 243-59. DOI: 10.1007/978-1-4939-7493-1_12 |
| 27 | Shin SW, Ahn KS, Kim SW, et al. Liver resection versus local ablation therapies for hepatocellular carcinoma within the Milan criteria: a systematic review and meta-analysis[J]. Ann Surg, 2021, 273(4): 656-66. DOI: 10.1097/sla.0000000000004350 |
| 28 | Jiang P, Gu SQ, Pan D, et al. Signatures of T cell dysfunction and exclusion predict cancer immunotherapy response[J]. Nat Med, 2018, 24(10): 1550-8. DOI: 10.1038/s41591-018-0136-1 |
| 29 | Sun JL, Zhou CH, Ma QN, et al. High GCLC level in tumor tissues is associated with poor prognosis of hepatocellular carcinoma after curative resection[J]. J Cancer, 2019, 10(15): 3333-43. DOI: 10.7150/jca.29769 |
| 30 | Bianchi-Smiraglia A, Bagati A, Fink EE, et al. Microphthalmia-associated transcription factor suppresses invasion by reducing intracellular GTP pools[J]. Oncogene, 2017, 36(1): 84-96. DOI: 10.1038/onc.2016.178 |
| 31 | Ng L, Tung-Ping Poon R, Yau S, et al. Suppression of actopaxin impairs hepatocellular carcinoma metastasis through modulation of cell migration and invasion[J]. Hepatology, 2013, 58(2): 667-79. DOI: 10.1002/hep.26396 |
| 32 | Wang HC, Zhang Y, Yan L, et al. Analysis of TRIM27 prognosis value and immune infiltrates in hepatocellular carcinoma[J]. Int J Immunopathol Pharmacol, 2022, 36: 3946320221132986. DOI: 10.1177/03946320221132986 |
| 33 | Casanova-Acebes M, Dalla E, Leader AM, et al. Tissue-resident macrophages provide a pro-tumorigenic niche to early NSCLC cells[J]. Nature, 2021, 595(7868): 578-84. DOI: 10.1038/s41586-021-03651-8 |
| 34 | Zhang L, Li ZY, Skrzypczynska KM, et al. Single-cell analyses inform mechanisms of myeloid-targeted therapies in colon cancer[J]. Cell, 2020, 181(2): 442-59.e29. DOI: 10.1016/j.cell.2020.03.048 |
| 35 | Zheng LT, Qin SS, Si W, et al. Pan-cancer single-cell landscape of tumor-infiltrating T cells[J]. Science, 2021, 374(6574): abe6474. DOI: 10.1126/science.abe6474 |
| 36 | Liu CL, Yang MX, Zhang DZ, et al. Clinical cancer immunotherapy: current progress and prospects[J]. Front Immunol, 2022, 13: 961805. DOI: 10.3389/fimmu.2022.961805 |
| 37 | Liu Y, Xun ZZ, Ma K, et al. Identification of a tumour immune barrier in the HCC microenvironment that determines the efficacy of immunotherapy[J]. J Hepatol, 2023, 78(4): 770-82. DOI: 10.1016/j.jhep.2023.01.011 |
| 38 | Wei CY, Zhu MX, Zhang PF, et al. PKCα/ZFP64/CSF1 axis resets the tumor microenvironment and fuels anti-PD1 resistance in hepatocellular carcinoma[J]. J Hepatol, 2022, 77(1): 163-76. DOI: 10.1016/j.jhep.2022.02.019 |
| 39 | Yang Y, Ye YC, Chen Y, et al. Crosstalk between hepatic tumor cells and macrophages via Wnt/β‑catenin signaling promotes M2-like macrophage polarization and reinforces tumor malignant behaviors[J]. Cell Death Dis, 2018, 9(8): 793. DOI: 10.1038/s41419-018-0818-0 |
| 40 | Lian GH, Chen SJ, Ouyang M, et al. Colon cancer cell secretes EGF to promote M2 polarization of TAM through EGFR/PI3K/AKT/mTOR pathway[J]. Technol Cancer Res Treat, 2019, 18: 1533033819849068. DOI: 10.1177/1533033819849068 |
| Viewed | ||||||
|
Full text |
|
|||||
|
Abstract |
|
|||||