
Journal of Southern Medical University ›› 2026, Vol. 46 ›› Issue (9): 2091-2100.doi: 10.12122/j.issn.1673-4254.2026.09.09
Cuiyan CHEN1,2( ), Wenxian ZHANG1,2, Yilin CAI1,2, Mei OUYANG1,2, Ye LIANG2,3, Mingbiao LIANG2, Huiying LIANG1,2()
Received:2026-02-13
Online:2026-09-20
Published:2026-09-30
Contact:
Huiying LIANG
E-mail:17675629838@163.com;lianghuiying@gdph.org.cn
Cuiyan CHEN, Wenxian ZHANG, Yilin CAI, Mei OUYANG, Ye LIANG, Mingbiao LIANG, Huiying LIANG. Development of a machine learning-based model for assessing pulmonary function in elderly patients[J]. Journal of Southern Medical University, 2026, 46(9): 2091-2100.
Add to citation manager EndNote|Ris|BibTeX
URL: https://www.j-smu.com/EN/10.12122/j.issn.1673-4254.2026.09.09
| Variable | Missing (%) | Variable | Missing (%) |
|---|---|---|---|
| FT4 | 47.14 (deleted) | Number of hospitalizations | 0.99 |
| D-Dimer | 37.98 (deleted) | TT | 0.69 |
| CK | 37.11 (deleted) | APTT | 0.69 |
| Mg | 35.85 (deleted) | FIB | 0.69 |
| Drinking | 27.82 | K | 0.33 |
| Smoking | 27.72 | Glu | 0.28 |
| PT | 18.85 | RDW-SD | 0.27 |
| Cl | 18.10 | NEUT% | 0.15 |
| Ca | 18.10 | EOS% | 0.15 |
| Na | 18.10 | RDW-CV | 0.15 |
| LDH | 17.75 | RBC | 0.15 |
| HCT | 17.73 | Marriage | 0.14 |
| HGB | 17.73 | BMI | 0.05 |
| P-LCR | 12.13 | ||
| FT4: Free thyroxine; CK: Creatine kinase; PT: Prothrombin time; LDH: Lactate dehydrogenase; HCT: Hematocrit; HGB: Hemoglobin; P-LCR: Platelet-large cell ratio; TT: Thrombin time; APTT: Activated partial thromboplastin time; FIB: Fibrinogen; Glu: Glucose; RDW-SD: Red cell distribution width-standard deviation; PLT: Platelets; NEUT%: Neutrophil percentage; EOS%: Eosinophil percentage; RDW-CV: Red cell distribution width-coefficient of variation; RBC: Red blood cell count; BMI: Body mass index. | |||
Tab.1 Statistics of missing values of the variables
| Variable | Missing (%) | Variable | Missing (%) |
|---|---|---|---|
| FT4 | 47.14 (deleted) | Number of hospitalizations | 0.99 |
| D-Dimer | 37.98 (deleted) | TT | 0.69 |
| CK | 37.11 (deleted) | APTT | 0.69 |
| Mg | 35.85 (deleted) | FIB | 0.69 |
| Drinking | 27.82 | K | 0.33 |
| Smoking | 27.72 | Glu | 0.28 |
| PT | 18.85 | RDW-SD | 0.27 |
| Cl | 18.10 | NEUT% | 0.15 |
| Ca | 18.10 | EOS% | 0.15 |
| Na | 18.10 | RDW-CV | 0.15 |
| LDH | 17.75 | RBC | 0.15 |
| HCT | 17.73 | Marriage | 0.14 |
| HGB | 17.73 | BMI | 0.05 |
| P-LCR | 12.13 | ||
| FT4: Free thyroxine; CK: Creatine kinase; PT: Prothrombin time; LDH: Lactate dehydrogenase; HCT: Hematocrit; HGB: Hemoglobin; P-LCR: Platelet-large cell ratio; TT: Thrombin time; APTT: Activated partial thromboplastin time; FIB: Fibrinogen; Glu: Glucose; RDW-SD: Red cell distribution width-standard deviation; PLT: Platelets; NEUT%: Neutrophil percentage; EOS%: Eosinophil percentage; RDW-CV: Red cell distribution width-coefficient of variation; RBC: Red blood cell count; BMI: Body mass index. | |||
| Variable | Overall | Q1 | Q2 | Q3 | Q4 | P |
|---|---|---|---|---|---|---|
| Sample (n) | 7720 | 1968 | 1911 | 1937 | 1904 | |
| FVC (L) | 2.45±0.69 | 1.6±0.28 | 2.19±0.13 | 2.66±0.15 | 3.36±0.34 | <0.001 |
| Age (year) | 68.56±6.27 | 71.25±6.83 | 68.68±6.20 | 68.01±5.76 | 66.22±5.03 | <0.001 |
| Gender (men) | 4197 (54.4%) | 354 (18.0%) | 688 (36.0%) | 1339 (69.1%) | 1816 (95.4%) | <0.001 |
| BMI (kg/m2) | 25.09±7.38 | 25.1±7.63 | 25.17±7.65 | 25.04±7.15 | 25.04±7.09 | 0.94 |
| Smoking | 1762 (22.8%) | 171 (8.7%) | 324 (17%) | 546 (28.2%) | 721 (37.9%) | <0.001 |
| Drinking | 551 (7.1%) | 46 (2.3%) | 97 (5.1%) | 158 (8.2%) | 250 (13.1%) | <0.001 |
| Marital status | <0.001 | |||||
| Never married | 43 (0.6%) | 15 (0.8%) | 13 (0.7%) | 8 (0.4%) | 7 (0.4%) | |
| Married | 7127 (92.3%) | 1708 (86.8%) | 1751 (91.6%) | 1829 (94.4%) | 1839 (96.6%) | |
| Divorced/seperated/widowed | 550 (7.1%) | 245 (12.4%) | 147 (7.7%) | 100 (5.2%) | 58 (3.0%) | |
| Number of hospitalizations | 1.81±2.37 | 1.81±2.22 | 1.73±1.98 | 1.89±2.93 | 1.81±2.22 | 0.22 |
| Disease of respiratory system | 626( 8.1%) | 157 (8.0%) | 135 (7.1%) | 152 (7.8%) | 182 (9.6%) | 0.04 |
| Hypertention | 2559 (33.1%) | 731 (37.1%) | 622 (32.5%) | 644 (33.2%) | 562 (29.5%) | <0.001 |
| Diabetes | 1189 (15.4%) | 339 (17.2%) | 286 (15.0%) | 301 (15.5%) | 263 (13.8%) | 0.03 |
| Stroke | 392 (5.1%) | 137 (7.0%) | 86 (4.5%) | 100 (5.2%) | 69 (3.6%) | <0.001 |
| Pulmonary arterial hypertension | 271 (3.5%) | 158 (8.0%) | 57 (3.0%) | 35 (1.8%) | 21 (1.1%) | <0.001 |
| CAD | 837 (10.8%) | 236 (12.0%) | 199 (10.4%) | 209 (10.8%) | 193 (10.1%) | 0.26 |
| NEUT (%) | 70.47±8.52 | 71.2±9.04 | 70.84±8.1 | 70.08±8.64 | 69.73±8.16 | <0.001 |
| LDH (U/L) | 243.67±412.54 | 269.88±303.08 | 237.51±249.84 | 236.37±430.66 | 230.19±585.7 | 0.01 |
| PT (s) | 14.32±2.55 | 15.11±3.56 | 14.16±2.25 | 14.04±1.97 | 13.96±1.85 | <0.001 |
| TT (s) | 18.6±8.47 | 19.93±11.69 | 18.29±7.56 | 18.31±7.32 | 17.83±5.95 | <0.001 |
| EOS (%) | 2.1±2.03 | 1.92±1.93 | 1.92±1.83 | 2.24±2.34 | 2.33±1.94 | <0.001 |
| P-LCR (%) | 27.64±24.86 | 28.19±9.05 | 28.44±47.8 | 26.95±8.08 | 26.96±7.81 | 0.12 |
| Cl(mmol/L) | 105.09±2.98 | 104.92±3.21 | 105.29±3.01 | 105.09±2.82 | 105.05±2.86 | 0.002 |
| APTT (s) | 38.9±7.35 | 40.27±9.51 | 38.3±6.85 | 38.55±6.39 | 38.43±5.87 | <0.001 |
| RDW-CV | 0.14±0.02 | 0.14±0.03 | 0.14±0.02 | 0.14±0.02 | 0.14±0.02 | <0.001 |
| RDW-SD (fl) | 44.9±5.62 | 45.68±6.18 | 44.57±5.58 | 44.76±5.25 | 44.58±5.33 | <0.001 |
| HCT (%) | 36.27±5.05 | 34.55±5.00 | 35.78±4.76 | 36.79±4.92 | 38.01±4.86 | <0.001 |
| RBC (×1012/L) | 4.03±0.64 | 3.87±0.64 | 3.99±0.62 | 4.08±0.64 | 4.19±0.63 | <0.001 |
| Glu (mmol/L) | 6.3±1.85 | 6.54±2.02 | 6.33±1.82 | 6.22±1.81 | 6.08±1.69 | <0.001 |
| PLT (×109/L) | 212.03±71.58 | 212.43±75.93 | 215.59±73.07 | 212.8±70.48 | 207.24±66.14 | 0.004 |
| FIB (g/L) | 3.74±1.00 | 3.87±0.99 | 3.75±0.99 | 3.73±1.00 | 3.6±0.98 | <0.001 |
| HGB (g/L) | 119.59±17.28 | 113.18±16.87 | 117.71±16.14 | 121.49±16.8 | 126.17±16.57 | <0.001 |
| Ca (mmol/L) | 2.23±0.12 | 2.23±0.12 | 2.23±0.12 | 2.23±0.11 | 2.22±0.12 | 0.04 |
| Na (mmol/L) | 139.21±3.19 | 139.36±3.25 | 139.34±3.36 | 139.17±2.95 | 138.97±3.15 | <0.001 |
| K (mmol/L) | 3.85±0.46 | 3.87±0.40 | 3.83±0.44 | 3.83±0.39 | 3.86±0.59 | 0.007 |
| FVC: Forced vital capacity; BMI: Body mass index; NEUT%: Neutrophil percentage; LDH: Lactate dehydrogenase; PT: Prothrombin time; TT: Thrombin time; EOS%: Eosimophil; P-LCR: Platelet-large cell ratio; Cl: Chloride; APTT: Activated partialthromboplastin time; RDW-CV: Red cell distribution width-coefficient of variation; RDW-SD: Red cell distribution width-standard deviation; HCT: Hematocrit; RBC: Red blood cell count; Glu: Glucose; PLT: Platelets; FIB: Fibrinogen; HGB: Hemoglobin; Ca: Calcium; Na: Sodium; K: Kalium | ||||||
Tab.2 Baseline characteristics of the participants stratified by the quartiles of forced vital capacity (FVC)
| Variable | Overall | Q1 | Q2 | Q3 | Q4 | P |
|---|---|---|---|---|---|---|
| Sample (n) | 7720 | 1968 | 1911 | 1937 | 1904 | |
| FVC (L) | 2.45±0.69 | 1.6±0.28 | 2.19±0.13 | 2.66±0.15 | 3.36±0.34 | <0.001 |
| Age (year) | 68.56±6.27 | 71.25±6.83 | 68.68±6.20 | 68.01±5.76 | 66.22±5.03 | <0.001 |
| Gender (men) | 4197 (54.4%) | 354 (18.0%) | 688 (36.0%) | 1339 (69.1%) | 1816 (95.4%) | <0.001 |
| BMI (kg/m2) | 25.09±7.38 | 25.1±7.63 | 25.17±7.65 | 25.04±7.15 | 25.04±7.09 | 0.94 |
| Smoking | 1762 (22.8%) | 171 (8.7%) | 324 (17%) | 546 (28.2%) | 721 (37.9%) | <0.001 |
| Drinking | 551 (7.1%) | 46 (2.3%) | 97 (5.1%) | 158 (8.2%) | 250 (13.1%) | <0.001 |
| Marital status | <0.001 | |||||
| Never married | 43 (0.6%) | 15 (0.8%) | 13 (0.7%) | 8 (0.4%) | 7 (0.4%) | |
| Married | 7127 (92.3%) | 1708 (86.8%) | 1751 (91.6%) | 1829 (94.4%) | 1839 (96.6%) | |
| Divorced/seperated/widowed | 550 (7.1%) | 245 (12.4%) | 147 (7.7%) | 100 (5.2%) | 58 (3.0%) | |
| Number of hospitalizations | 1.81±2.37 | 1.81±2.22 | 1.73±1.98 | 1.89±2.93 | 1.81±2.22 | 0.22 |
| Disease of respiratory system | 626( 8.1%) | 157 (8.0%) | 135 (7.1%) | 152 (7.8%) | 182 (9.6%) | 0.04 |
| Hypertention | 2559 (33.1%) | 731 (37.1%) | 622 (32.5%) | 644 (33.2%) | 562 (29.5%) | <0.001 |
| Diabetes | 1189 (15.4%) | 339 (17.2%) | 286 (15.0%) | 301 (15.5%) | 263 (13.8%) | 0.03 |
| Stroke | 392 (5.1%) | 137 (7.0%) | 86 (4.5%) | 100 (5.2%) | 69 (3.6%) | <0.001 |
| Pulmonary arterial hypertension | 271 (3.5%) | 158 (8.0%) | 57 (3.0%) | 35 (1.8%) | 21 (1.1%) | <0.001 |
| CAD | 837 (10.8%) | 236 (12.0%) | 199 (10.4%) | 209 (10.8%) | 193 (10.1%) | 0.26 |
| NEUT (%) | 70.47±8.52 | 71.2±9.04 | 70.84±8.1 | 70.08±8.64 | 69.73±8.16 | <0.001 |
| LDH (U/L) | 243.67±412.54 | 269.88±303.08 | 237.51±249.84 | 236.37±430.66 | 230.19±585.7 | 0.01 |
| PT (s) | 14.32±2.55 | 15.11±3.56 | 14.16±2.25 | 14.04±1.97 | 13.96±1.85 | <0.001 |
| TT (s) | 18.6±8.47 | 19.93±11.69 | 18.29±7.56 | 18.31±7.32 | 17.83±5.95 | <0.001 |
| EOS (%) | 2.1±2.03 | 1.92±1.93 | 1.92±1.83 | 2.24±2.34 | 2.33±1.94 | <0.001 |
| P-LCR (%) | 27.64±24.86 | 28.19±9.05 | 28.44±47.8 | 26.95±8.08 | 26.96±7.81 | 0.12 |
| Cl(mmol/L) | 105.09±2.98 | 104.92±3.21 | 105.29±3.01 | 105.09±2.82 | 105.05±2.86 | 0.002 |
| APTT (s) | 38.9±7.35 | 40.27±9.51 | 38.3±6.85 | 38.55±6.39 | 38.43±5.87 | <0.001 |
| RDW-CV | 0.14±0.02 | 0.14±0.03 | 0.14±0.02 | 0.14±0.02 | 0.14±0.02 | <0.001 |
| RDW-SD (fl) | 44.9±5.62 | 45.68±6.18 | 44.57±5.58 | 44.76±5.25 | 44.58±5.33 | <0.001 |
| HCT (%) | 36.27±5.05 | 34.55±5.00 | 35.78±4.76 | 36.79±4.92 | 38.01±4.86 | <0.001 |
| RBC (×1012/L) | 4.03±0.64 | 3.87±0.64 | 3.99±0.62 | 4.08±0.64 | 4.19±0.63 | <0.001 |
| Glu (mmol/L) | 6.3±1.85 | 6.54±2.02 | 6.33±1.82 | 6.22±1.81 | 6.08±1.69 | <0.001 |
| PLT (×109/L) | 212.03±71.58 | 212.43±75.93 | 215.59±73.07 | 212.8±70.48 | 207.24±66.14 | 0.004 |
| FIB (g/L) | 3.74±1.00 | 3.87±0.99 | 3.75±0.99 | 3.73±1.00 | 3.6±0.98 | <0.001 |
| HGB (g/L) | 119.59±17.28 | 113.18±16.87 | 117.71±16.14 | 121.49±16.8 | 126.17±16.57 | <0.001 |
| Ca (mmol/L) | 2.23±0.12 | 2.23±0.12 | 2.23±0.12 | 2.23±0.11 | 2.22±0.12 | 0.04 |
| Na (mmol/L) | 139.21±3.19 | 139.36±3.25 | 139.34±3.36 | 139.17±2.95 | 138.97±3.15 | <0.001 |
| K (mmol/L) | 3.85±0.46 | 3.87±0.40 | 3.83±0.44 | 3.83±0.39 | 3.86±0.59 | 0.007 |
| FVC: Forced vital capacity; BMI: Body mass index; NEUT%: Neutrophil percentage; LDH: Lactate dehydrogenase; PT: Prothrombin time; TT: Thrombin time; EOS%: Eosimophil; P-LCR: Platelet-large cell ratio; Cl: Chloride; APTT: Activated partialthromboplastin time; RDW-CV: Red cell distribution width-coefficient of variation; RDW-SD: Red cell distribution width-standard deviation; HCT: Hematocrit; RBC: Red blood cell count; Glu: Glucose; PLT: Platelets; FIB: Fibrinogen; HGB: Hemoglobin; Ca: Calcium; Na: Sodium; K: Kalium | ||||||
| Variable | Overall | Q1 | Q2 | Q3 | Q4 | P |
|---|---|---|---|---|---|---|
| Sample | 7720 | 1971 | 1932 | 1904 | 1913 | |
| FEV1 (L) | 1.99±0.54 | 1.32±0.24 | 1.8±0.1 | 2.16±0.11 | 2.69±0.26 | <0.001 |
| Age (year) | 68.56±6.27 | 71.82±6.75 | 68.82±6.17 | 67.59±5.56 | 65.91±4.83 | <0.001 |
| Gender (men) | 4197 (54.4%) | 474(24%) | 728 (37.7%) | 1193 (62.7%) | 1802 (94.2%) | <0.001 |
| BMI (kg/m2) | 25.09±7.38 | 24.81±7.5 | 25.1±7.42 | 25.23±7.48 | 25.22±7.12 | 0.24 |
| Smoking | 1762 (22.8%) | 254 (12.9%) | 379(19.6%) | 462 (24.3%) | 667 (34.9%) | <0.001 |
| Drinking | 551 (7.1%) | 63 (3.2%) | 100 (5.2%) | 132 (6.9%) | 256 (13.4%) | <0.001 |
| Marital status | <0.001 | |||||
| Never married | 43 (0.6%) | 16 (0.8%) | 13 (0.7%) | 4 (0.2%) | 10 (0.5%) | |
| Married | 7127 (92.3%) | 1716 (87.1%) | 1759 (91%) | 1799 (94.5%) | 1853 (96.9%) | |
| Divorced/seperated/widowed | 550 (7.1%) | 239 (12.1%) | 160 (8.3%) | 101 (5.3%) | 50 (2.6%) | |
| Number of hospitalizations | 1.81±2.37 | 1.87±2.23 | 1.77±2.13 | 1.84±2.53 | 1.76±2.56 | 0.43 |
| Disease of respiratory system | 626 (8.1%) | 212 (10.8%) | 151 (7.8%) | 125 (6.6%) | 138 (7.2%) | <0.001 |
| Hypertention | 2559 (33.1%) | 713 (36.2%) | 645 (33.4%) | 621 (32.6%) | 580 (30.3%) | 0.002 |
| Diabetes | 1189 (15.4%) | 317 (16.1%) | 295( 15.3%) | 294 (15.4%) | 283 (14.8%) | 0.74 |
| Stroke | 392 (5.1%) | 132 (6.7%) | 98 (5.1%) | 98 (5.1%) | 64 (3.3%) | <0.001 |
| Pulmonary arterial hypertension | 271 (3.5%) | 150 (7.6%) | 67 (3.5%) | 30 (1.6%) | 24 (1.3%) | <0.001 |
| CAD | 837 (10.8%) | 238 (12.1%) | 205 (10.6%) | 200 (10.5%) | 194 (10.1%) | 0.22 |
| NEUT (%) | 70.47±8.52 | 71.11±9 | 70.74±8.48 | 70.26±8.39 | 69.73±8.1 | <0.001 |
| LDH(U/L) | 243.67±412.54 | 269.32±327.14 | 251.35±393.6 | 225.9±301.33 | 227.18±573.27 | 0.002 |
| PT (s) | 14.32±2.55 | 15.03±3.5 | 14.22±2.33 | 13.99±1.93 | 14.02±1.94 | <0.001 |
| TT (s) | 18.6±8.47 | 19.73±11.39 | 18.24±6.98 | 18.37±7.93 | 18.03±6.52 | <0.001 |
| EOS (%) | 2.1±2.03 | 2.05±2.04 | 1.95±2.2 | 2.11±1.88 | 2.3±1.96 | <0.001 |
| P-LCR (%) | 27.64±24.86 | 29.14±47.23 | 26.98±8.07 | 27.14±8.15 | 27.25±7.86 | 0.02 |
| Cl (mmol/L) | 105.09±2.98 | 104.84±3.2 | 105.25±3.04 | 105.18±2.78 | 105.09±2.88 | <0.001 |
| APTT (s) | 38.9±7.35 | 40.38±9.38 | 38.4±6.8 | 38.35±6.37 | 38.41±6.11 | <0.001 |
| RDW-CV | 0.14±0.02 | 0.14±0.03 | 0.14±0.02 | 0.14±0.02 | 0.14±0.02 | <0.001 |
| RDW-SD (fl) | 44.9±5.62 | 45.86±6.32 | 44.72±5.56 | 44.62±5.19 | 44.4±5.19 | <0.001 |
| HCT (%) | 36.27±5.05 | 34.59±5.08 | 35.77±4.85 | 36.73±4.88 | 38.06±4.73 | <0.001 |
| RBC (×1012/L) | 4.03±0.64 | 3.86±0.65 | 4±0.64 | 4.06±0.62 | 4.21±0.62 | <0.001 |
| Glu (mmol/L) | 6.3±1.85 | 6.46±1.99 | 6.4±1.82 | 6.18±1.8 | 6.14±1.76 | <0.001 |
| PLT (×109/L) | 212.03±71.58 | 212.39±77.02 | 218.53±74.39 | 212.34±67.7 | 204.77±65.79 | <0.001 |
| FIB (g/L) | 3.74±1 | 3.88±0.99 | 3.79±1.02 | 3.7±0.97 | 3.58±0.98 | <0.001 |
| HGB (g/L) | 119.59±17.28 | 113.27±17.11 | 117.66±16.38 | 121.39±16.72 | 126.26±16.17 | <0.001 |
| Ca (mmol/L) | 2.23±0.12 | 2.23±0.12 | 2.23±0.11 | 2.23±0.12 | 2.22±0.11 | 0.29 |
| Na (mmol/L) | 139.21±3.19 | 139.22±3.18 | 139.36±3.42 | 139.23±2.9 | 139.03±3.22 | 0.01 |
| K (mmol/L) | 3.85±0.46 | 3.87±0.4 | 3.83±0.4 | 3.83±0.42 | 3.86±0.6 | 0.01 |
| FEV1: Forced expiratory volume in the first second; BMI: Body mass index; NEUT%: Neutrophil percentage; LDH: Lactate dehydrogenase; PT: Prothrombin time; TT: Thrombin time; EOS%: Eosimophil; P-LCR: Platelet-large cell ratio; Cl: chloride; APTT: Activated partialthromboplastin time; RDW-CV: Red cell distribution width-coefficient of variation; RDW-SD: Red cell distribution width-standard deviation; HCT: Hematocrit; RBC: Red blood cell count; Glu: Glucose; PLT: Platelets; FIB: Fibrinogen; HGB: Hemoglobin; Ca: Calcium; Na: Sodium; K: Kalium. | ||||||
Tab.3 Baseline characteristics of the participants stratified by the quartiles of forced expiratory volume in 1 second (FEV1)
| Variable | Overall | Q1 | Q2 | Q3 | Q4 | P |
|---|---|---|---|---|---|---|
| Sample | 7720 | 1971 | 1932 | 1904 | 1913 | |
| FEV1 (L) | 1.99±0.54 | 1.32±0.24 | 1.8±0.1 | 2.16±0.11 | 2.69±0.26 | <0.001 |
| Age (year) | 68.56±6.27 | 71.82±6.75 | 68.82±6.17 | 67.59±5.56 | 65.91±4.83 | <0.001 |
| Gender (men) | 4197 (54.4%) | 474(24%) | 728 (37.7%) | 1193 (62.7%) | 1802 (94.2%) | <0.001 |
| BMI (kg/m2) | 25.09±7.38 | 24.81±7.5 | 25.1±7.42 | 25.23±7.48 | 25.22±7.12 | 0.24 |
| Smoking | 1762 (22.8%) | 254 (12.9%) | 379(19.6%) | 462 (24.3%) | 667 (34.9%) | <0.001 |
| Drinking | 551 (7.1%) | 63 (3.2%) | 100 (5.2%) | 132 (6.9%) | 256 (13.4%) | <0.001 |
| Marital status | <0.001 | |||||
| Never married | 43 (0.6%) | 16 (0.8%) | 13 (0.7%) | 4 (0.2%) | 10 (0.5%) | |
| Married | 7127 (92.3%) | 1716 (87.1%) | 1759 (91%) | 1799 (94.5%) | 1853 (96.9%) | |
| Divorced/seperated/widowed | 550 (7.1%) | 239 (12.1%) | 160 (8.3%) | 101 (5.3%) | 50 (2.6%) | |
| Number of hospitalizations | 1.81±2.37 | 1.87±2.23 | 1.77±2.13 | 1.84±2.53 | 1.76±2.56 | 0.43 |
| Disease of respiratory system | 626 (8.1%) | 212 (10.8%) | 151 (7.8%) | 125 (6.6%) | 138 (7.2%) | <0.001 |
| Hypertention | 2559 (33.1%) | 713 (36.2%) | 645 (33.4%) | 621 (32.6%) | 580 (30.3%) | 0.002 |
| Diabetes | 1189 (15.4%) | 317 (16.1%) | 295( 15.3%) | 294 (15.4%) | 283 (14.8%) | 0.74 |
| Stroke | 392 (5.1%) | 132 (6.7%) | 98 (5.1%) | 98 (5.1%) | 64 (3.3%) | <0.001 |
| Pulmonary arterial hypertension | 271 (3.5%) | 150 (7.6%) | 67 (3.5%) | 30 (1.6%) | 24 (1.3%) | <0.001 |
| CAD | 837 (10.8%) | 238 (12.1%) | 205 (10.6%) | 200 (10.5%) | 194 (10.1%) | 0.22 |
| NEUT (%) | 70.47±8.52 | 71.11±9 | 70.74±8.48 | 70.26±8.39 | 69.73±8.1 | <0.001 |
| LDH(U/L) | 243.67±412.54 | 269.32±327.14 | 251.35±393.6 | 225.9±301.33 | 227.18±573.27 | 0.002 |
| PT (s) | 14.32±2.55 | 15.03±3.5 | 14.22±2.33 | 13.99±1.93 | 14.02±1.94 | <0.001 |
| TT (s) | 18.6±8.47 | 19.73±11.39 | 18.24±6.98 | 18.37±7.93 | 18.03±6.52 | <0.001 |
| EOS (%) | 2.1±2.03 | 2.05±2.04 | 1.95±2.2 | 2.11±1.88 | 2.3±1.96 | <0.001 |
| P-LCR (%) | 27.64±24.86 | 29.14±47.23 | 26.98±8.07 | 27.14±8.15 | 27.25±7.86 | 0.02 |
| Cl (mmol/L) | 105.09±2.98 | 104.84±3.2 | 105.25±3.04 | 105.18±2.78 | 105.09±2.88 | <0.001 |
| APTT (s) | 38.9±7.35 | 40.38±9.38 | 38.4±6.8 | 38.35±6.37 | 38.41±6.11 | <0.001 |
| RDW-CV | 0.14±0.02 | 0.14±0.03 | 0.14±0.02 | 0.14±0.02 | 0.14±0.02 | <0.001 |
| RDW-SD (fl) | 44.9±5.62 | 45.86±6.32 | 44.72±5.56 | 44.62±5.19 | 44.4±5.19 | <0.001 |
| HCT (%) | 36.27±5.05 | 34.59±5.08 | 35.77±4.85 | 36.73±4.88 | 38.06±4.73 | <0.001 |
| RBC (×1012/L) | 4.03±0.64 | 3.86±0.65 | 4±0.64 | 4.06±0.62 | 4.21±0.62 | <0.001 |
| Glu (mmol/L) | 6.3±1.85 | 6.46±1.99 | 6.4±1.82 | 6.18±1.8 | 6.14±1.76 | <0.001 |
| PLT (×109/L) | 212.03±71.58 | 212.39±77.02 | 218.53±74.39 | 212.34±67.7 | 204.77±65.79 | <0.001 |
| FIB (g/L) | 3.74±1 | 3.88±0.99 | 3.79±1.02 | 3.7±0.97 | 3.58±0.98 | <0.001 |
| HGB (g/L) | 119.59±17.28 | 113.27±17.11 | 117.66±16.38 | 121.39±16.72 | 126.26±16.17 | <0.001 |
| Ca (mmol/L) | 2.23±0.12 | 2.23±0.12 | 2.23±0.11 | 2.23±0.12 | 2.22±0.11 | 0.29 |
| Na (mmol/L) | 139.21±3.19 | 139.22±3.18 | 139.36±3.42 | 139.23±2.9 | 139.03±3.22 | 0.01 |
| K (mmol/L) | 3.85±0.46 | 3.87±0.4 | 3.83±0.4 | 3.83±0.42 | 3.86±0.6 | 0.01 |
| FEV1: Forced expiratory volume in the first second; BMI: Body mass index; NEUT%: Neutrophil percentage; LDH: Lactate dehydrogenase; PT: Prothrombin time; TT: Thrombin time; EOS%: Eosimophil; P-LCR: Platelet-large cell ratio; Cl: chloride; APTT: Activated partialthromboplastin time; RDW-CV: Red cell distribution width-coefficient of variation; RDW-SD: Red cell distribution width-standard deviation; HCT: Hematocrit; RBC: Red blood cell count; Glu: Glucose; PLT: Platelets; FIB: Fibrinogen; HGB: Hemoglobin; Ca: Calcium; Na: Sodium; K: Kalium. | ||||||
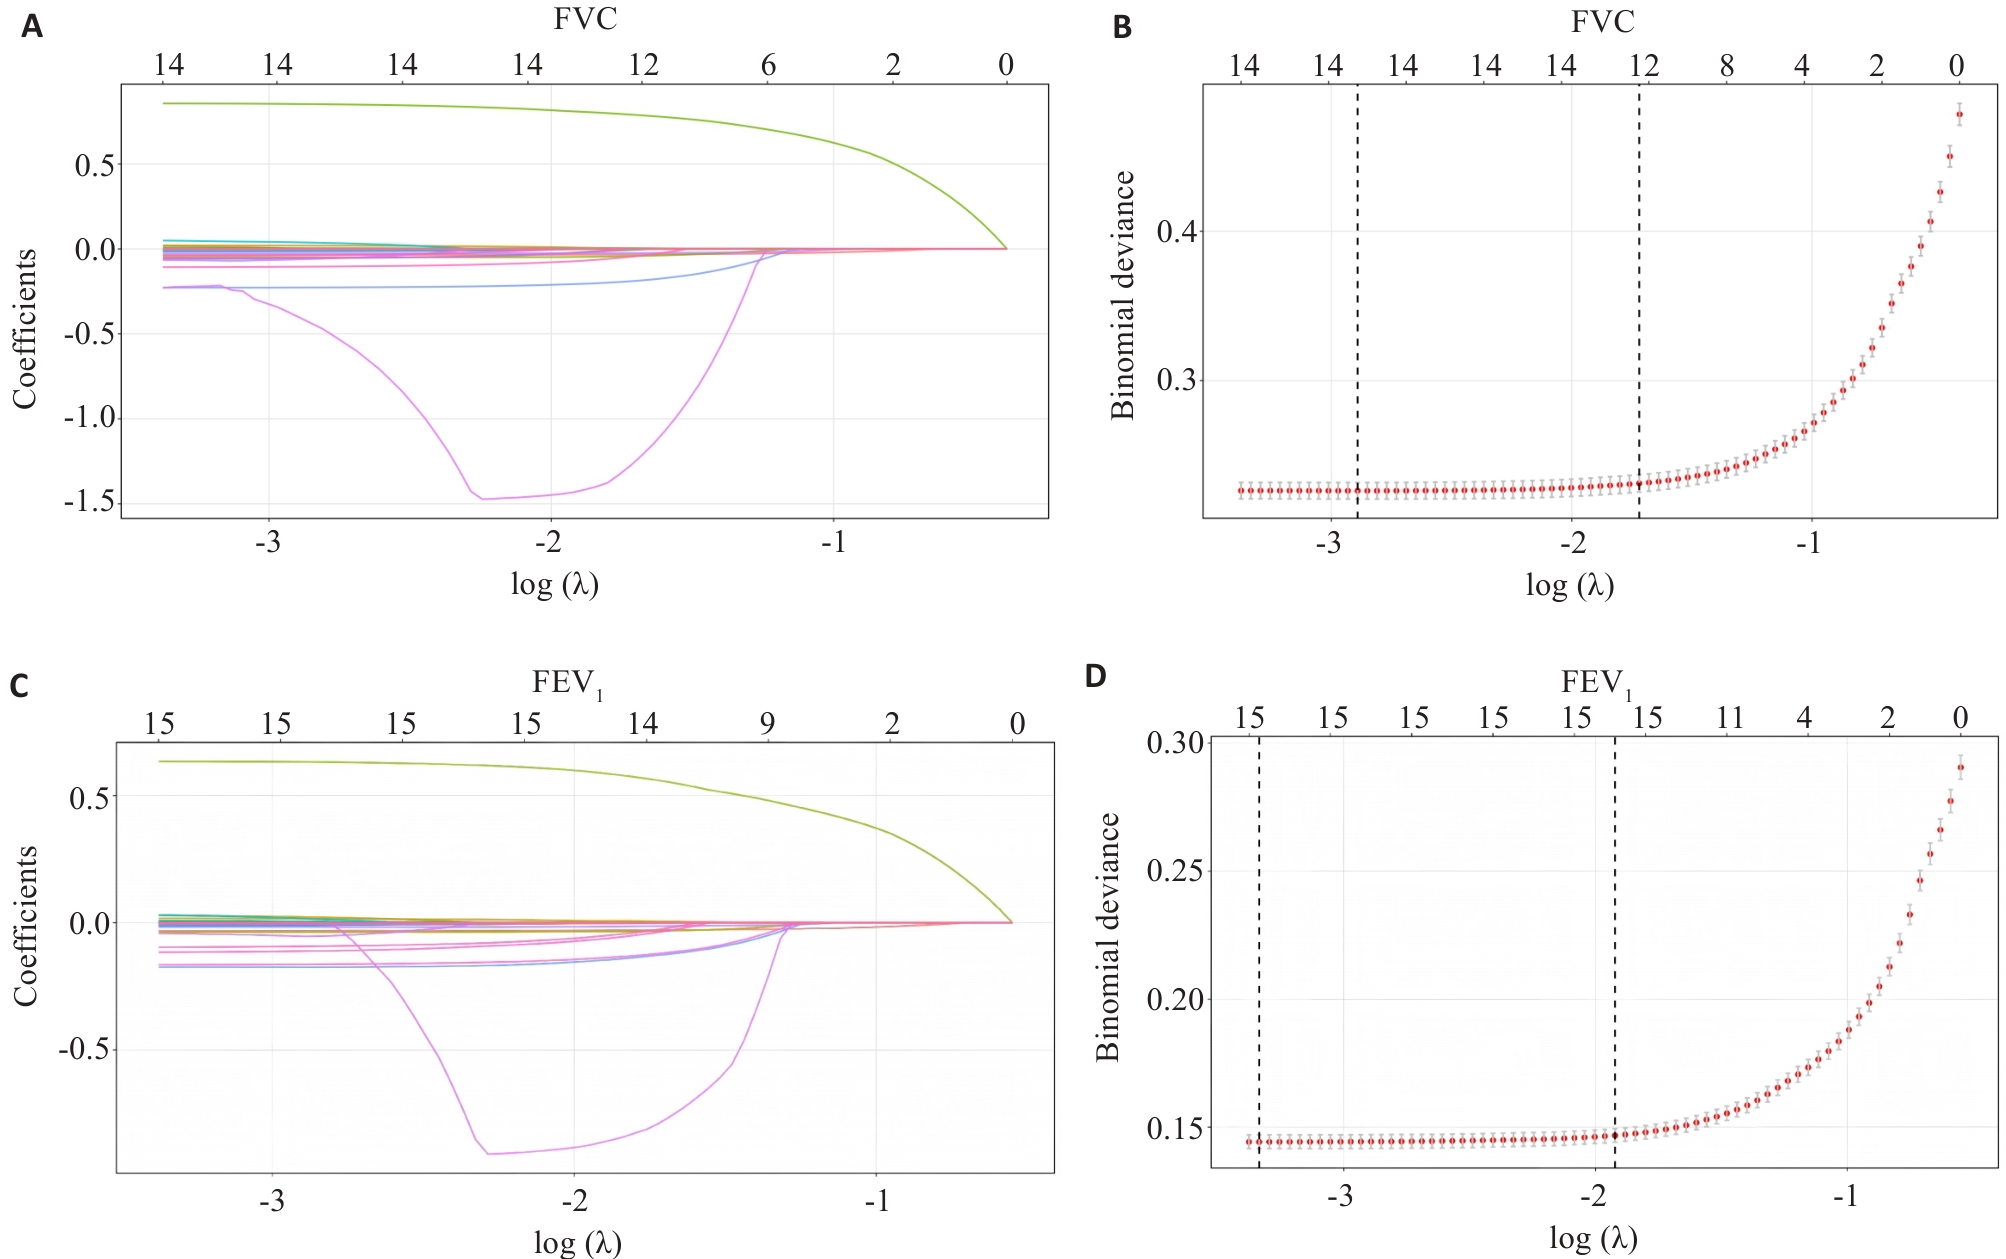
Fig.1 LASSO regression screening of predictive variables and selection of the optimal parameters λ. A: LASSO regression coefficient trajectory plot for FVC. B: Binomial deviance plot for optimal λ selection in LASSO regression (FVC). C: LASSO regression coefficient trajectory plot for FEV1. D: Binomial deviance plot for optimal λ selection in LASSO regression (FEV1).
| Model | r | ICC | MSE | RMSE | MAE |
|---|---|---|---|---|---|
| FVC | |||||
| LR | 0.728 | 0.695 | 0.212 | 0.461 | 0.365 |
| RF | 0.727 | 0.691 | 0.213 | 0.462 | 0.366 |
| XGBoost | 0.733 | 0.694 | 0.210 | 0.459 | 0.364 |
| GBM | 0.728 | 0.692 | 0.211 | 0.460 | 0.364 |
| SVR | 0.721 | 0.694 | 0.218 | 0.467 | 0.368 |
| FEV1 | |||||
| LR | 0.709 | 0.666 | 0.141 | 0.376 | 0.292 |
| RF | 0.701 | 0.659 | 0.140 | 0.374 | 0.293 |
| XGBoost | 0.711 | 0.668 | 0.136 | 0.369 | 0.291 |
| GBM | 0.708 | 0.665 | 0.142 | 0.380 | 0.296 |
| SVR | 0.688 | 0.662 | 0.146 | 0.382 | 0.297 |
| ICC: Intraclass correlation coefficient; MSE: Mean squared error; RMSE: Root mean square error; MAE: Mean absolute error; LR: Linear regression; RF: Random forest; XGBoost: Extreme gradient boosting; GBM: Gradient boosting machine; SVR: Support vector regression. | |||||
Tab.4 Performance comparison of the 5 models for predicting FVC and FEV1 (imputed dataset)
| Model | r | ICC | MSE | RMSE | MAE |
|---|---|---|---|---|---|
| FVC | |||||
| LR | 0.728 | 0.695 | 0.212 | 0.461 | 0.365 |
| RF | 0.727 | 0.691 | 0.213 | 0.462 | 0.366 |
| XGBoost | 0.733 | 0.694 | 0.210 | 0.459 | 0.364 |
| GBM | 0.728 | 0.692 | 0.211 | 0.460 | 0.364 |
| SVR | 0.721 | 0.694 | 0.218 | 0.467 | 0.368 |
| FEV1 | |||||
| LR | 0.709 | 0.666 | 0.141 | 0.376 | 0.292 |
| RF | 0.701 | 0.659 | 0.140 | 0.374 | 0.293 |
| XGBoost | 0.711 | 0.668 | 0.136 | 0.369 | 0.291 |
| GBM | 0.708 | 0.665 | 0.142 | 0.380 | 0.296 |
| SVR | 0.688 | 0.662 | 0.146 | 0.382 | 0.297 |
| ICC: Intraclass correlation coefficient; MSE: Mean squared error; RMSE: Root mean square error; MAE: Mean absolute error; LR: Linear regression; RF: Random forest; XGBoost: Extreme gradient boosting; GBM: Gradient boosting machine; SVR: Support vector regression. | |||||
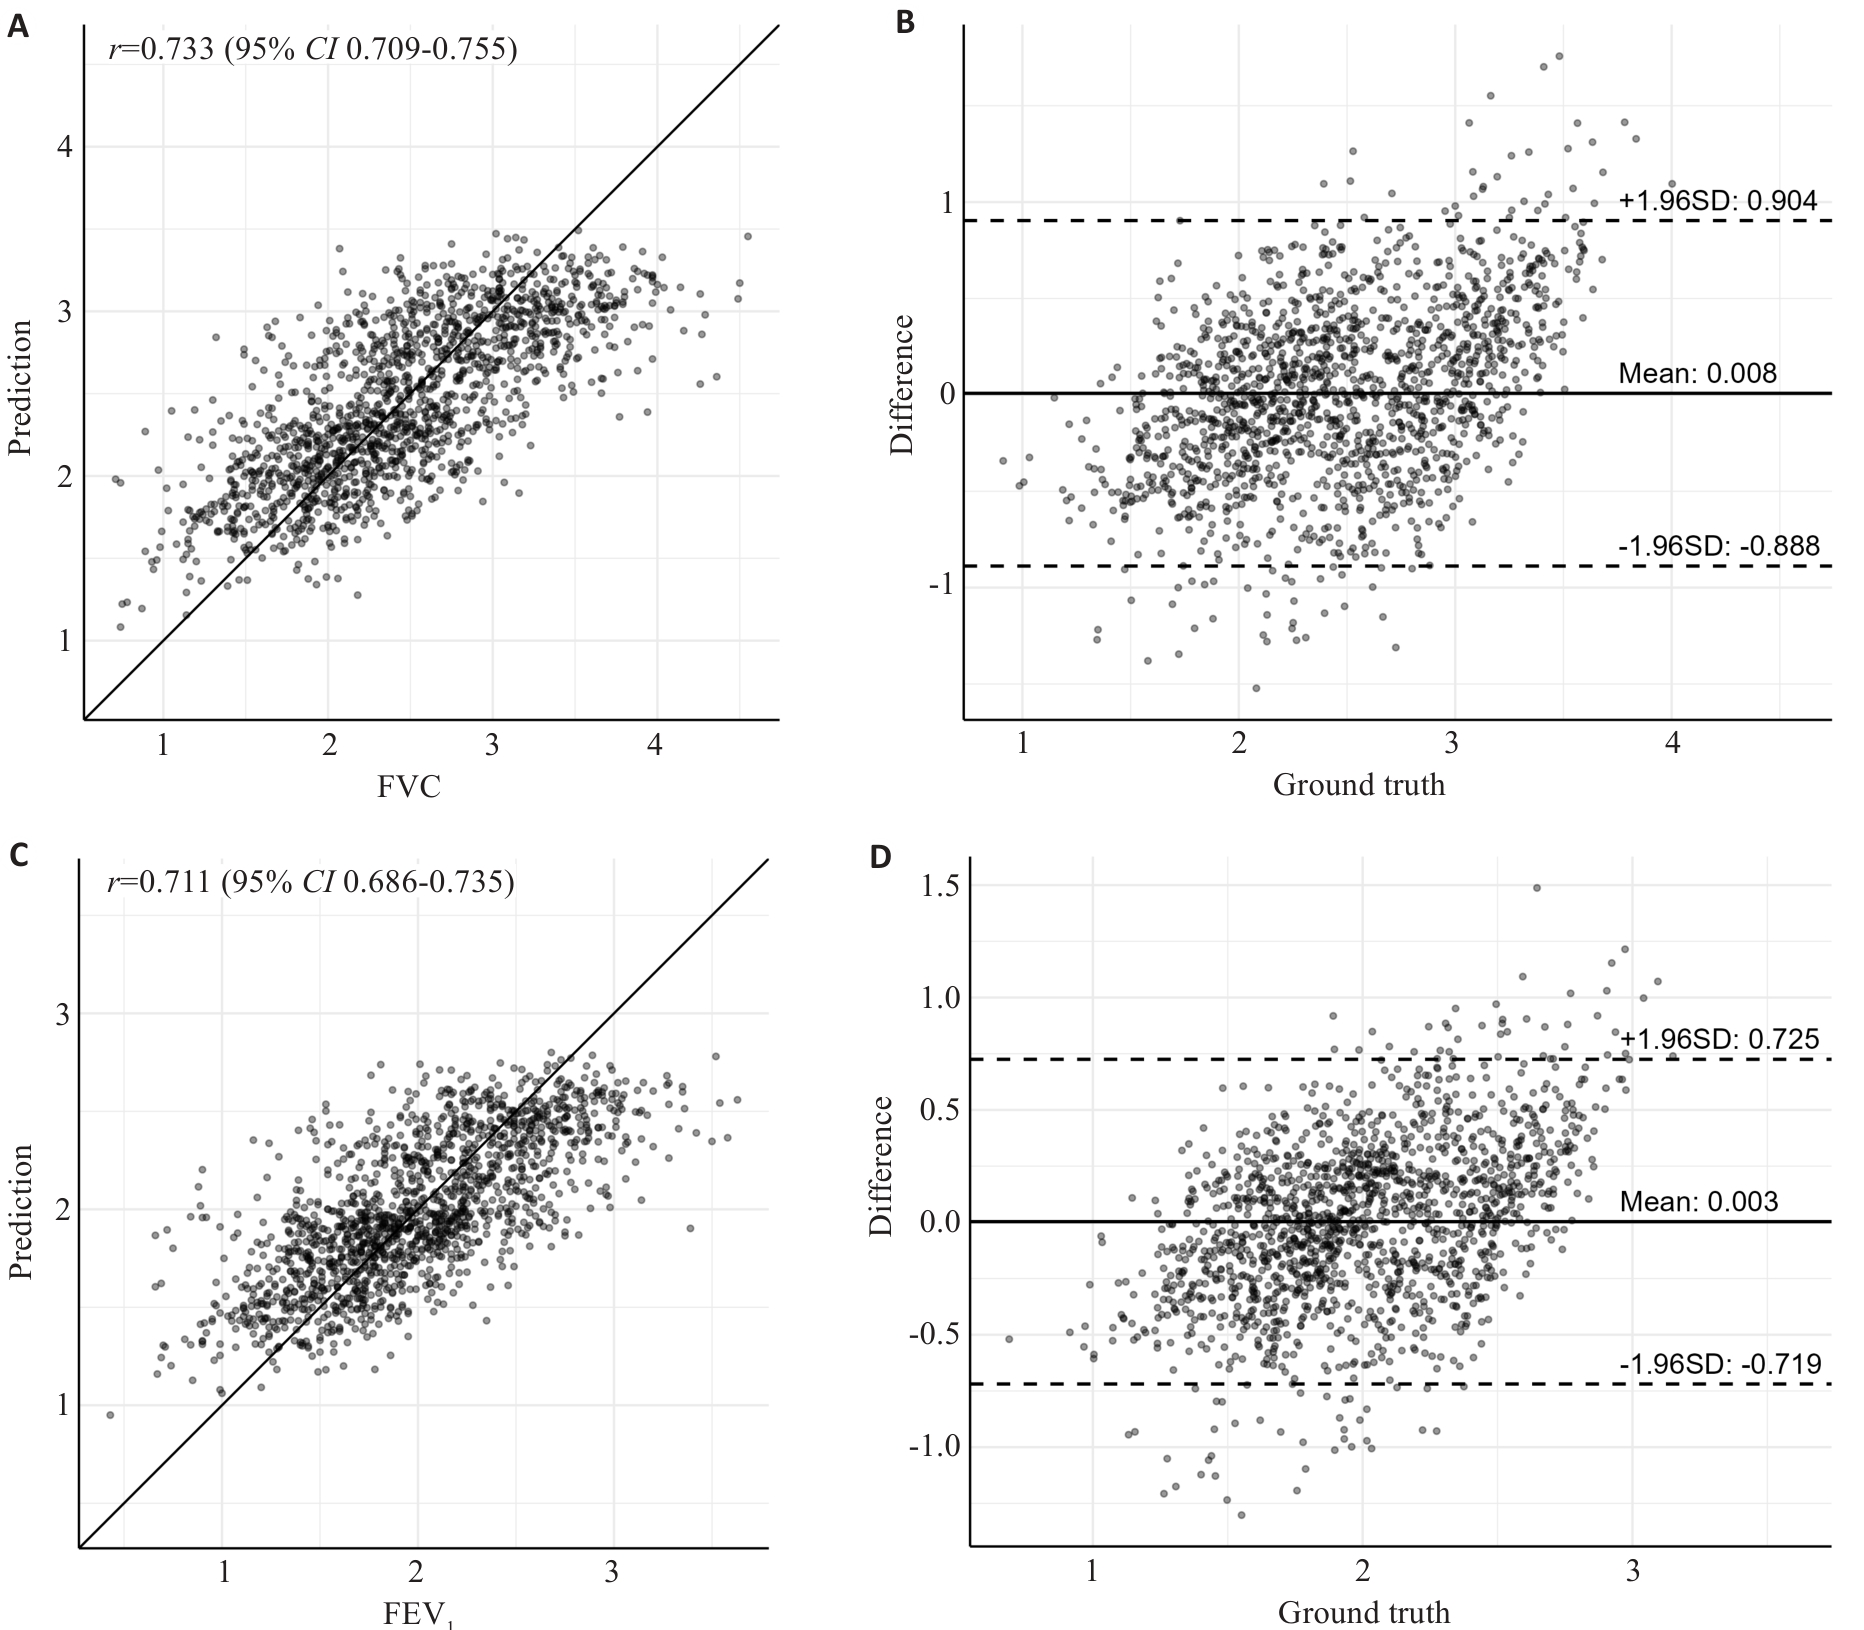
Fig.2 Performance of XGBoost model for predicting FVC and FEV1. A: Scatter plot of predicted vs measured FVC. B: Bland-Altman plot of FVC predictions. C: Scatter plot of predicted vs measured FEV1. D: Bland-Altman plot of FEV1 predictions.
| Model | r | ICC | MSE | RMSE | MAE |
|---|---|---|---|---|---|
| FVC | |||||
| LR | 0.677 | 0.639 | 0.264 | 0.514 | 0.399 |
| RF | 0.674 | 0.595 | 0.268 | 0.518 | 0.403 |
| XGBoost | 0.668 | 0.621 | 0.269 | 0.519 | 0.403 |
| GBM | 0.671 | 0.628 | 0.268 | 0.517 | 0.402 |
| SVR | 0.659 | 0.636 | 0.281 | 0.530 | 0.410 |
| FEV1 | |||||
| LR | 0.695 | 0.655 | 0.149 | 0.386 | 0.304 |
| RF | 0.679 | 0.634 | 0.155 | 0.394 | 0.312 |
| XGBoost | 0.683 | 0.633 | 0.154 | 0.39 | 0.311 |
| GBM | 0.685 | 0.639 | 0.153 | 0.391 | 0.308 |
| SVR | 0.700 | 0.668 | 0.147 | 0.384 | 0.304 |
| FVC: Forced vital capacity; FEV1: Forced expiratory volume in the first second; ICC: Intraclass correlation coefficient; MSE: Mean squared error;RMSE: Root mean square error; MAE: Mean absolute error; LR: Linear regression; RF: Random forest; XGBoost: eXtreme gradient boosting; GBM: Gradient boosting machine; SVR: Support vector regression. | |||||
Tab.5 Performance comparison of the 5 models for predicting FVC and FEV1 (complete dataset)
| Model | r | ICC | MSE | RMSE | MAE |
|---|---|---|---|---|---|
| FVC | |||||
| LR | 0.677 | 0.639 | 0.264 | 0.514 | 0.399 |
| RF | 0.674 | 0.595 | 0.268 | 0.518 | 0.403 |
| XGBoost | 0.668 | 0.621 | 0.269 | 0.519 | 0.403 |
| GBM | 0.671 | 0.628 | 0.268 | 0.517 | 0.402 |
| SVR | 0.659 | 0.636 | 0.281 | 0.530 | 0.410 |
| FEV1 | |||||
| LR | 0.695 | 0.655 | 0.149 | 0.386 | 0.304 |
| RF | 0.679 | 0.634 | 0.155 | 0.394 | 0.312 |
| XGBoost | 0.683 | 0.633 | 0.154 | 0.39 | 0.311 |
| GBM | 0.685 | 0.639 | 0.153 | 0.391 | 0.308 |
| SVR | 0.700 | 0.668 | 0.147 | 0.384 | 0.304 |
| FVC: Forced vital capacity; FEV1: Forced expiratory volume in the first second; ICC: Intraclass correlation coefficient; MSE: Mean squared error;RMSE: Root mean square error; MAE: Mean absolute error; LR: Linear regression; RF: Random forest; XGBoost: eXtreme gradient boosting; GBM: Gradient boosting machine; SVR: Support vector regression. | |||||
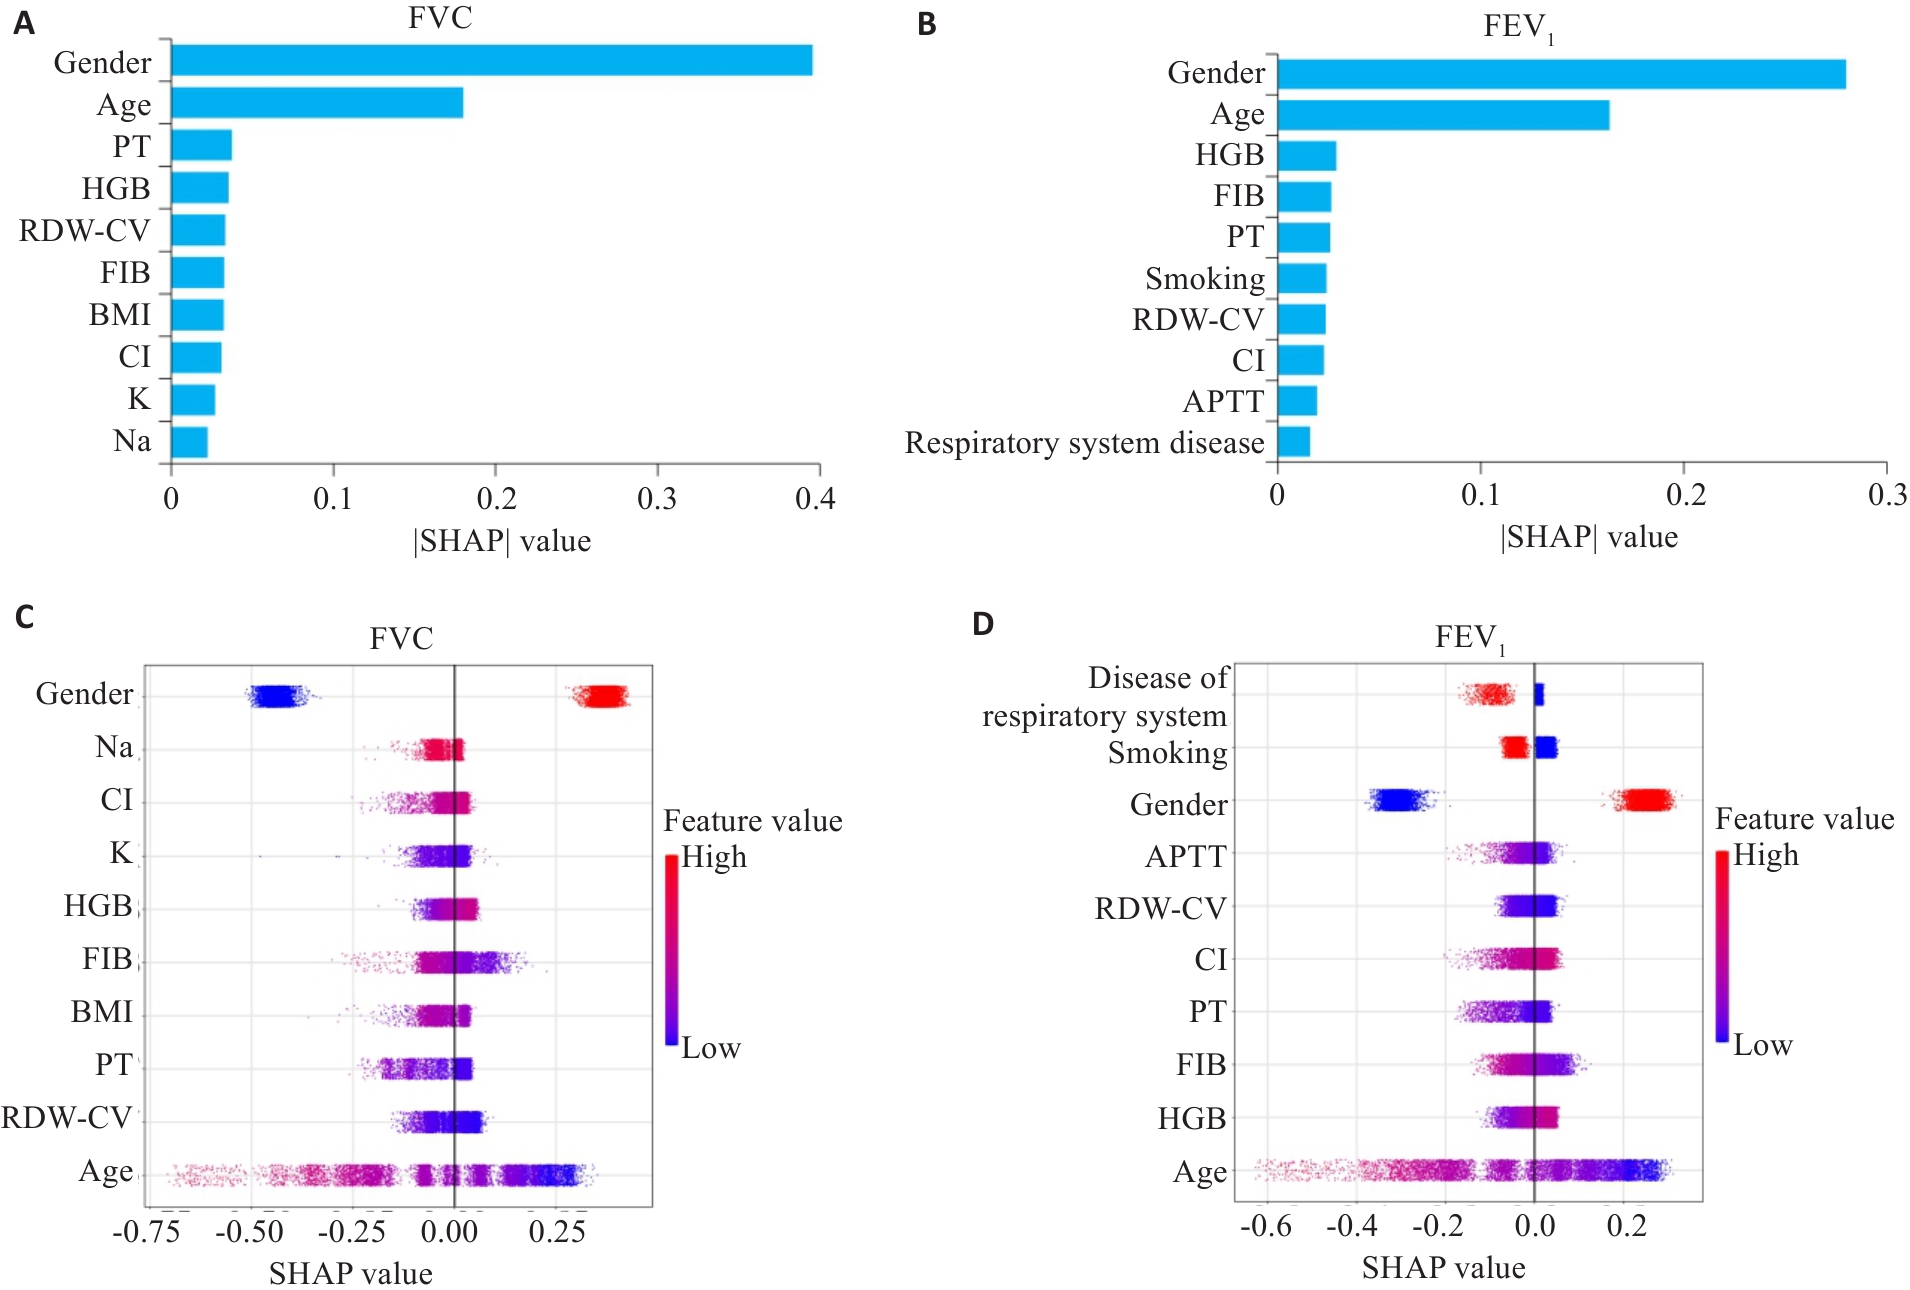
Fig.3 Feature importance and beeswarm plots of the XGBoost model. A: Feature importance bar plot of FVC. B: Feature importance bar plot of FEV1. C: Beeswarm plots of FVC. D: Beeswarm plots of FEV1.
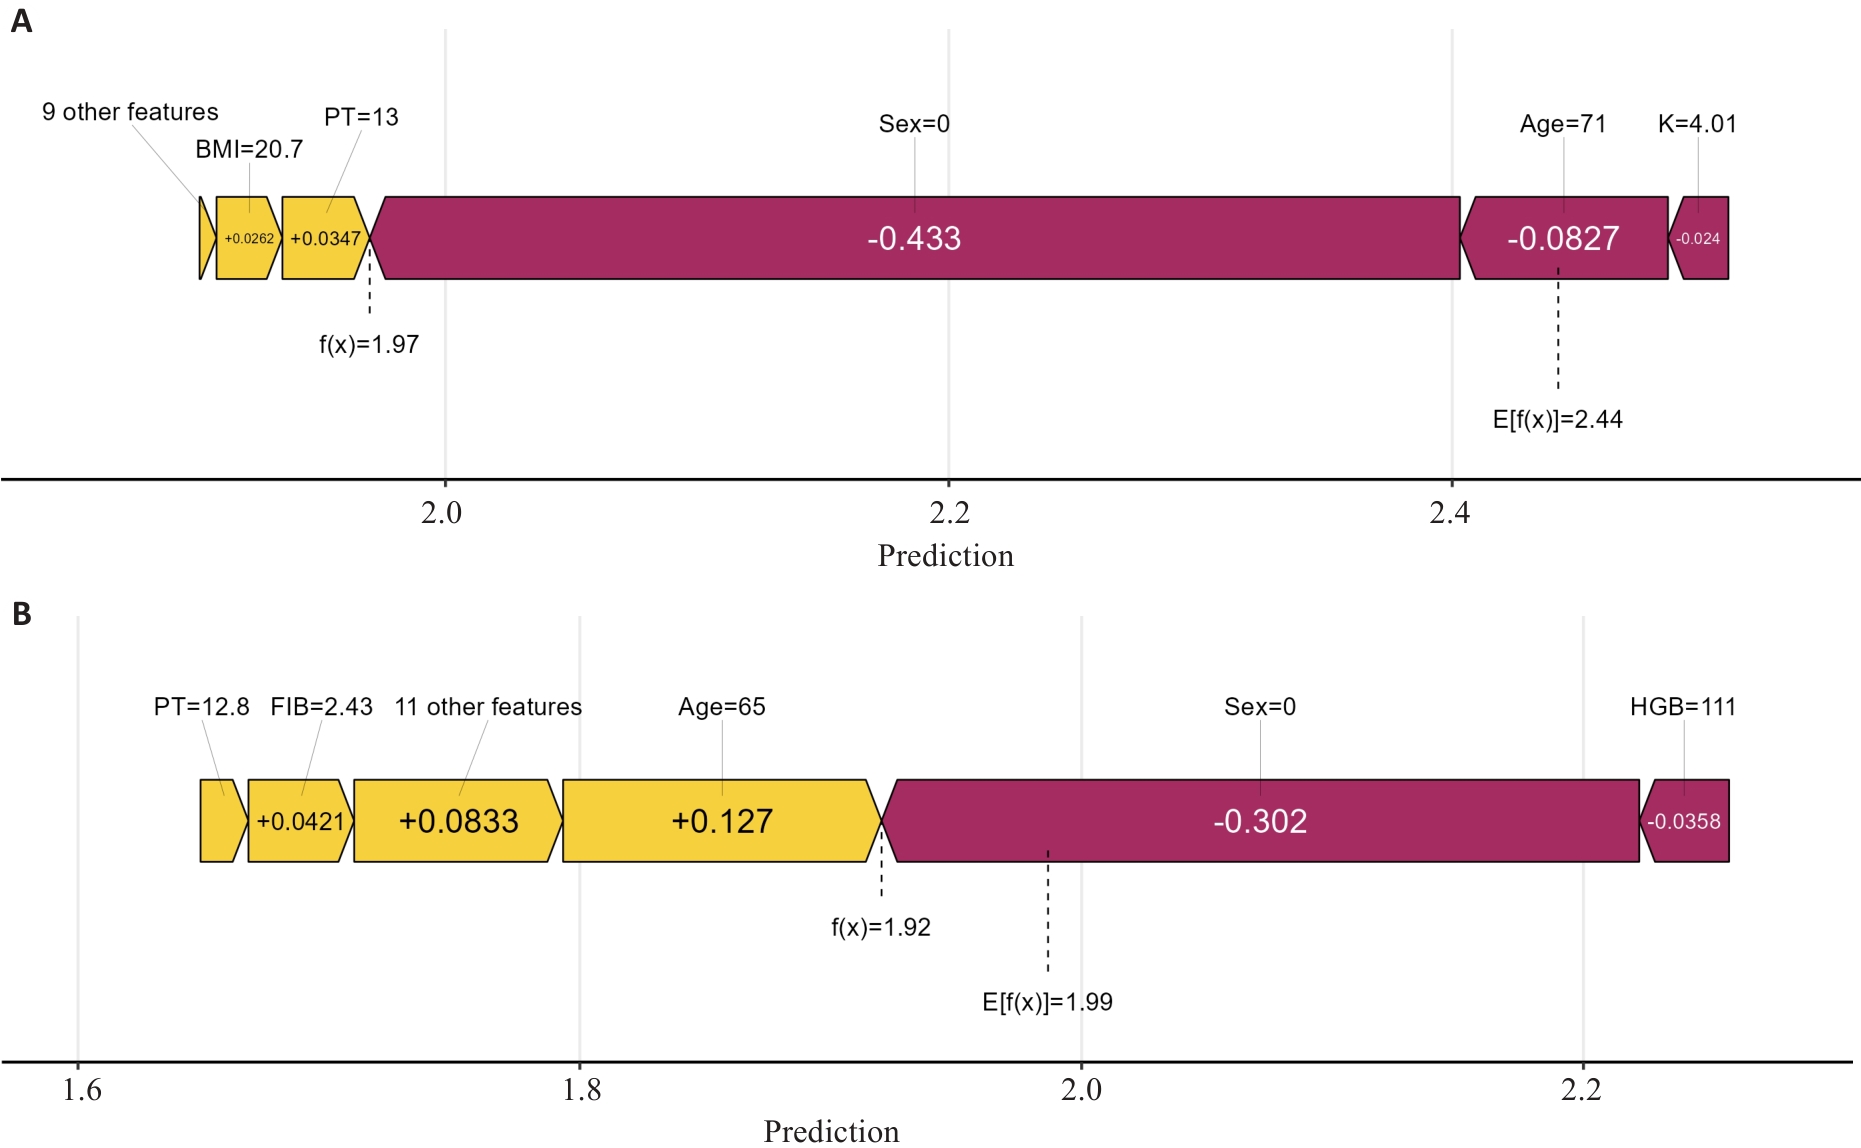
Fig.4 SHAP force plot of XGBoost model for predicting FVC and FEV1 (single sample explanation). A: SHAP contribution decomposition for FVC prediction. B: SHAP contribution decomposition for FEV1 prediction.
| Index | Cut-off values (%) | Sensitivity | Specificity | AUC |
|---|---|---|---|---|
| Clinical cut-off value | ||||
| FVC% | 80 | 0.540 | 0.740 | 0.688 |
| FEV1% | 80 | 0.440 | 0.809 | 0.688 |
| Model cut-off value | ||||
| FVC% | 82.93 | 0.645 | 0.645 | 0.700 |
| FEV1% | 85.46 | 0.651 | 0.651 | 0.706 |
Tab.6 Risk prediction performance of XGBoost
| Index | Cut-off values (%) | Sensitivity | Specificity | AUC |
|---|---|---|---|---|
| Clinical cut-off value | ||||
| FVC% | 80 | 0.540 | 0.740 | 0.688 |
| FEV1% | 80 | 0.440 | 0.809 | 0.688 |
| Model cut-off value | ||||
| FVC% | 82.93 | 0.645 | 0.645 | 0.700 |
| FEV1% | 85.46 | 0.651 | 0.651 | 0.706 |
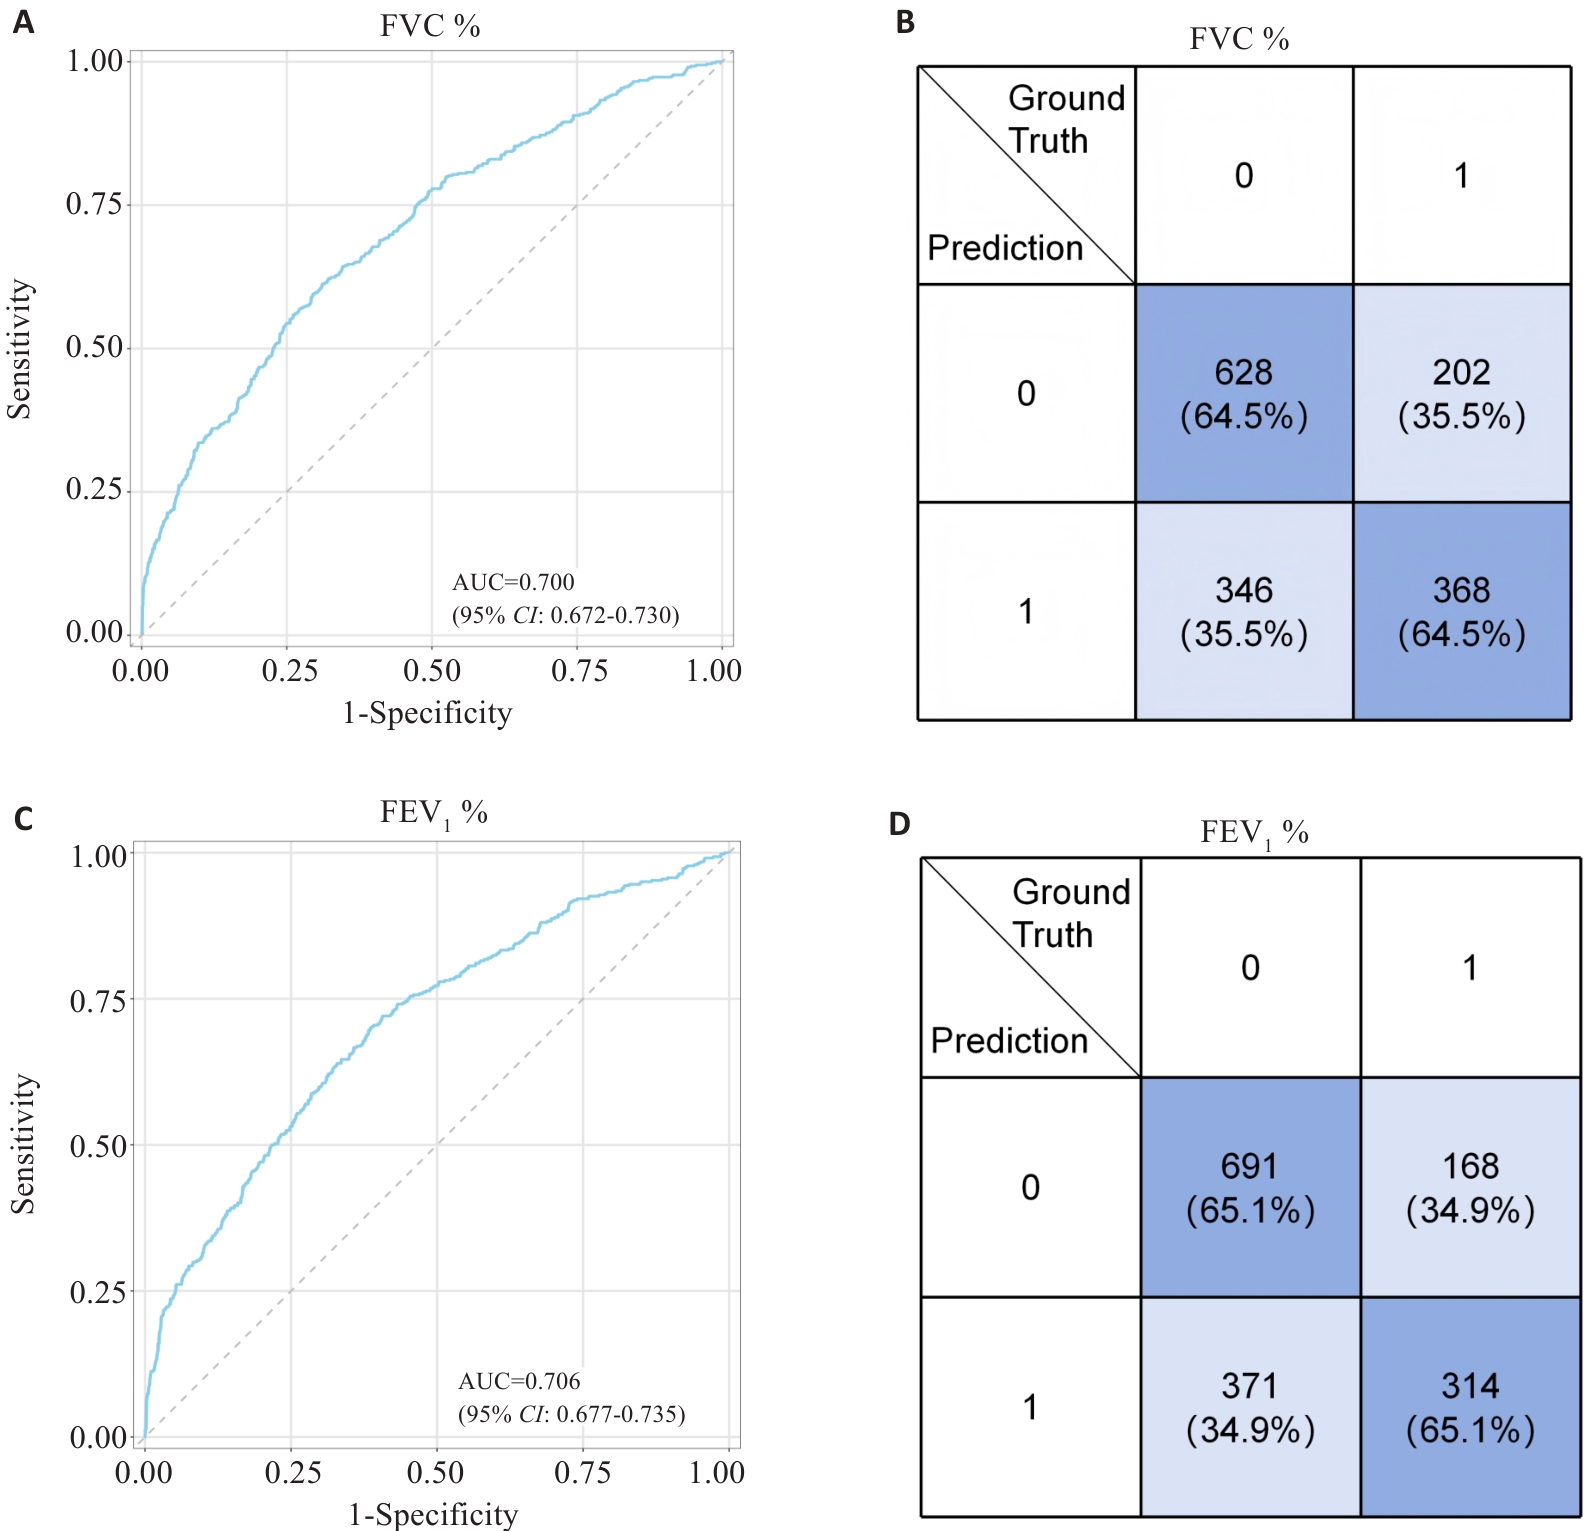
Fig.5 ROC and Confusion matrix based on XGBoost. A: ROC of FVC%. B: Confusion matrix of FVC%. C: ROC of FEV1%. D: Confusion matrix of FEV1%.
| [1] | 国家统计局,国务院第七次全国人口普查领导小组办公室. 第七次全国人口普查公报(第五号)[EB/OL].(2021-05-11)[2025-01-08] [Z]. |
| [2] | Ding YQ, Hu JC, Yu CQ, et al. Spirometric pattern and cardiovascular risk: a prospective study of 0.3 million Chinese never-smokers [J]. Lancet Reg Health West Pac, 2025, 54: 101274. |
| [3] | Grande G, Li YJ, Trevisan C, et al. Lung function in relation to brain aging and cognitive transitions in older adults: a population-based cohort study[J]. Alzheimers Dement, 2024, 20(8): 5662-73. doi:10.1002/alz.14079 |
| [4] | Backman H, Sawalha S, Nilsson U, et al. All-cause and cause-specific mortality by spirometric pattern and sex–a population-based cohort study[J]. Ther Adv Respir Dis, 2024, 18: 17534666241232768. doi:10.1177/17534666241232768 |
| [5] | Kokkinos P, Faselis C, Samuel IBH, et al. Cardiorespiratory fitness and mortality risk across the spectra of age, race, and sex[J]. J Am Coll Cardiol, 2022, 80(6): 598-609. doi:10.1016/j.jacc.2022.05.031 |
| [6] | Dehondt V, Vauterin D, Derom E, et al. Association of timely spirometry with lower all-cause mortality a nationwide obstructive cohort study[J]. CHEST, 2025, 168(3): 602-12. doi:10.1016/j.chest.2025.03.018 |
| [7] | 中华医学会健康管理学分会, 中华健康管理学杂志编委会. 健康管理概念与学科体系的中国专家初步共识[J]. 中华健康管理学杂志, 2009, 3(3): 141-7. |
| [8] | Maheshwari R, Singh A, Chaudhari PS, et al. Impulse oscillometry: an adjunct or alternative to spirometry in the diagnosis of obstructive airway disease. Results from an observational study[J]. Indian J Tuberc, 2026, 73(1): 21-4. doi:10.1016/j.ijtb.2025.01.007 |
| [9] | Lynch CJ, Liston C. New machine-learning technologies for computer-aided diagnosis[J]. Nat Med, 2018, 24(9): 1304-5. doi:10.1038/s41591-018-0178-4 |
| [10] | Zhang BY, Sun D, Niu HT, et al. Development of a prediction model to identify undiagnosed chronic obstructive pulmonary disease patients in primary care settings in China[J]. Chin Med J, 2023, 136(6): 676-82. doi:10.1097/cm9.0000000000002448 |
| [11] | Wu XN, Yin CS, Chen XQ, et al. Idiopathic pulmonary fibrosis mortality risk prediction based on artificial intelligence: the CTPF model[J]. Front Pharmacol, 2022, 13: 878764. doi:10.3389/fphar.2022.878764 |
| [12] | 中华医学会呼吸病学分会肺功能专业组. 肺功能检查指南(第二部分)––肺量计检查[J]. 中华结核和呼吸杂志, 2014, 37(07): 481-6. doi:10.3760/cma.j.issn.1001-0939.2014.07.001 |
| [13] | Graham BL, Steenbruggen I, Miller MR, et al. Standardization of spirometry 2019 update. an official American thoracic society and European respiratory society technical statement[J]. Am J Respir Crit Care Med, 2019, 200(8): e70-88. doi:10.1164/rccm.201908-1590st |
| [14] | Global Initiative for Chronic Obstructive Lung Disease. Global Strategy for the Diagnosis, Management, and Prevention of Chronic Obstructive Pulmonary Disease: 2026 Report [R]. Global Initiative for Chronic Obstructive Lung Disease, 2025. |
| [15] | Fernández-Blázquez MA, Ruiz-Sánchez de León JM, Sanz-Blasco R, et al. XGBoost models based on non imaging features for the prediction of mild cognitive impairment in older adults[J]. Sci Rep, 2025, 15(1): 29732. doi:10.1038/s41598-025-14832-0 |
| [16] | Inoue T, Ichikawa D, Ueno T, et al. XGBoost, a machine learning method, predicts neurological recovery in patients with cervical spinal cord injury[J]. Neurotrauma Rep, 2020, 1(1): 8-16. doi:10.1089/neur.2020.0009 |
| [17] | Schindele A, Krebold A, Heiß U, et al. Interpretable machine learning for thyroid cancer recurrence predicton: Leveraging XGBoost and SHAP analysis[J]. Eur J Radiol, 2025, 186: 112049. doi:10.1016/j.ejrad.2025.112049 |
| [18] | Dominelli PB, Molgat-Seon Y. Sex, gender and the pulmonary physiology of exercise[J]. Eur Respir Rev, 2022, 31(163): 210074. doi:10.1183/16000617.0074-2021 |
| [19] | Wang C, Xu JY, Yang L, et al. Prevalence and risk factors of chronic obstructive pulmonary disease in China (the China Pulmonary Health [CPH] study): a national cross-sectional study[J]. Lancet, 2018, 391(10131): 1706-17. doi:10.1016/s0140-6736(18)30841-9 |
| [20] | Chen SM, Kuhn M, Prettner K, et al. The global economic burden of chronic obstructive pulmonary disease for 204 countries and territories in 2020-50: a health-augmented macroeconomic modelling study[J]. Lancet Glob Health, 2023, 11(8): e1183-93. doi:10.1016/s2214-109x(23)00217-6 |
| [21] | Adeloye D, Song PG, Zhu YJ, et al. Global, regional, and national prevalence of, and risk factors for, chronic obstructive pulmonary disease (COPD) in 2019: a systematic review and modelling analysis[J]. Lancet Respir Med, 2022, 10(5): 447-58. doi:10.1016/s2213-2600(21)00511-7 |
| [22] | 刘 领, 吴文杰, 杨 霁, 等. 慢性阻塞性肺疾病患者凝血状态临床观察[J]. 中国医药科学, 2016, 6(2): 176-9. |
| [23] | 左晓红, 李庆红. 老年慢性阻塞性肺疾病急性加重期患者凝血功能的监测[J]. 血栓与止血学, 2017, 23(1): 89-91, 94. |
| [24] | 李一龙, 景小莹. 支气管哮喘患者血清LXA4水平及凝血功能与肺功能及哮喘病程的相关性研究[J]. 河北医药, 2019, 41(8): 1200-3. |
| [25] | 肉克亚木汗·艾尔肯. 支气管哮喘患者凝血功能与肺功能的相关性研究[D]. 乌鲁木齐: 新疆医科大学, 2022. |
| [26] | Díez-Sierra J, Medina-Gallardo JF, Muñoz-Sánchez B, et al. FEV(1) decline and clinical predictors in asthma after 10 Years of follow-up: BMI as a modifiable risk factor[J]. Respir Med, 2025, 246: 108247. doi:10.1016/j.rmed.2025.108247 |
| [27] | Lange P, Celli B, Agustí A, et al. Lung-function trajectories leading to chronic obstructive pulmonary disease[J]. N Engl J Med, 2015, 373(2): 111-22. doi:10.1056/nejmoa1411532 |
| [1] | Zhuang LI, Huan SHI, Jieting CHEN, Yuqi LIANG, Yingchao WU, Qian ZUO, Qianjun CHEN. Paeoniflorin alleviates cancer-related fatigue during chemotherapy for breast cancer by targeting EZH2/CCNE1 to regulate cell cycle and inflammatory microenvironment [J]. Journal of Southern Medical University, 2026, 46(8): 1835-1849. |
| [2] | Shiheng SHI, Daiping HUA, Shang XIANG, Lanting SUN, Qiaoyu XUAN, Wenming YANG, Han WANG. Development and validation of a machine learning-based prediction model for fatty liver in Wilson disease [J]. Journal of Southern Medical University, 2026, 46(8): 1861-1869. |
| [3] | Mengxin ZHU, Xiao LIU, Shan ZHAO, Xin ZHANG, Chao LIU, Xiankong LIU, Haochen QI, Tiesheng HAN, Dong MA. Interpretable machine learning models for preoperative precision prediction of perineural invasion in cervical cancer to support treatment decision: a multicenter retrospective study [J]. Journal of Southern Medical University, 2026, 46(7): 1509-1519. |
| [4] | Mengmeng CHEN, Runfang GUO, Wenjie ZHAO, Yongqi WANG, Lugen ZUO, Mulin LIU, Bin LI. Construction of an anxiety recognition model for patients with malignant gastrointestinal tumors based on multidimensional features and multiple interpretable machine learning [J]. Journal of Southern Medical University, 2026, 46(7): 1660-1670. |
| [5] | Bingbing MENG, Chang LIU, Guosong LIAO, Kai ZHANG, Muze YANG, Juanjuan GU, Jingsheng LOU, Yanhong LIU, Qiang FU, Jiangbei CAO, Weidong MI, Hao LI. Effect of intraoperative dexmedetomidine on postoperative sleep disturbance in elderly surgical patients: a prospective multicenter cohort study [J]. Journal of Southern Medical University, 2026, 46(6): 1228-1234. |
| [6] | Peiqi WANG, Kai ZHANG, Haijun WANG, Lujia YANG, Yanhong LIU, Jiangbei CAO, Hao LI, Weidong MI, Jingsheng LOU. Impact of preoperative cardiology consultation on major adverse cardiac events in non-cardiac surgery patients: a retrospective cohort study [J]. Journal of Southern Medical University, 2026, 46(6): 1301-1312. |
| [7] | Xingyang LIU, Jinghan WU, Chunyan YE, E WANG, Hao HU. Dynamic changes and physiological regulation of common carotid artery blood flow during general anesthesia in elderly patients: a prospective study [J]. Journal of Southern Medical University, 2026, 46(4): 761-769. |
| [8] | Hao CHEN, Zhenhan LI, Mengjia JI, Xincheng WANG, Bofeng CHEN, Qian GUAN, Man WU, Linming LU. Key determinants of global burden of non-alcoholic fatty liver disease: machine learning combined with Mendelian randomization analysis based on GBD data [J]. Journal of Southern Medical University, 2026, 46(4): 770-784. |
| [9] | Hongcheng TAO, Fukai LIANG, Wenbo HUANG, Siqi FAN, Ping ZENG. Analysis of potential association of alcohol exposure with femoral head osteonecrosis and construction of a diagnostic model using machine learning [J]. Journal of Southern Medical University, 2026, 46(3): 559-569. |
| [10] | Kelin XIANG, Xiaoyu ZHANG, Zhengpeng LI, Zhiwei XU, Sujie LIU, Yuan CHAI. Identification of efferocytosis-related genes in osteoarthritis and prediction of traditional Chinese medicines based on bioinformatics and machine learning [J]. Journal of Southern Medical University, 2026, 46(3): 693-706. |
| [11] | Junyao CHEN, Zeyu CHEN, Zhaojie LIN, Menghao FANG, Chaoying SHEN, Qi XU, Xiaoyi ZHANG, Lu LU. Dual role of tea consumption in gastrointestinal disease risks: analysis using a risk prediction model integrating interpretable machine learning and large language model [J]. Journal of Southern Medical University, 2026, 46(2): 353-361. |
| [12] | Yunneng CUI, Minqing FENG, Liangfeng YAO, Jiewen YAN, Wenhan LI, Yanping HUANG. Enhancement of radiomics-based machine learning models for predicting efficacy of high-intensity focused ultrasound ablation of uterine fibroids using undersampling methods [J]. Journal of Southern Medical University, 2026, 46(1): 141-149. |
| [13] | Qizhi HUANG, Daipeng XIE, Lintong YAO, Qiaxuan LI, Shaowei WU, Haiyu ZHOU. Tumor microenvironment-specific CT radiomics signature for predicting immunotherapy response in non-small cell lung cancer [J]. Journal of Southern Medical University, 2025, 45(9): 1903-1918. |
| [14] | Jun JIANG, Shuo FENG, Yingui SUN, Yan AN. Construction of risk prediction models of hypothermia after transurethral holmium laser enucleation of the prostate based on three machine learning algorithms [J]. Journal of Southern Medical University, 2025, 45(9): 2019-2025. |
| [15] | Meimei CHEN, Yang WANG, Huangwei LEI, Fei ZHANG, Ruina HUANG, Zhaoyang YANG. Construction of recognition models for subthreshold depression based on multiple machine learning algorithms and vocal emotional characteristics [J]. Journal of Southern Medical University, 2025, 45(4): 711-717. |
| Viewed | ||||||
|
Full text |
|
|||||
|
Abstract |
|
|||||
