Journal of Southern Medical University ›› 2025, Vol. 45 ›› Issue (4): 669-683.doi: 10.12122/j.issn.1673-4254.2025.04.01
Zhenyan MA1( ), Xin A2, Lei ZHAO3, Hongbo ZHANG3, Ke LIU1, Yiqing ZHAO1, Geng QIAN4()
Received:2025-01-09
Online:2025-04-20
Published:2025-04-28
Contact:
Geng QIAN
E-mail:mzy20130309@163.com;qiangeng9396@263.net
Zhenyan MA, Xin A, Lei ZHAO, Hongbo ZHANG, Ke LIU, Yiqing ZHAO, Geng QIAN. A cardiac magnetic resonance-based risk prediction model for left ventricular adverse remodeling following percutaneous coronary intervention for acute ST-segment elevation myocardial infarction: a multi-center prospective study[J]. Journal of Southern Medical University, 2025, 45(4): 669-683.
Add to citation manager EndNote|Ris|BibTeX
URL: https://www.j-smu.com/EN/10.12122/j.issn.1673-4254.2025.04.01
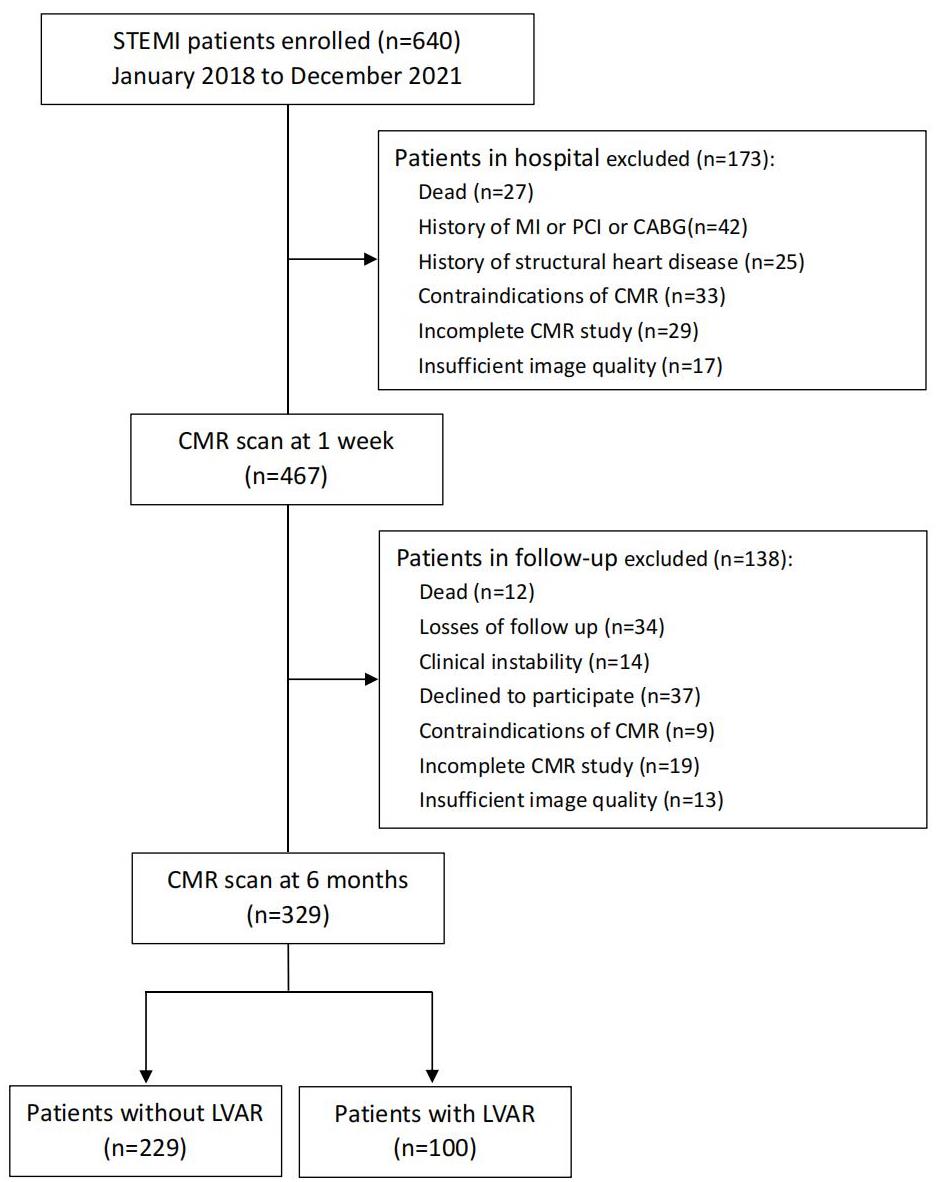
Fig.1 Flowchart of patient enrollment and grouping.
| Variables | Total (n=329) | Non-LVAR (n=229) | LVAR (n=100) | P |
|---|---|---|---|---|
| Demographics | ||||
| Age (year) | 58±10.8 | 58±10.6 | 58±11.5 | 0.944 |
| Female [n (%)] | 41 (12.46) | 32 (13.97) | 9 (9.00) | 0.209 |
| SBP (mmHg) | 125±20 | 126±20 | 124±18 | 0.445 |
| DBP (mmHg) | 76±13 | 76±13 | 77±14 | 0.244 |
| HR (beats/min) | 79±13 | 79±13 | 79±12 | 0.872 |
| BMI (kg/m2) | 25.4±3.3 | 25.4±3.3 | 25.4±3.3 | 0.939 |
| Killip classes | 0.330 | |||
| Ⅰ | 254 (77.20) | 182 (79.48) | 72 (72.00) | |
| Ⅱ | 64 (19.45) | 40 (17.47) | 24 (24.00) | |
| Ⅲ | 11 (3.34) | 7 (3.06) | 4 (4.00) | |
| Laboratory tests | ||||
| Hb (g/L) | 148.3±15.2 | 148.1±15.1 | 148.8±15.5 | 0.685 |
| WBC (109/L) | 10.81±3.46 | 10.39±3.27 | 11.79±3.69 | 0.001* |
| Glucose (mmol/L) | 8.26±3.59 | 8.04±3.23 | 8.75±4.27 | 0.100 |
| Cr (µmol/L) | 77.84±18.44 | 78.43±18.43 | 76.49±18.49 | 0.382 |
| LDL-C (mmol/L) | 3.09±0.94 | 3.10±0.90 | 3.07±1.01 | 0.789 |
| TC (mmol/L) | 4.60±1.12 | 4.63±1.11 | 4.54±1.14 | 0.515 |
| TG (mmol/L) | 1.63±0.96 | 1.68±1.03 | 1.51±0.77 | 0.145 |
| NT-proBNP (pg/mL) | 134.50 (51.50, 321.80) | 124.00 (51.64, 251.50) | 149.00 (50.72, 498.95) | 0.052 |
| Peak cTnT (ng/mL) | 9.95 (4.04, 24.76) | 8.22 (3.24, 21.80) | 18.92 (6.53, 40.85) | <0.001* |
| Peak CK-MB (ng/mL) | 165.80 (65.00, 257.00) | 143.70 (59.79, 238.20) | 216.40 (125.05, 301.50) | <0.001* |
| Medical history [n (%)] | ||||
| Hypertension | 179 (54.41) | 122 (53.28) | 57 (57.00) | 0.533 |
| Diabetes mellitus | 81 (24.62) | 57 (24.89) | 24 (24.00) | 0.863 |
| Hyperlipidemia | 141 (42.86) | 93 (40.61) | 48 (48.00) | 0.213 |
| Stroke | 19 (5.78) | 11 (4.80) | 8 (8.00) | 0.253 |
| Current smoker | 204 (62.01) | 142 (62.01) | 62 (62.00) | 0.999 |
| Medical therapy [n (%)] | ||||
| ACEI/ARB | 162 (49.24) | 115 (50.22) | 47 (47.00) | 0.591 |
| Beta-blocker | 267 (81.16) | 184 (80.35) | 83 (83.00) | 0.572 |
| MRA | 56 (17.02) | 35 (15.28) | 21 (21.00) | 0.204 |
| ARNI | 167 (50.76) | 114 (49.78) | 53 (53.00) | 0.591 |
| SGLT2I | 86 (26.14) | 61 (26.64) | 25 (25.00) | 0.756 |
| Antiplatelet agents | 329 (100) | 229 (100) | 100 (100.00) | 1.000 |
| Statin | 326 (99.09) | 227 (99.13) | 99 (99.00) | 1.000 |
| Angiographic features [n (%)] | ||||
| MI location | <0.001* | |||
| Anterior MI | 154 (46.81) | 90 (39.30) | 64 (64.00) | |
| Non-Anterior MI | 175 (53.19) | 139 (60.70) | 36 (36.00) | |
| Number of diseased vessels | 0.254 | |||
| 1 | 172 (52.28) | 113 (49.34) | 59 (59.00) | |
| 2 | 84 (25.53) | 61 (26.64) | 23 (23.00) | |
| 3 | 73 (22.19) | 55 (24.02) | 18 (18.00) | |
| Culprit vessel | <0.001* | |||
| LAD | 168 (51.06) | 101 (44.10) | 67 (67.00) | |
| LCX | 41 (12.46) | 30 (13.10) | 11 (11.00) | |
| RCA | 120 (36.47) | 98 (42.79) | 22 (22.00) | |
| Number of stents | 0.529 | |||
| 0 | 16 (4.86) | 9 (3.93) | 7 (7.00) | |
| 1 | 228 (69.30) | 162 (70.74) | 66 (66.00) | |
| 2 | 65 (19.76) | 43 (18.78) | 22 (22.00) | |
| 3 | 20 (6.08) | 15 (6.55) | 5 (5.00) | |
| TIMI flow before PCI | 0.096 | |||
| 0 | 254 (77.20) | 168 (73.36) | 86 (86.00) | |
| 1 | 12 (3.65) | 10 (4.37) | 2 (2.00) | |
| 2 | 27 (8.21) | 22 (9.61) | 5 (5.00) | |
| 3 | 36 (10.94) | 29 (12.66) | 7 (7.00) | |
| TIMI flow after PCI | 0.274 | |||
| 0 | 1 (0.30) | 1 (0.44) | 0 (0.00) | |
| 1 | 2 (0.61) | 1 (0.44) | 1 (1.00) | |
| 2 | 7 (2.13) | 3 (1.31) | 4 (4.00) | |
| 3 | 319 (96.96) | 224 (97.82) | 95 (95.00) |
Tab.1 Comparison of clinical data between non-LVAR group and LVAR group
| Variables | Total (n=329) | Non-LVAR (n=229) | LVAR (n=100) | P |
|---|---|---|---|---|
| Demographics | ||||
| Age (year) | 58±10.8 | 58±10.6 | 58±11.5 | 0.944 |
| Female [n (%)] | 41 (12.46) | 32 (13.97) | 9 (9.00) | 0.209 |
| SBP (mmHg) | 125±20 | 126±20 | 124±18 | 0.445 |
| DBP (mmHg) | 76±13 | 76±13 | 77±14 | 0.244 |
| HR (beats/min) | 79±13 | 79±13 | 79±12 | 0.872 |
| BMI (kg/m2) | 25.4±3.3 | 25.4±3.3 | 25.4±3.3 | 0.939 |
| Killip classes | 0.330 | |||
| Ⅰ | 254 (77.20) | 182 (79.48) | 72 (72.00) | |
| Ⅱ | 64 (19.45) | 40 (17.47) | 24 (24.00) | |
| Ⅲ | 11 (3.34) | 7 (3.06) | 4 (4.00) | |
| Laboratory tests | ||||
| Hb (g/L) | 148.3±15.2 | 148.1±15.1 | 148.8±15.5 | 0.685 |
| WBC (109/L) | 10.81±3.46 | 10.39±3.27 | 11.79±3.69 | 0.001* |
| Glucose (mmol/L) | 8.26±3.59 | 8.04±3.23 | 8.75±4.27 | 0.100 |
| Cr (µmol/L) | 77.84±18.44 | 78.43±18.43 | 76.49±18.49 | 0.382 |
| LDL-C (mmol/L) | 3.09±0.94 | 3.10±0.90 | 3.07±1.01 | 0.789 |
| TC (mmol/L) | 4.60±1.12 | 4.63±1.11 | 4.54±1.14 | 0.515 |
| TG (mmol/L) | 1.63±0.96 | 1.68±1.03 | 1.51±0.77 | 0.145 |
| NT-proBNP (pg/mL) | 134.50 (51.50, 321.80) | 124.00 (51.64, 251.50) | 149.00 (50.72, 498.95) | 0.052 |
| Peak cTnT (ng/mL) | 9.95 (4.04, 24.76) | 8.22 (3.24, 21.80) | 18.92 (6.53, 40.85) | <0.001* |
| Peak CK-MB (ng/mL) | 165.80 (65.00, 257.00) | 143.70 (59.79, 238.20) | 216.40 (125.05, 301.50) | <0.001* |
| Medical history [n (%)] | ||||
| Hypertension | 179 (54.41) | 122 (53.28) | 57 (57.00) | 0.533 |
| Diabetes mellitus | 81 (24.62) | 57 (24.89) | 24 (24.00) | 0.863 |
| Hyperlipidemia | 141 (42.86) | 93 (40.61) | 48 (48.00) | 0.213 |
| Stroke | 19 (5.78) | 11 (4.80) | 8 (8.00) | 0.253 |
| Current smoker | 204 (62.01) | 142 (62.01) | 62 (62.00) | 0.999 |
| Medical therapy [n (%)] | ||||
| ACEI/ARB | 162 (49.24) | 115 (50.22) | 47 (47.00) | 0.591 |
| Beta-blocker | 267 (81.16) | 184 (80.35) | 83 (83.00) | 0.572 |
| MRA | 56 (17.02) | 35 (15.28) | 21 (21.00) | 0.204 |
| ARNI | 167 (50.76) | 114 (49.78) | 53 (53.00) | 0.591 |
| SGLT2I | 86 (26.14) | 61 (26.64) | 25 (25.00) | 0.756 |
| Antiplatelet agents | 329 (100) | 229 (100) | 100 (100.00) | 1.000 |
| Statin | 326 (99.09) | 227 (99.13) | 99 (99.00) | 1.000 |
| Angiographic features [n (%)] | ||||
| MI location | <0.001* | |||
| Anterior MI | 154 (46.81) | 90 (39.30) | 64 (64.00) | |
| Non-Anterior MI | 175 (53.19) | 139 (60.70) | 36 (36.00) | |
| Number of diseased vessels | 0.254 | |||
| 1 | 172 (52.28) | 113 (49.34) | 59 (59.00) | |
| 2 | 84 (25.53) | 61 (26.64) | 23 (23.00) | |
| 3 | 73 (22.19) | 55 (24.02) | 18 (18.00) | |
| Culprit vessel | <0.001* | |||
| LAD | 168 (51.06) | 101 (44.10) | 67 (67.00) | |
| LCX | 41 (12.46) | 30 (13.10) | 11 (11.00) | |
| RCA | 120 (36.47) | 98 (42.79) | 22 (22.00) | |
| Number of stents | 0.529 | |||
| 0 | 16 (4.86) | 9 (3.93) | 7 (7.00) | |
| 1 | 228 (69.30) | 162 (70.74) | 66 (66.00) | |
| 2 | 65 (19.76) | 43 (18.78) | 22 (22.00) | |
| 3 | 20 (6.08) | 15 (6.55) | 5 (5.00) | |
| TIMI flow before PCI | 0.096 | |||
| 0 | 254 (77.20) | 168 (73.36) | 86 (86.00) | |
| 1 | 12 (3.65) | 10 (4.37) | 2 (2.00) | |
| 2 | 27 (8.21) | 22 (9.61) | 5 (5.00) | |
| 3 | 36 (10.94) | 29 (12.66) | 7 (7.00) | |
| TIMI flow after PCI | 0.274 | |||
| 0 | 1 (0.30) | 1 (0.44) | 0 (0.00) | |
| 1 | 2 (0.61) | 1 (0.44) | 1 (1.00) | |
| 2 | 7 (2.13) | 3 (1.31) | 4 (4.00) | |
| 3 | 319 (96.96) | 224 (97.82) | 95 (95.00) |
| Variables | Total (n=329) | Non-LVAR (n=229) | LVAR (n=100) | P |
|---|---|---|---|---|
| LVEDV (mL) | 145.05±35.60 | 145.78±34.57 | 143.37±37.98 | 0.572 |
| LVESV (mL) | 78.00±28.43 | 75.06±26.68 | 84.74±31.17 | 0.004* |
| LVSV (mL) | 67.07±16.48 | 70.76±15.43 | 58.62±15.74 | <0.001* |
| LVEF (%) | 46.99±8.98 | 49.41±8.05 | 41.47±8.58 | <0.001* |
| LVM (g) | 115.61±26.04 | 113.16±25.97 | 121.21±25.43 | 0.010* |
| LVGLS (%) | 11.19±3.24 | 12.24±2.90 | 8.77±2.60 | <0.001* |
| LVGCS (%) | 14.07±3.13 | 14.93±2.87 | 12.08±2.78 | <0.001* |
| LVGRS (%) | 22.14±6.39 | 23.89±6.08 | 18.13±5.17 | <0.001* |
| RVEDV (mL) | 113.94±29.61 | 116.77±30.24 | 107.46±27.17 | 0.008* |
| RVESV (mL) | 61.54±20.58 | 62.22±21.13 | 59.98±19.28 | 0.364 |
| RVSV (mL) | 52.41±16.46 | 54.55±16.04 | 47.51±16.43 | <0.001* |
| RVM (g) | 26.45±5.79 | 26.18±6.13 | 27.08±4.90 | 0.195 |
| RVEF (%) | 46.13±9.70 | 47.04±9.08 | 44.03±10.73 | 0.009* |
| RVGLS (%) | 17.68±5.51 | 18.72±5.10 | 15.29±5.71 | <0.001* |
| RVGCS (%) | 14.63±3.45 | 14.84±3.27 | 14.14±3.82 | 0.113 |
| RVGRS (%) | 25.32±8.59 | 25.45±8.26 | 25.01±9.34 | 0.670 |
| LAVmax (mL) | 65.63±20.72 | 66.56±20.22 | 63.51±21.78 | 0.221 |
| LAVpac (mL) | 48.08±17.47 | 48.24±16.83 | 47.69±18.94 | 0.791 |
| LAVmin (mL) | 32.88±14.98 | 32.12±14.16 | 34.62±16.65 | 0.164 |
| LAEF total (%) | 50.76±8.34 | 52.63±7.26 | 46.50±9.10 | <0.001* |
| LAEF passive (%) | 27.30±6.15 | 28.03±5.75 | 25.61±6.72 | <0.001* |
| LAEF active (%) | 32.52±7.71 | 34.33±7.00 | 28.37±7.68 | <0.001* |
| LATS (%) | 25.56±8.90 | 28.06±8.30 | 19.83±7.51 | <0.001* |
| LAPS (%) | 13.69±5.66 | 14.99±5.59 | 10.72±4.62 | <0.001* |
| LAAS (%) | 11.86±4.42 | 13.06±4.15 | 9.11±3.74 | <0.001* |
| RAVmax (mL) | 58.50±16.73 | 59.90±17.05 | 55.29±15.56 | 0.021* |
| RAVpac (mL) | 42.33±12.37 | 43.03±12.54 | 40.74±11.89 | 0.123 |
| RAVmin (mL) | 29.19±9.51 | 29.15±9.25 | 29.26±10.13 | 0.925 |
| RAEF total (%) | 50.02±7.17 | 51.26±6.56 | 47.17±7.70 | <0.001* |
| RAEF passive (%) | 27.46±5.80 | 28.01±5.67 | 26.19±5.92 | 0.009* |
| RAEF active (%) | 31.20±7.08 | 32.34±6.74 | 28.59±7.17 | <0.001* |
| RATS (%) | 28.30±11.68 | 31.27±10.95 | 21.51±10.46 | <0.001* |
| RAPS (%) | 16.24±7.69 | 17.94±7.34 | 12.35±7.06 | <0.001* |
| RAAS (%) | 12.07±5.60 | 13.33±5.57 | 9.17±4.48 | <0.001* |
| IS (%) | 23.00±11.92 | 19.08±10.34 | 31.97±10.37 | <0.001* |
| MVO (%) | 0.00 (0.00 2.95) | 0.00 (0.00 0.83) | 3.34 (1.43 5.82) | <0.001* |
| IMH [n (%)] | 118 (35.87) | 49 (21.40) | 69 (69.00) | <0.001* |
Tab.2 Comparison of cardiac magnetic resonance (CMR) parameters between non-LVAR group and LVAR group
| Variables | Total (n=329) | Non-LVAR (n=229) | LVAR (n=100) | P |
|---|---|---|---|---|
| LVEDV (mL) | 145.05±35.60 | 145.78±34.57 | 143.37±37.98 | 0.572 |
| LVESV (mL) | 78.00±28.43 | 75.06±26.68 | 84.74±31.17 | 0.004* |
| LVSV (mL) | 67.07±16.48 | 70.76±15.43 | 58.62±15.74 | <0.001* |
| LVEF (%) | 46.99±8.98 | 49.41±8.05 | 41.47±8.58 | <0.001* |
| LVM (g) | 115.61±26.04 | 113.16±25.97 | 121.21±25.43 | 0.010* |
| LVGLS (%) | 11.19±3.24 | 12.24±2.90 | 8.77±2.60 | <0.001* |
| LVGCS (%) | 14.07±3.13 | 14.93±2.87 | 12.08±2.78 | <0.001* |
| LVGRS (%) | 22.14±6.39 | 23.89±6.08 | 18.13±5.17 | <0.001* |
| RVEDV (mL) | 113.94±29.61 | 116.77±30.24 | 107.46±27.17 | 0.008* |
| RVESV (mL) | 61.54±20.58 | 62.22±21.13 | 59.98±19.28 | 0.364 |
| RVSV (mL) | 52.41±16.46 | 54.55±16.04 | 47.51±16.43 | <0.001* |
| RVM (g) | 26.45±5.79 | 26.18±6.13 | 27.08±4.90 | 0.195 |
| RVEF (%) | 46.13±9.70 | 47.04±9.08 | 44.03±10.73 | 0.009* |
| RVGLS (%) | 17.68±5.51 | 18.72±5.10 | 15.29±5.71 | <0.001* |
| RVGCS (%) | 14.63±3.45 | 14.84±3.27 | 14.14±3.82 | 0.113 |
| RVGRS (%) | 25.32±8.59 | 25.45±8.26 | 25.01±9.34 | 0.670 |
| LAVmax (mL) | 65.63±20.72 | 66.56±20.22 | 63.51±21.78 | 0.221 |
| LAVpac (mL) | 48.08±17.47 | 48.24±16.83 | 47.69±18.94 | 0.791 |
| LAVmin (mL) | 32.88±14.98 | 32.12±14.16 | 34.62±16.65 | 0.164 |
| LAEF total (%) | 50.76±8.34 | 52.63±7.26 | 46.50±9.10 | <0.001* |
| LAEF passive (%) | 27.30±6.15 | 28.03±5.75 | 25.61±6.72 | <0.001* |
| LAEF active (%) | 32.52±7.71 | 34.33±7.00 | 28.37±7.68 | <0.001* |
| LATS (%) | 25.56±8.90 | 28.06±8.30 | 19.83±7.51 | <0.001* |
| LAPS (%) | 13.69±5.66 | 14.99±5.59 | 10.72±4.62 | <0.001* |
| LAAS (%) | 11.86±4.42 | 13.06±4.15 | 9.11±3.74 | <0.001* |
| RAVmax (mL) | 58.50±16.73 | 59.90±17.05 | 55.29±15.56 | 0.021* |
| RAVpac (mL) | 42.33±12.37 | 43.03±12.54 | 40.74±11.89 | 0.123 |
| RAVmin (mL) | 29.19±9.51 | 29.15±9.25 | 29.26±10.13 | 0.925 |
| RAEF total (%) | 50.02±7.17 | 51.26±6.56 | 47.17±7.70 | <0.001* |
| RAEF passive (%) | 27.46±5.80 | 28.01±5.67 | 26.19±5.92 | 0.009* |
| RAEF active (%) | 31.20±7.08 | 32.34±6.74 | 28.59±7.17 | <0.001* |
| RATS (%) | 28.30±11.68 | 31.27±10.95 | 21.51±10.46 | <0.001* |
| RAPS (%) | 16.24±7.69 | 17.94±7.34 | 12.35±7.06 | <0.001* |
| RAAS (%) | 12.07±5.60 | 13.33±5.57 | 9.17±4.48 | <0.001* |
| IS (%) | 23.00±11.92 | 19.08±10.34 | 31.97±10.37 | <0.001* |
| MVO (%) | 0.00 (0.00 2.95) | 0.00 (0.00 0.83) | 3.34 (1.43 5.82) | <0.001* |
| IMH [n (%)] | 118 (35.87) | 49 (21.40) | 69 (69.00) | <0.001* |
| Variables | Total (n=329) | Training set (n=230) | Validation set (n=99) | P |
|---|---|---|---|---|
| Baseline data | ||||
| Age (year) | 58±10.8 | 58±10.9 | 57±10.8 | 0.423 |
| SBP (mmHg) | 125.29±19.60 | 125.69±19.34 | 124.37±20.26 | 0.578 |
| DBP (mmHg) | 76.26±13.45 | 76.67±13.27 | 75.31±13.88 | 0.402 |
| HR (beats/min) | 78.89±12.57 | 79.19±12.38 | 78.20±13.04 | 0.515 |
| BMI (kg/m2) | 25.38±3.30 | 25.26±3.12 | 25.64±3.68 | 0.369 |
| Hb (g/L) | 148.27±15.22 | 148.05±15.11 | 148.79±15.51 | 0.685 |
| WBC (109/L) | 10.81±3.46 | 10.69±3.59 | 11.09±3.12 | 0.339 |
| Glu (mmol/L) | 8.26±3.59 | 8.44±3.72 | 7.83±3.23 | 0.155 |
| Cr (µmol/L) | 77.84±18.44 | 77.84±19.11 | 77.84±16.89 | 0.999 |
| LDL-C (mmol/L) | 3.09±0.94 | 3.04±0.95 | 3.19±0.91 | 0.175 |
| TC (mmol/L) | 4.60±1.12 | 4.55±1.08 | 4.71±1.19 | 0.226 |
| TG (mmol/L) | 1.63±0.96 | 1.63±0.97 | 1.64±0.93 | 0.940 |
| NT-proBNP (pg/mL) | 146.50(58.00, 331.70) | 149.00(61.03, 343.73) | 145.50(53.95, 280.15) | 0.507 |
| Peak cTnT (ng/mL) | 9.98 (4.04, 24.86) | 10.26 (4.34, 24.49) | 7.86 (3.87, 31.57) | 0.702 |
| Peak CK-MB (ng/mL) | 165.00(64.78, 256.30) | 157.05(65.25, 248.52) | 177.90(63.20, 267.50) | 0.518 |
| LVAR [n (%)] | 100 (30.40) | 71 (30.87) | 29 (29.29) | 0.775 |
| Female [n (%)] | 41 (12.46) | 28 (12.17) | 13 (13.13) | 0.809 |
| MI location [n (%)] | 0.573 | |||
| Non-anterior MI | 175 (53.19) | 120 (52.17) | 55 (55.56) | |
| Anterior MI | 154 (46.81) | 110 (47.83) | 44 (44.44) | |
| Hypertension [n (%)] | 179 (54.41) | 128 (55.65) | 51 (51.52) | 0.490 |
| Diabetes [n (%)] | 81 (24.62) | 63 (27.39) | 18 (18.18) | 0.075 |
| Hyperlipidemia [n (%)] | 141 (42.86) | 99 (43.04) | 42 (42.42) | 0.917 |
| Stroke [n (%)] | 19 (5.78) | 13 (5.65) | 6 (6.06) | 0.884 |
| Smoking [n (%)] | 204 (62.01) | 138 (60.00) | 66 (66.67) | 0.253 |
| ACEI/ARB [n (%)] | 162 (49.24) | 113 (49.13) | 49 (49.49) | 0.956 |
| Beta-blocker [n (%)] | 267 (81.16) | 186 (80.87) | 81 (81.82) | 0.847 |
| MRA [n (%)] | 56 (17.02) | 39 (16.96) | 17 (17.17) | 0.967 |
| ARNI [n (%)] | 167 (50.76) | 117 (50.87) | 50 (50.51) | 0.954 |
| SGLT2I [n (%)] | 86 (26.14) | 60 (26.09) | 26 (26.26) | 0.976 |
| Antiplatelet agents [n (%)] | 329 (100) | 230 (100) | 99 (100) | 1.000 |
| Statin [n (%)] | 326 (99.09) | 228 (99.13) | 98 (98.99) | 0.899 |
| Killip [n (%)] | 0.411 | |||
| Ⅰ | 254 (77.20) | 173 (75.22) | 81 (81.82) | |
| Ⅱ | 64 (19.45) | 49 (21.30) | 15 (15.15) | |
| Ⅲ | 11 (3.34) | 8 (3.48) | 3 (3.03) | |
| Number of vessels diseased [n (%)] | 0.678 | |||
| 1 | 172 (52.28) | 116(50.44) | 56 (56.57) | |
| 2 | 84 (25.53) | 61 (26.52) | 23 (23.23) | |
| 3 | 73 (22.19) | 53(23.04) | 20 (20.20) | |
| Culprit vessel [n (%)] | 0.974 | |||
| 1 | 168 (51.06) | 118 (51.30) | 50 (50.51) | |
| 2 | 41 (12.46) | 29 (12.61) | 12 (12.12) | |
| 3 | 120 (36.47) | 83 (36.09) | 37 (37.37) | |
| Number of stents [n (%)] | 0.071 | |||
| 0 | 16 (4.86) | 13 (5.65) | 3 (3.03) | |
| 1 | 228 (69.30) | 162 (70.43) | 66 (66.67) | |
| 2 | 65 (19.76) | 46 (20.00) | 19 (19.19) | |
| 3 | 20 (6.08) | 9 (3.91) | 11 (11.11) | |
| TIMI before PCI [n (%)] | 0.083 | |||
| 0 | 254 (77.20) | 182 (79.13) | 72 (72.73) | |
| 1 | 12 (3.65) | 9 (3.91) | 3 (3.03) | |
| 2 | 27 (8.21) | 13 (5.65) | 14 (14.14) | |
| 3 | 36 (10.94) | 26 (11.30) | 10 (10.10) | |
| TIMI after PCI [n (%)] | 0.891 | |||
| 0 | 1 (0.30) | 1 (0.43) | 0 (0.00) | |
| 1 | 2 (0.61) | 1 (0.43) | 1 (1.01) | |
| 2 | 7 (2.13) | 5 (2.17) | 2 (2.02) | |
| 3 | 319 (96.96) | 223 (96.96) | 96 (96.97) | |
| CMR parameters | ||||
| LVEDV (mL) | 145.05±35.60 | 145.84±35.60 | 143.20±35.72 | 0.538 |
| LVESV (mL) | 78.00±28.43 | 78.20±29.44 | 77.53±26.05 | 0.846 |
| LVSV (mL) | 67.07±16.48 | 67.67±16.17 | 65.67±17.17 | 0.313 |
| LVEF (%) | 46.99±8.98 | 47.25±9.18 | 46.39±8.51 | 0.427 |
| LVM (g) | 115.61±26.04 | 115.26±25.80 | 116.40±26.69 | 0.718 |
| RVEDV (mL) | 113.94±29.61 | 113.81±28.94 | 114.25±31.26 | 0.901 |
| RVESV (mL) | 61.54±20.58 | 61.17±19.88 | 62.41±22.19 | 0.616 |
| RVSV (mL) | 52.41±16.46 | 52.65±16.52 | 51.84±16.40 | 0.680 |
| RVM (g) | 26.45±5.79 | 26.23±5.52 | 26.97±6.39 | 0.283 |
| RVEF (%) | 46.19±9.51 | 46.41±9.63 | 45.70±9.25 | 0.536 |
| IS (%) | 23.00±11.92 | 22.91±11.91 | 23.22±12.00 | 0.829 |
| LVGLS (%) | 11.19±3.24 | 11.20±3.19 | 11.15±3.36 | 0.909 |
| LVGCS (%) | 14.07±3.13 | 14.18±3.11 | 13.80±3.18 | 0.312 |
| LVGRS (%) | 22.14±6.39 | 22.43±6.42 | 21.46±6.29 | 0.206 |
| RVGLS (%) | 17.68±5.51 | 17.94±5.63 | 17.09±5.23 | 0.201 |
| RVGCS (%) | 14.63±3.45 | 14.79±3.47 | 14.26±3.40 | 0.203 |
| RVGRS (%) | 25.15±7.41 | 25.46±7.64 | 24.45±6.82 | 0.255 |
| LAVmax (mL) | 65.63±20.72 | 66.33±21.38 | 64.00±19.09 | 0.349 |
| LAVpac (mL) | 48.08±17.47 | 48.57±17.95 | 46.93±16.33 | 0.435 |
| LAVmin (mL) | 32.88±14.98 | 33.26±15.06 | 32.02±14.83 | 0.494 |
| LAEF total (%) | 50.76±8.34 | 50.73±8.53 | 50.85±7.91 | 0.907 |
| LAEF passive (%) | 27.30±6.15 | 27.37±6.37 | 27.12±5.66 | 0.737 |
| LAEF active (%) | 32.52±7.71 | 32.41±7.91 | 32.78±7.24 | 0.694 |
| LATS (%) | 25.56±8.90 | 25.63±8.80 | 25.38±9.17 | 0.812 |
| LAPS (%) | 13.69±5.66 | 13.81±5.55 | 13.42±5.93 | 0.571 |
| LAAS (%) | 11.86±4.42 | 11.82±4.43 | 11.96±4.39 | 0.801 |
| RAVmax (mL) | 58.50±16.73 | 58.98±17.22 | 57.38±15.54 | 0.428 |
| RAVpac (mL) | 42.33±12.37 | 42.83±12.72 | 41.17±11.50 | 0.266 |
| RAVmin (mL) | 29.19±9.51 | 29.56±9.57 | 28.32±9.36 | 0.279 |
| RAEF total (%) | 50.02±7.17 | 49.77±7.10 | 50.59±7.32 | 0.342 |
| RAEF passive (%) | 27.46±5.80 | 27.22±5.65 | 28.01±6.13 | 0.256 |
| RAEF active (%) | 31.20±7.08 | 31.11±6.84 | 31.41±7.65 | 0.724 |
| RATS (%) | 28.30±11.68 | 27.90±11.48 | 29.23±12.16 | 0.345 |
| RAPS (%) | 16.24±7.69 | 16.06±7.43 | 16.67±8.29 | 0.509 |
| RAAS (%) | 12.07±5.60 | 11.85±5.69 | 12.57±5.35 | 0.281 |
| MVO (%) | 0.00 (0.00, 2.95) | 0.00 (0.00, 2.98) | 0.00 (0.00, 2.75) | 0.701 |
| IMH [n (%)] | 119 (36.17) | 81 (35.22) | 38 (38.38) | 0.573 |
Tab.3 Comparison of baseline data and CMR parameters between the training set and validation set
| Variables | Total (n=329) | Training set (n=230) | Validation set (n=99) | P |
|---|---|---|---|---|
| Baseline data | ||||
| Age (year) | 58±10.8 | 58±10.9 | 57±10.8 | 0.423 |
| SBP (mmHg) | 125.29±19.60 | 125.69±19.34 | 124.37±20.26 | 0.578 |
| DBP (mmHg) | 76.26±13.45 | 76.67±13.27 | 75.31±13.88 | 0.402 |
| HR (beats/min) | 78.89±12.57 | 79.19±12.38 | 78.20±13.04 | 0.515 |
| BMI (kg/m2) | 25.38±3.30 | 25.26±3.12 | 25.64±3.68 | 0.369 |
| Hb (g/L) | 148.27±15.22 | 148.05±15.11 | 148.79±15.51 | 0.685 |
| WBC (109/L) | 10.81±3.46 | 10.69±3.59 | 11.09±3.12 | 0.339 |
| Glu (mmol/L) | 8.26±3.59 | 8.44±3.72 | 7.83±3.23 | 0.155 |
| Cr (µmol/L) | 77.84±18.44 | 77.84±19.11 | 77.84±16.89 | 0.999 |
| LDL-C (mmol/L) | 3.09±0.94 | 3.04±0.95 | 3.19±0.91 | 0.175 |
| TC (mmol/L) | 4.60±1.12 | 4.55±1.08 | 4.71±1.19 | 0.226 |
| TG (mmol/L) | 1.63±0.96 | 1.63±0.97 | 1.64±0.93 | 0.940 |
| NT-proBNP (pg/mL) | 146.50(58.00, 331.70) | 149.00(61.03, 343.73) | 145.50(53.95, 280.15) | 0.507 |
| Peak cTnT (ng/mL) | 9.98 (4.04, 24.86) | 10.26 (4.34, 24.49) | 7.86 (3.87, 31.57) | 0.702 |
| Peak CK-MB (ng/mL) | 165.00(64.78, 256.30) | 157.05(65.25, 248.52) | 177.90(63.20, 267.50) | 0.518 |
| LVAR [n (%)] | 100 (30.40) | 71 (30.87) | 29 (29.29) | 0.775 |
| Female [n (%)] | 41 (12.46) | 28 (12.17) | 13 (13.13) | 0.809 |
| MI location [n (%)] | 0.573 | |||
| Non-anterior MI | 175 (53.19) | 120 (52.17) | 55 (55.56) | |
| Anterior MI | 154 (46.81) | 110 (47.83) | 44 (44.44) | |
| Hypertension [n (%)] | 179 (54.41) | 128 (55.65) | 51 (51.52) | 0.490 |
| Diabetes [n (%)] | 81 (24.62) | 63 (27.39) | 18 (18.18) | 0.075 |
| Hyperlipidemia [n (%)] | 141 (42.86) | 99 (43.04) | 42 (42.42) | 0.917 |
| Stroke [n (%)] | 19 (5.78) | 13 (5.65) | 6 (6.06) | 0.884 |
| Smoking [n (%)] | 204 (62.01) | 138 (60.00) | 66 (66.67) | 0.253 |
| ACEI/ARB [n (%)] | 162 (49.24) | 113 (49.13) | 49 (49.49) | 0.956 |
| Beta-blocker [n (%)] | 267 (81.16) | 186 (80.87) | 81 (81.82) | 0.847 |
| MRA [n (%)] | 56 (17.02) | 39 (16.96) | 17 (17.17) | 0.967 |
| ARNI [n (%)] | 167 (50.76) | 117 (50.87) | 50 (50.51) | 0.954 |
| SGLT2I [n (%)] | 86 (26.14) | 60 (26.09) | 26 (26.26) | 0.976 |
| Antiplatelet agents [n (%)] | 329 (100) | 230 (100) | 99 (100) | 1.000 |
| Statin [n (%)] | 326 (99.09) | 228 (99.13) | 98 (98.99) | 0.899 |
| Killip [n (%)] | 0.411 | |||
| Ⅰ | 254 (77.20) | 173 (75.22) | 81 (81.82) | |
| Ⅱ | 64 (19.45) | 49 (21.30) | 15 (15.15) | |
| Ⅲ | 11 (3.34) | 8 (3.48) | 3 (3.03) | |
| Number of vessels diseased [n (%)] | 0.678 | |||
| 1 | 172 (52.28) | 116(50.44) | 56 (56.57) | |
| 2 | 84 (25.53) | 61 (26.52) | 23 (23.23) | |
| 3 | 73 (22.19) | 53(23.04) | 20 (20.20) | |
| Culprit vessel [n (%)] | 0.974 | |||
| 1 | 168 (51.06) | 118 (51.30) | 50 (50.51) | |
| 2 | 41 (12.46) | 29 (12.61) | 12 (12.12) | |
| 3 | 120 (36.47) | 83 (36.09) | 37 (37.37) | |
| Number of stents [n (%)] | 0.071 | |||
| 0 | 16 (4.86) | 13 (5.65) | 3 (3.03) | |
| 1 | 228 (69.30) | 162 (70.43) | 66 (66.67) | |
| 2 | 65 (19.76) | 46 (20.00) | 19 (19.19) | |
| 3 | 20 (6.08) | 9 (3.91) | 11 (11.11) | |
| TIMI before PCI [n (%)] | 0.083 | |||
| 0 | 254 (77.20) | 182 (79.13) | 72 (72.73) | |
| 1 | 12 (3.65) | 9 (3.91) | 3 (3.03) | |
| 2 | 27 (8.21) | 13 (5.65) | 14 (14.14) | |
| 3 | 36 (10.94) | 26 (11.30) | 10 (10.10) | |
| TIMI after PCI [n (%)] | 0.891 | |||
| 0 | 1 (0.30) | 1 (0.43) | 0 (0.00) | |
| 1 | 2 (0.61) | 1 (0.43) | 1 (1.01) | |
| 2 | 7 (2.13) | 5 (2.17) | 2 (2.02) | |
| 3 | 319 (96.96) | 223 (96.96) | 96 (96.97) | |
| CMR parameters | ||||
| LVEDV (mL) | 145.05±35.60 | 145.84±35.60 | 143.20±35.72 | 0.538 |
| LVESV (mL) | 78.00±28.43 | 78.20±29.44 | 77.53±26.05 | 0.846 |
| LVSV (mL) | 67.07±16.48 | 67.67±16.17 | 65.67±17.17 | 0.313 |
| LVEF (%) | 46.99±8.98 | 47.25±9.18 | 46.39±8.51 | 0.427 |
| LVM (g) | 115.61±26.04 | 115.26±25.80 | 116.40±26.69 | 0.718 |
| RVEDV (mL) | 113.94±29.61 | 113.81±28.94 | 114.25±31.26 | 0.901 |
| RVESV (mL) | 61.54±20.58 | 61.17±19.88 | 62.41±22.19 | 0.616 |
| RVSV (mL) | 52.41±16.46 | 52.65±16.52 | 51.84±16.40 | 0.680 |
| RVM (g) | 26.45±5.79 | 26.23±5.52 | 26.97±6.39 | 0.283 |
| RVEF (%) | 46.19±9.51 | 46.41±9.63 | 45.70±9.25 | 0.536 |
| IS (%) | 23.00±11.92 | 22.91±11.91 | 23.22±12.00 | 0.829 |
| LVGLS (%) | 11.19±3.24 | 11.20±3.19 | 11.15±3.36 | 0.909 |
| LVGCS (%) | 14.07±3.13 | 14.18±3.11 | 13.80±3.18 | 0.312 |
| LVGRS (%) | 22.14±6.39 | 22.43±6.42 | 21.46±6.29 | 0.206 |
| RVGLS (%) | 17.68±5.51 | 17.94±5.63 | 17.09±5.23 | 0.201 |
| RVGCS (%) | 14.63±3.45 | 14.79±3.47 | 14.26±3.40 | 0.203 |
| RVGRS (%) | 25.15±7.41 | 25.46±7.64 | 24.45±6.82 | 0.255 |
| LAVmax (mL) | 65.63±20.72 | 66.33±21.38 | 64.00±19.09 | 0.349 |
| LAVpac (mL) | 48.08±17.47 | 48.57±17.95 | 46.93±16.33 | 0.435 |
| LAVmin (mL) | 32.88±14.98 | 33.26±15.06 | 32.02±14.83 | 0.494 |
| LAEF total (%) | 50.76±8.34 | 50.73±8.53 | 50.85±7.91 | 0.907 |
| LAEF passive (%) | 27.30±6.15 | 27.37±6.37 | 27.12±5.66 | 0.737 |
| LAEF active (%) | 32.52±7.71 | 32.41±7.91 | 32.78±7.24 | 0.694 |
| LATS (%) | 25.56±8.90 | 25.63±8.80 | 25.38±9.17 | 0.812 |
| LAPS (%) | 13.69±5.66 | 13.81±5.55 | 13.42±5.93 | 0.571 |
| LAAS (%) | 11.86±4.42 | 11.82±4.43 | 11.96±4.39 | 0.801 |
| RAVmax (mL) | 58.50±16.73 | 58.98±17.22 | 57.38±15.54 | 0.428 |
| RAVpac (mL) | 42.33±12.37 | 42.83±12.72 | 41.17±11.50 | 0.266 |
| RAVmin (mL) | 29.19±9.51 | 29.56±9.57 | 28.32±9.36 | 0.279 |
| RAEF total (%) | 50.02±7.17 | 49.77±7.10 | 50.59±7.32 | 0.342 |
| RAEF passive (%) | 27.46±5.80 | 27.22±5.65 | 28.01±6.13 | 0.256 |
| RAEF active (%) | 31.20±7.08 | 31.11±6.84 | 31.41±7.65 | 0.724 |
| RATS (%) | 28.30±11.68 | 27.90±11.48 | 29.23±12.16 | 0.345 |
| RAPS (%) | 16.24±7.69 | 16.06±7.43 | 16.67±8.29 | 0.509 |
| RAAS (%) | 12.07±5.60 | 11.85±5.69 | 12.57±5.35 | 0.281 |
| MVO (%) | 0.00 (0.00, 2.95) | 0.00 (0.00, 2.98) | 0.00 (0.00, 2.75) | 0.701 |
| IMH [n (%)] | 119 (36.17) | 81 (35.22) | 38 (38.38) | 0.573 |
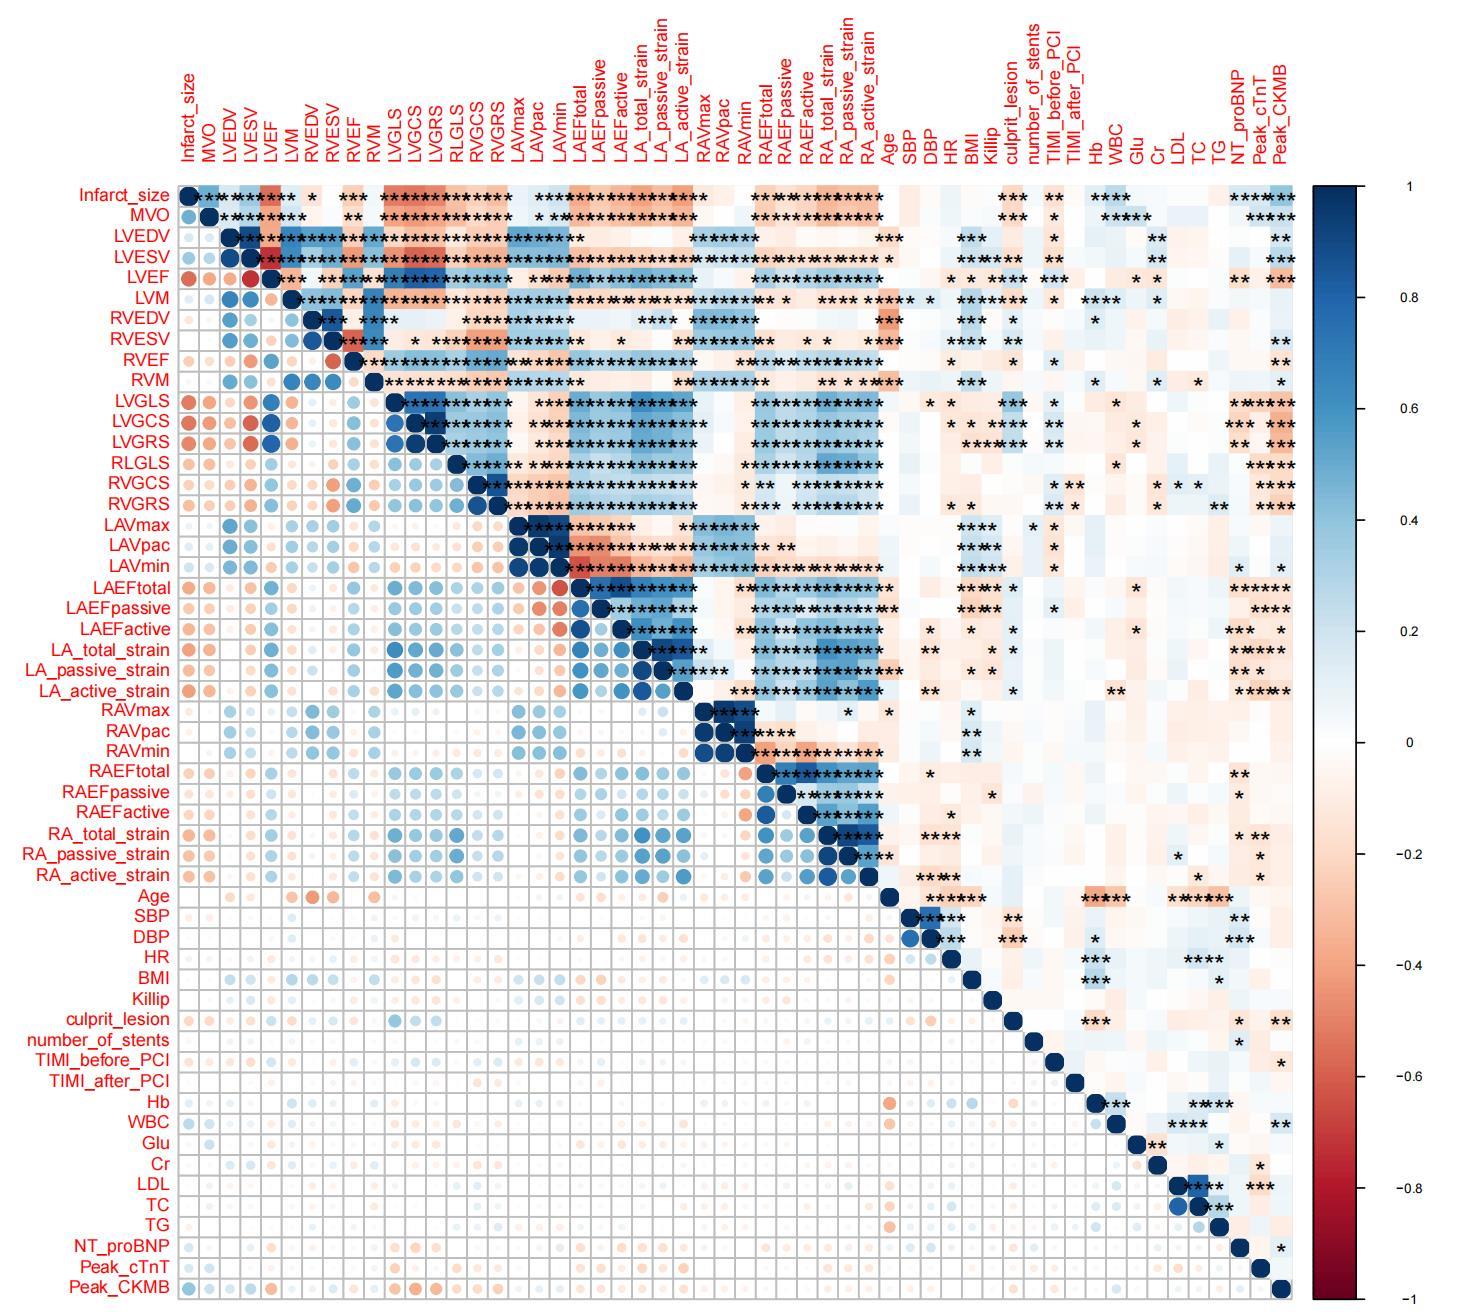
Fig.2 Heatmap of parameter correlations in the training set.
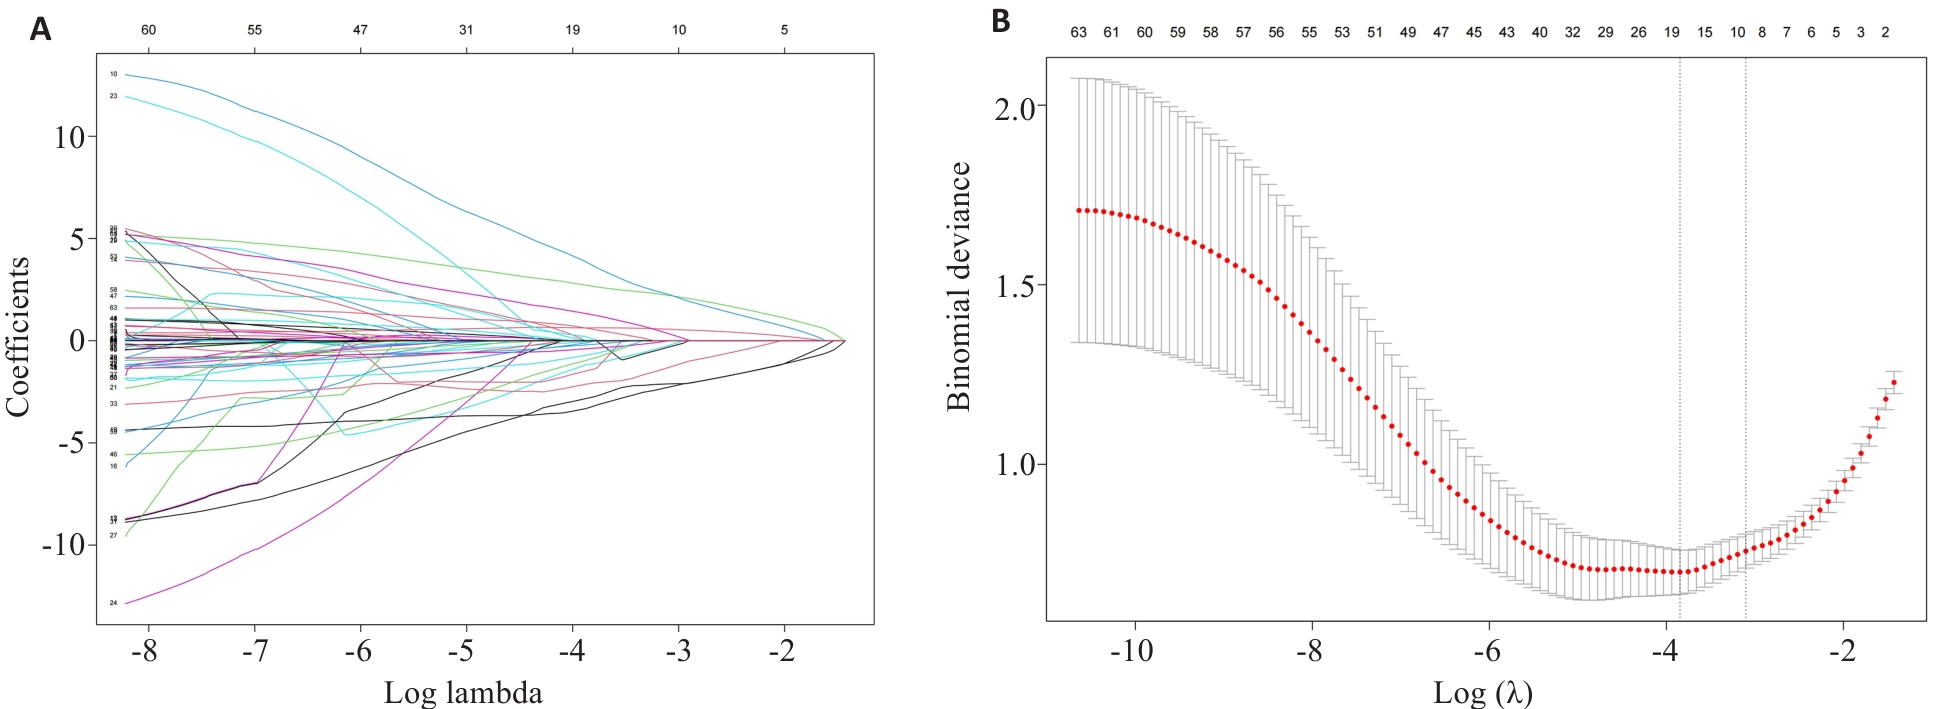
Fig.3 LASSO regression analysis. A: LASSO coefficient profiles of 63 features. B: LASSO cross-validation plot
| Parameter | Univariate | Multivariate | ||||
|---|---|---|---|---|---|---|
| OR | 95% CI | P | OR | 95% CI | P | |
| IMH | 10.50 | 5.33-20.69 | <0.001* | 2.06 | 0.74-5.99 | 0.185 |
| IS | 1.11 | 1.07-1.15 | <0.001* | 1.05 | 1.01-1.10 | 0.017 |
| MVO | 1.67 | 1.42-1.97 | <0.001* | 1.26 | 1.01-1.59 | 0.048 |
| LVEDV | 0.99 | 0.99-1.00 | 0.257 | |||
| LVGLS | 0.63 | 0.55-0.72 | <0.001* | 0.76 | 0.61-0.95 | 0.015 |
| LAVmax | 0.99 | 0.97-1.00 | 0.079 | |||
| LVEF | 0.89 | 0.86-0.93 | <0.001* | 1.04 | 0.97-1.12 | 0.248 |
| LAAS | 0.68 | 0.61-0.77 | <0.001* | 0.78 | 0.67-0.92 | 0.003 |
| LATS | 0.92 | 0.89-0.95 | <0.001* | 1.00 | 0.95-1.04 | 0.853 |
| Peak cTnT | 1.01 | 1.01-1.01 | 0.017* | 1.00 | 0.99-1.01 | 0.730 |
Tab.4 Identification of the predictors for LVAR using univariate and multivariate logistic regression analyses
| Parameter | Univariate | Multivariate | ||||
|---|---|---|---|---|---|---|
| OR | 95% CI | P | OR | 95% CI | P | |
| IMH | 10.50 | 5.33-20.69 | <0.001* | 2.06 | 0.74-5.99 | 0.185 |
| IS | 1.11 | 1.07-1.15 | <0.001* | 1.05 | 1.01-1.10 | 0.017 |
| MVO | 1.67 | 1.42-1.97 | <0.001* | 1.26 | 1.01-1.59 | 0.048 |
| LVEDV | 0.99 | 0.99-1.00 | 0.257 | |||
| LVGLS | 0.63 | 0.55-0.72 | <0.001* | 0.76 | 0.61-0.95 | 0.015 |
| LAVmax | 0.99 | 0.97-1.00 | 0.079 | |||
| LVEF | 0.89 | 0.86-0.93 | <0.001* | 1.04 | 0.97-1.12 | 0.248 |
| LAAS | 0.68 | 0.61-0.77 | <0.001* | 0.78 | 0.67-0.92 | 0.003 |
| LATS | 0.92 | 0.89-0.95 | <0.001* | 1.00 | 0.95-1.04 | 0.853 |
| Peak cTnT | 1.01 | 1.01-1.01 | 0.017* | 1.00 | 0.99-1.01 | 0.730 |
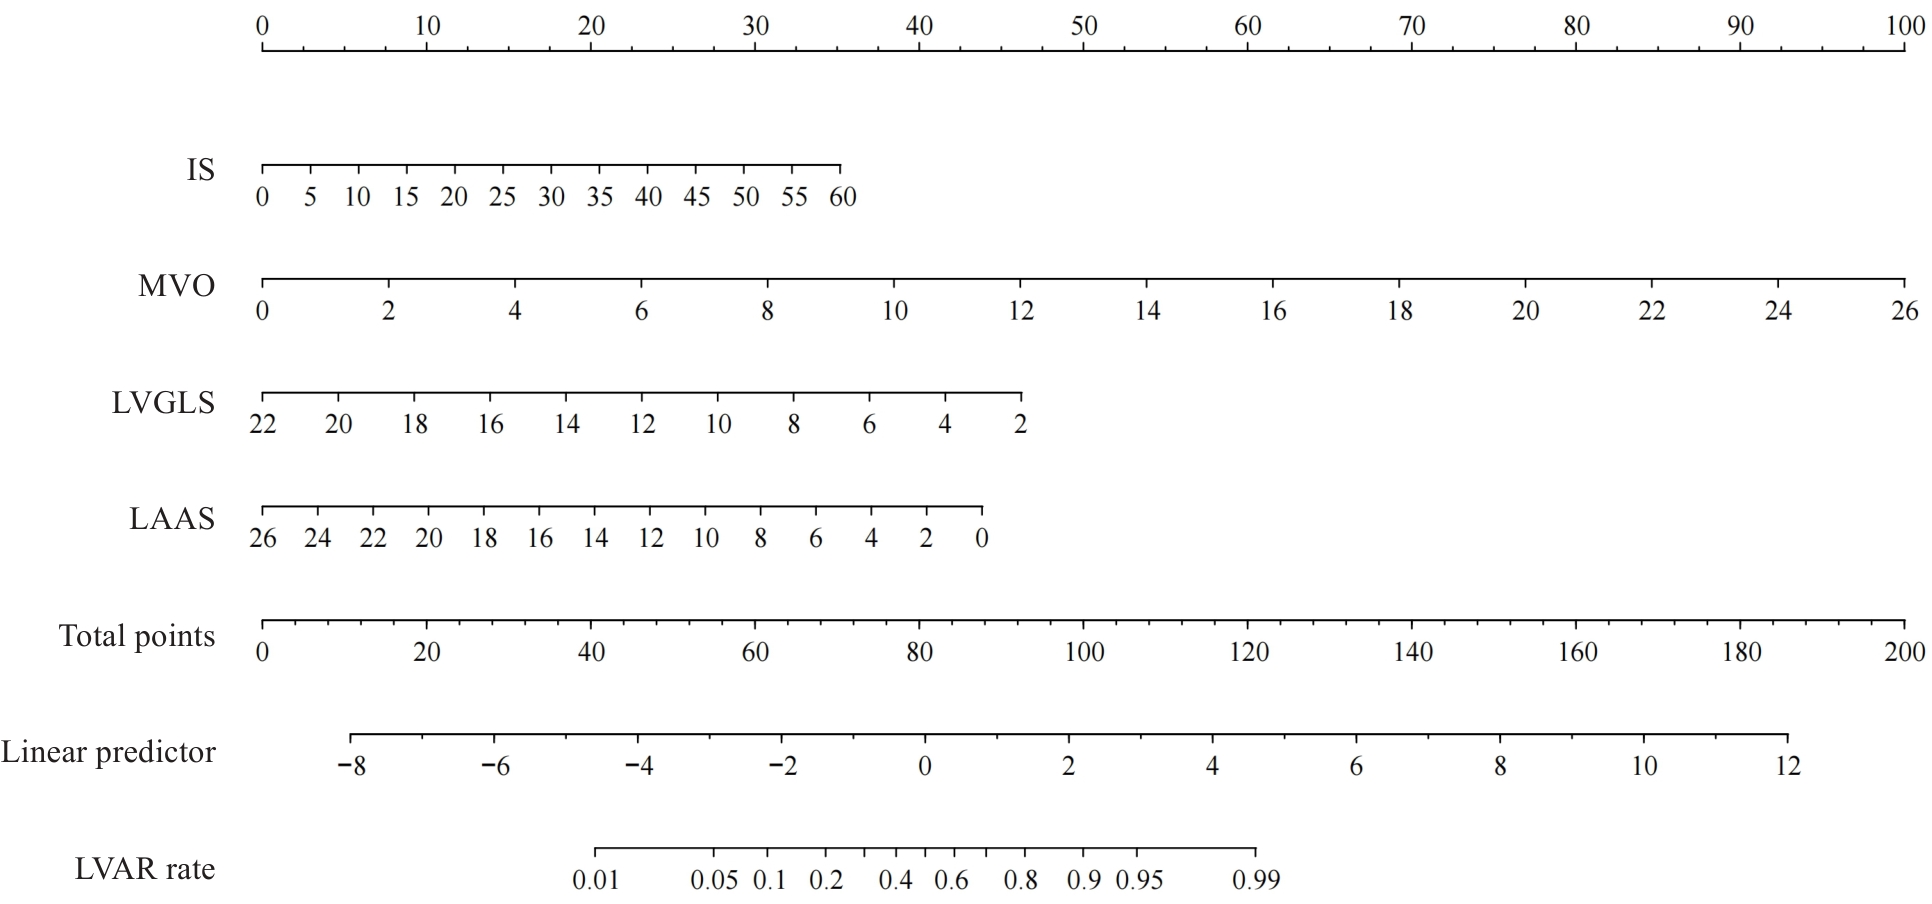
Fig.4 Nomogram for predicting LVAR.
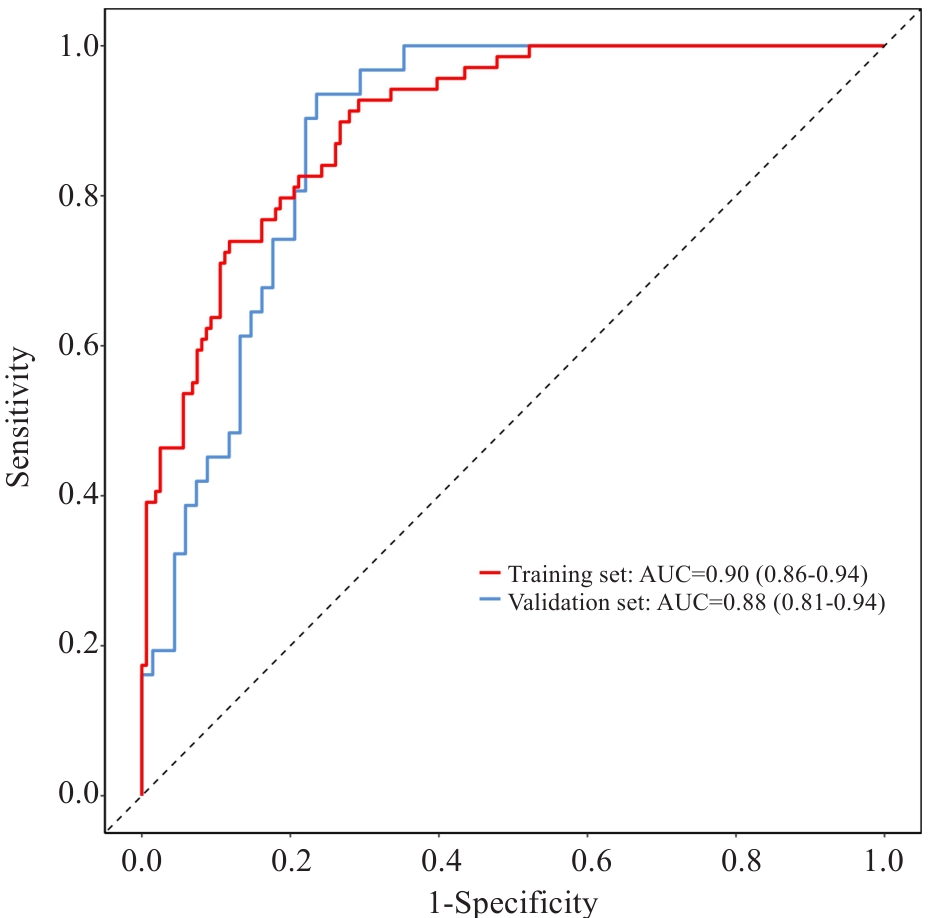
Fig.5 Nomogram ROC curves and AUC values in training and validation sets.
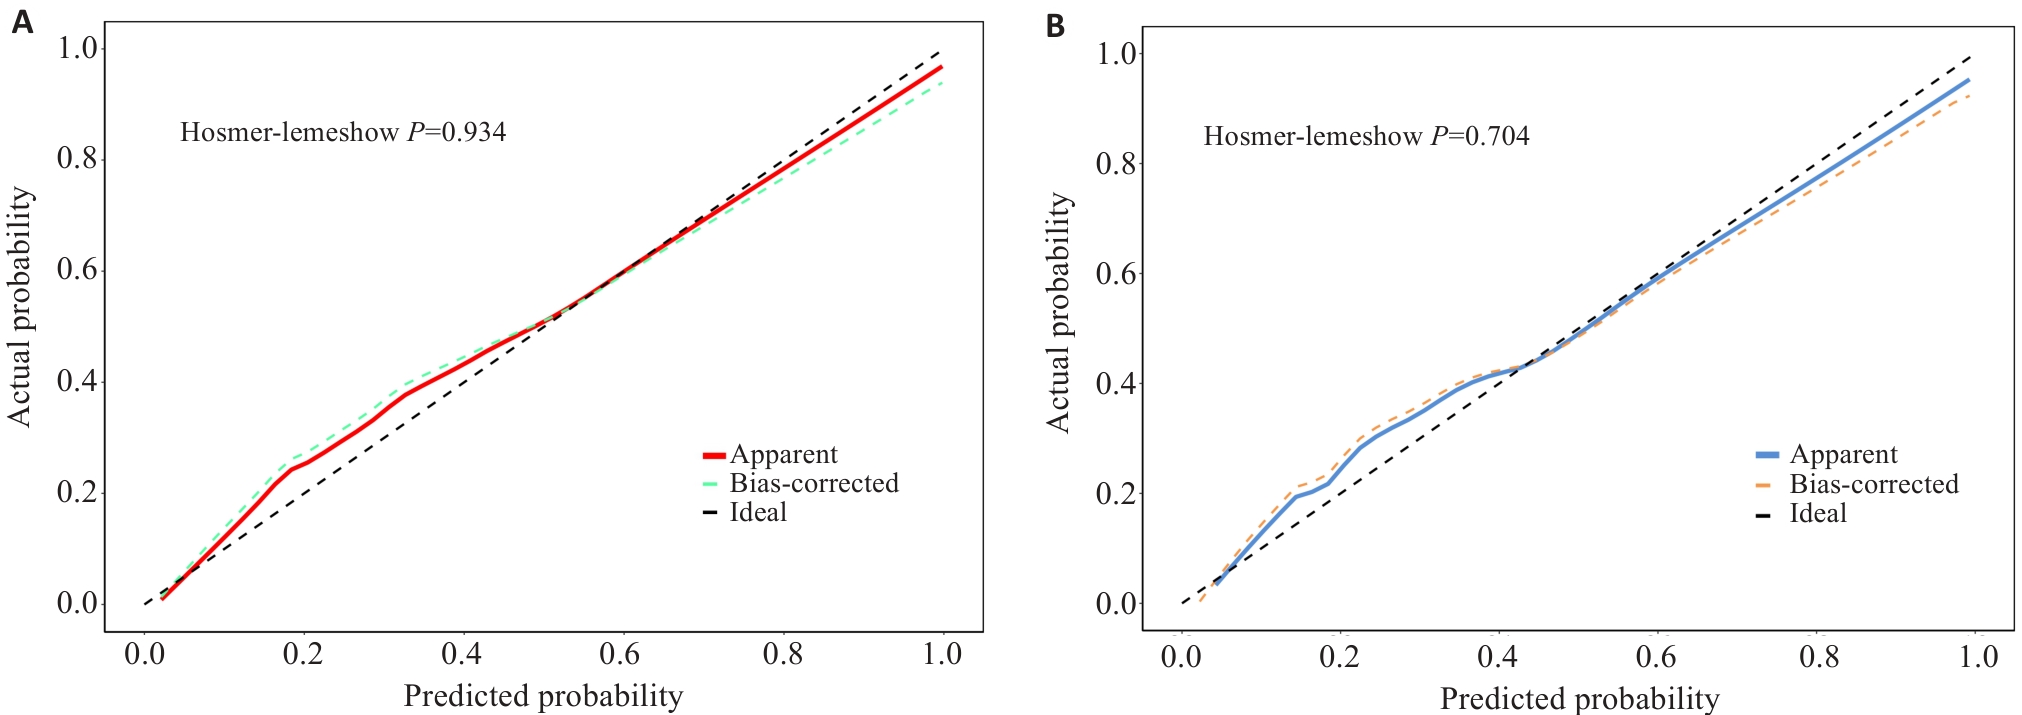
Fig.6 Calibration curves for the training set and validation set. A: Calibration curve of the training set. B: Calibration curve of the validation set.
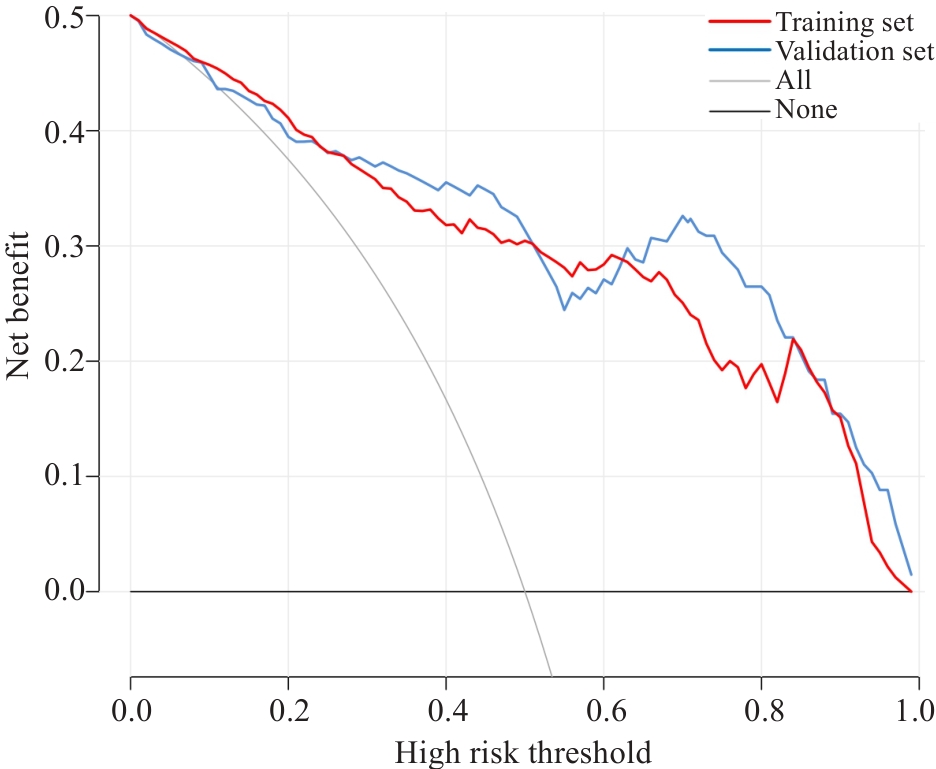
Fig.7 DCA curves of the nomogram in the training set (blue line) and validation set (red line).
| Variables [n (%)] | Total (n=329) | Non-LVAR (n=229) | LVAR (n=100) | P |
|---|---|---|---|---|
| Cardiac death | 10 (3.04) | 3 (1.31) | 7 (7.00) | 0.016 |
| Recurrent myocardial infarction | 15 (4.56) | 5 (2.18) | 10 (10.00) | 0.005 |
| Rehospitalization for heart failure | 35 (10.64) | 10 (4.37) | 25 (25.00) | <0.001 |
| Unplanned revascularization | 35 (10.64) | 19 (8.30) | 16 (16.00) | 0.037 |
| MACE | 95 (28.88) | 37 (16.16) | 58 (58.00) | <0.001 |
Tab.5 Comparison of incidences of MACEs between non-LVAR group and LVAR group
| Variables [n (%)] | Total (n=329) | Non-LVAR (n=229) | LVAR (n=100) | P |
|---|---|---|---|---|
| Cardiac death | 10 (3.04) | 3 (1.31) | 7 (7.00) | 0.016 |
| Recurrent myocardial infarction | 15 (4.56) | 5 (2.18) | 10 (10.00) | 0.005 |
| Rehospitalization for heart failure | 35 (10.64) | 10 (4.37) | 25 (25.00) | <0.001 |
| Unplanned revascularization | 35 (10.64) | 19 (8.30) | 16 (16.00) | 0.037 |
| MACE | 95 (28.88) | 37 (16.16) | 58 (58.00) | <0.001 |
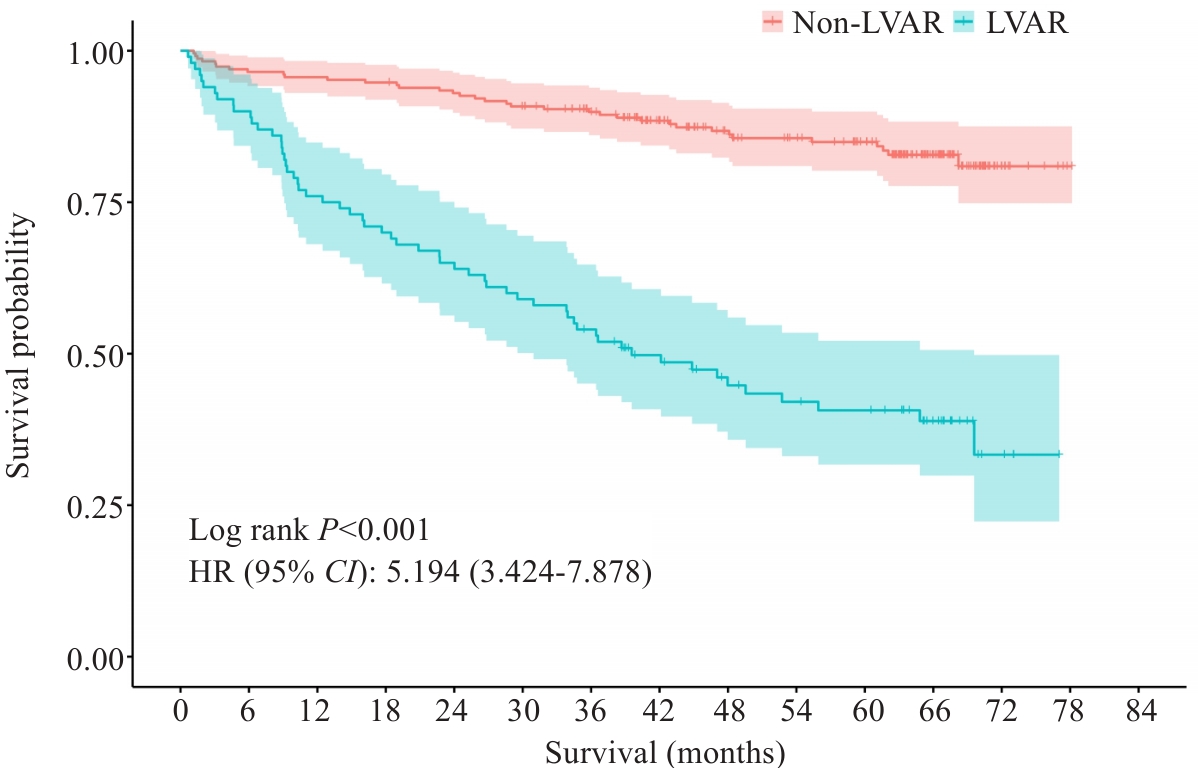
Fig.8 Kaplan-Meier curve analysis between non-LVAR group and LVAR group.
| Variables | Intra-observer variability | Inter-observer variability | ||
|---|---|---|---|---|
| ICC | 95% CI | ICC | 95% CI | |
| LVGLS (%) | 0.988 | 0.964, 0.996 | 0.946 | 0.877, 0.981 |
| LVEDV (%) | 0.951 | 0.864, 0.983 | 0.932 | 0.851,0.974 |
| LAAS (%) | 0.942 | 0.838, 0.980 | 0.918 | 0.826,0.966 |
| IS (%) | 0.978 | 0.934, 0.993 | 0.902 | 0.801,0.959 |
| MVO (%) | 0.973 | 0.920, 0.991 | 0.943 | 0.849,0.981 |
| LVEF (%) | 0.961 | 0.903, 0.987 | 0.946 | 0.877, 0.981 |
| ICC: Interclass correlation coefficient; CI: Confidence interval; LVGLS: Left ventricular global longitudinal strain; LVEDV: Left ventricular end-diastolic volume; LAAS: Left atrium active strain, IS: Infarct size; MVO: Microvascular obstruction; LVEF: Left ventricular ejection fraction. | ||||
Tab.6 Intra-observer and inter-observer agreement analysis
| Variables | Intra-observer variability | Inter-observer variability | ||
|---|---|---|---|---|
| ICC | 95% CI | ICC | 95% CI | |
| LVGLS (%) | 0.988 | 0.964, 0.996 | 0.946 | 0.877, 0.981 |
| LVEDV (%) | 0.951 | 0.864, 0.983 | 0.932 | 0.851,0.974 |
| LAAS (%) | 0.942 | 0.838, 0.980 | 0.918 | 0.826,0.966 |
| IS (%) | 0.978 | 0.934, 0.993 | 0.902 | 0.801,0.959 |
| MVO (%) | 0.973 | 0.920, 0.991 | 0.943 | 0.849,0.981 |
| LVEF (%) | 0.961 | 0.903, 0.987 | 0.946 | 0.877, 0.981 |
| ICC: Interclass correlation coefficient; CI: Confidence interval; LVGLS: Left ventricular global longitudinal strain; LVEDV: Left ventricular end-diastolic volume; LAAS: Left atrium active strain, IS: Infarct size; MVO: Microvascular obstruction; LVEF: Left ventricular ejection fraction. | ||||
| 1 | GBD 2021 Causes of Death Collaborators. Global burden of 288 causes of death and life expectancy decomposition in 204 countries and territories and 811 subnational locations, 1990-2021: a systematic analysis for the Global Burden of Disease Study 2021[J]. Lancet, 2024, 403(10440): 2100-32. |
| 2 | Vogel B, Claessen BE, Arnold SV, et al. ST-segment elevation myocardial infarction[J]. Nat Rev Dis Primers, 2019, 5(1): 39. |
| 3 | Byrne RA, Rossello X, Coughlan JJ, et al. 2023 ESC Guidelines for the management of acute coronary syndromes[J]. Eur Heart J, 2023, 44(38): 3720-826. |
| 4 | Bulluck H, Dharmakumar R, Arai AE, et al. Cardiovascular magnetic resonance in acute ST-segment-elevation myocardial infarction: recent advances, controversies, and future directions[J]. Circulation, 2018, 137(18): 1949-64. |
| 5 | Berezin AE, Berezin AA. Adverse cardiac remodelling after acute myocardial infarction: old and new biomarkers[J]. Dis Markers, 2020, 2020: 1215802. |
| 6 | Frantz S, Hundertmark MJ, Schulz-Menger J, et al. Left ventricular remodelling post-myocardial infarction: pathophysiology, imaging, and novel therapies[J]. Eur Heart J, 2022, 43(27): 2549-61. |
| 7 | Calvieri C, Riva A, Sturla F, et al. Left ventricular adverse remodeling in ischemic heart disease: emerging cardiac magnetic resonance imaging biomarkers[J]. J Clin Med, 2023, 12(1): 334. |
| 8 | Del Buono MG, Moroni F, Montone RA, et al. Ischemic cardiomyopathy and heart failure after acute myocardial infarction[J]. Curr Cardiol Rep, 2022, 24(10): 1505-15. |
| 9 | A X, Liu M, Chen T, et al. Non-contrast cine cardiac magnetic resonance derived-radiomics for the prediction of left ventricular adverse remodeling in patients with ST-segment elevation myocardial infarction[J]. Korean J Radiol, 2023, 24(9): 827-37. |
| 10 | Reindl M, Tiller C, Holzknecht M, et al. Global longitudinal strain by feature tracking for optimized prediction of adverse remodeling after ST-elevation myocardial infarction[J]. Clin Res Cardiol, 2021, 110(1): 61-71. |
| 11 | Cui JN, Zhao YN, Qian G, et al. Cardiac magnetic resonance for the early prediction of reverse left ventricular remodeling in patients with ST-segment elevation myocardial infarction[J]. Eur Radiol, 2023, 33(12): 8501-12. |
| 12 | Holmes AA, Romero J, Levsky JM, et al. Circumferential strain acquired by CMR early after acute myocardial infarction adds inc-remental predictive value to late gadolinium enhancement imaging to predict late myocardial remodeling and subsequent risk of sudden cardiac death[J]. J Interv Card Electrophysiol, 2017, 50(3): 211-8. |
| 13 | Pascaud A, Assunção A Jr, Garcia G, et al. Left atrial remodeling following ST-segment-elevation myocardial infarction correlates with infarct size and age older than 70 Years[J]. J Am Heart Assoc, 2023, 12(6): e026048. |
| 14 | Darweesh RM, Ahmed DMY, Ahmed KM, et al. Evaluation of right ventricular functions in patients with ischemic cardiomyopathy by speckle-tracking echocardiography[J]. Egypt Heart J, 2024, 76(1): 132. |
| 15 | Chimed S, van der Bijl P, de Paula Lustosa R, et al. Prognostic relevance of right ventricular remodeling after ST-segment elevation myocardial infarction in patients treated with primary percutaneous coronary intervention[J]. Am J Cardiol, 2022, 170: 1-9. |
| 16 | Chinese Society of Cardiology of Chinese Medical Association, Editorial Board of Chinese Journal of Cardiology. 2019 Chinese Society of Cardiology (CSC) guidelines for the diagnosis and man-agement of patients with ST-segment elevation myocardial infarction[J]. Zhonghua Xin Xue Guan Bing Za Zhi, 2019, 47(10): 766-83. |
| 17 | Wang L, Liu T, Wang C, et al. Development and validation of a predictive model for adverse left ventricular remodeling in NSTEMI patients after primary percutaneous coronary intervention[J]. BMC Cardiovasc Disord, 2022, 22(1): 386. |
| 18 | Ibanez B, James S, Agewall S, et al. 2017 ESC Guidelines for the management of acute myocardial infarction in patients presenting with ST-segment elevation: The Task Force for the management of acute myocardial infarction in patients presenting with ST-segment elevation of the European Society of Cardiology (ESC)[J]. Eur Heart J, 2018, 39(2): 119-77. |
| 19 | Bulluck H, Carberry J, Carrick D, et al. Redefining adverse and reverse left ventricular remodeling by cardiovascular magnetic resonance following ST-segment-elevation myocardial infarction and their implications on long-term prognosis[J]. Circ Cardiovasc Imaging, 2020, 13(7): e009937. |
| 20 | Legallois D, Hodzic A, Alexandre J, et al. Definition of left ventricular remodelling following ST-elevation myocardial infarction: a systematic review of cardiac magnetic resonance studies in the past decade[J]. Heart Fail Rev, 2022, 27(1): 37-48. |
| 21 | He J, Yang WJ, Wu WC, et al. Clinical features, myocardial strain and tissue characteristics of heart failure with preserved ejection fraction in patients with obesity: a prospective cohort study[J]. eClinicalMedicine, 2023, 55: 101723. |
| 22 | Kramer CM, Barkhausen J, Bucciarelli-Ducci C, et al. Standardized cardiovascular magnetic resonance imaging (CMR) protocols: 2020 update[J]. J Cardiovasc Magn Reson, 2020, 22(1): 17. |
| 23 | Peters DC, Lamy J, Sinusas AJ, et al. Left atrial evaluation by cardiovascular magnetic resonance: sensitive and unique biomarkers[J]. Eur Heart J Cardiovasc Imaging, 2021, 23(1): 14-30. |
| 24 | Olsen FJ, Bertelsen L, de Knegt MC, et al. Multimodality cardiac imaging for the assessment of left atrial function and the association with atrial arrhythmias[J]. Circ Cardiovasc Imaging, 2016, 9(10): e004947. |
| 25 | Kowallick JT, Morton G, Lamata P, et al. Quantification of atrial dynamics using cardiovascular magnetic resonance: inter-study reproducibility[J]. J Cardiovasc Magn Reson, 2015, 17(1): 36. |
| 26 | van Kranenburg M, Magro M, Thiele H, et al. Prognostic value of microvascular obstruction and infarct size, as measured by CMR in STEMI patients[J]. JACC Cardiovasc Imag, 2014, 7(9): 930-9. |
| 27 | Durante A, Laricchia A, Benedetti G, et al. Identification of high-risk patients after ST-segment-elevation myocardial infarction: comparison between angiographic and magnetic resonance parameters[J]. Circ Cardiovasc Imaging, 2017, 10(6): e005841. |
| 28 | Betgem RP, de Waard GA, Nijveldt R, et al. Intramyocardial haemorrhage after acute myocardial infarction[J]. Nat Rev Cardiol, 2015, 12(3): 156-67. |
| 29 | 中国医师协会胸痛专业委员会, 中华心血管病杂志(网络版)编辑委员会, 急性心肌梗死后心室重构防治专家共识起草组. 急性心肌梗死后心室重构防治专家共识[J]. 中华心血管病杂志(网络版), 2020,3(1): 1-7. |
| 30 | Leancă SA, Crișu D, Petriș AO, et al. Left ventricular remodeling after myocardial infarction: from physiopathology to treatment[J]. Life: Basel, 2022, 12(8): 1111. |
| 31 | Oleynikov V, Salyamova L, Kvasova O, et al. Prediction of adverse post-infarction left ventricular remodeling using a multivariate regression model[J]. Diagnostics: Basel, 2022, 12(3): 770. |
| 32 | Haberka M, Starzak M, Smolka G, et al. Echocardiography and cardiac magnetic resonance in the assessment of left-ventricle remodeling: differences implying clinical decision[J]. J Clin Med, 2024, 13(6): 1620. |
| 33 | Masci PG, Ganame J, Francone M, et al. Relationship between location and size of myocardial infarction and their reciprocal influences on post-infarction left ventricular remodelling[J]. Eur Heart J, 2011, 32(13): 1640-8. |
| 34 | Lombardo A, Niccoli G, Natale L, et al. Impact of microvascular obstruction and infarct size on left ventricular remodeling in reperfused myocardial infarction: a contrast-enhanced cardiac magnetic resonance imaging study[J]. Int J Cardiovasc Imag, 2012, 28(4): 835-42. |
| 35 | Heusch G. Coronary microvascular obstruction: the new frontier in cardioprotection[J]. Basic Res Cardiol, 2019, 114(6): 45. |
| 36 | Rios-Navarro C, Marcos-Garces V, Bayes-Genis A, et al. Microvascular obstruction in ST-segment elevation myocardial infarction: looking back to move forward. focus on CMR[J]. J Clin Med, 2019, 8(11): E1805. |
| 37 | Ndrepepa G, Colleran R, Kastrati A. No-reflow after percutaneous coronary intervention: a correlate of poor outcome in both persistent and transient forms[J]. EuroIntervention, 2018, 14(2): 139-41. |
| 38 | Niccoli G, Scalone G, Lerman A, et al. Coronary microvascular obstruction in acute myocardial infarction[J]. Eur Heart J, 2016, 37(13): 1024-33. |
| 39 | Konijnenberg LSF, Damman P, Duncker DJ, et al. Pathophysiology and diagnosis of coronary microvascular dysfunction in ST-elevation myocardial infarction[J]. Cardiovasc Res, 2020, 116(4): 787-805. |
| 40 | Dobrovie M, Barreiro-Pérez M, Curione D, et al. Inter-vendor reproducibility and accuracy of segmental left ventricular strain measurements using CMR feature tracking[J]. Eur Radiol, 2019, 29(12): 6846-57. |
| 41 | Ben Driss A, Ben Driss Lepage C, Sfaxi A, et al. Strain predicts left ventricular functional recovery after acute myocardial infarction with systolic dysfunction[J]. Int J Cardiol, 2020, 307: 1-7. |
| 42 | Reed GW, Rossi JE, Cannon CP. Acute myocardial infarction[J]. Lancet, 2017, 389(10065): 197-210. |
| 43 | Rajiah PS, Kalisz K, Broncano J, et al. Myocardial strain evaluation with cardiovascular MRI: physics, principles, and clinical applications[J]. Radiographics, 2022, 42(4): 968-90. |
| 44 | Panovsky R, Pleva M, Feitova V, et al. Left atrium assessment: the evolving role of MRI[J]. J Cardiovasc Med: Hagerstown, 2015, 16(10): 671-80. |
| 45 | Spencer L, Wright L, Foulkes SJ, et al. Characterizing the influence of cardiorespiratory fitness on left atrial size and function in the general population[J]. Am J Physiol Heart Circ Physiol, 2024, 326(5): H1269-78. |
| 46 | Modin D, Biering-Sørensen SR, Møgelvang R, et al. Prognostic value of left atrial strain in predicting cardiovascular morbidity and mortality in the general population[J]. Eur Heart J Cardiovasc Imaging, 2019, 20(7): 804-15. |
| 47 | Leng S, Ge H, He J, et al. Long-term prognostic value of cardiac MRI left atrial strain in ST-segment elevation myocardial infarction[J]. Radiology, 2020, 296(2): 299-309. |
| 48 | Chu AA, Wu TT, Zhang L, et al. The prognostic value of left atrial and left ventricular strain in patients after ST-segment elevation myocardial infarction treated with primary percutaneous coronary intervention[J]. Cardiol J, 2021, 28(5): 678-89. |
| 49 | Legallois D, Hodzic A, Milliez P, et al. Left atrial strain quantified after myocardial infarction is associated with early left ventricular remodeling[J]. Echocardiography, 2022, 39(12): 1581-8. |
| 50 | El-Naggar HM, Osman AS, Ahmed MA, et al. Three-dimensional echocardiographic assessment of left ventricular geometric changes following acute myocardial infarction[J]. Int J Cardiovasc Imag, 2023, 39(3): 607-20. |
| [1] | Shenhao PAN, Yankun LI, Zhewei WU, Yuling MAO, Chunyan WANG. Establishment of a predictive nomogram for clinical pregnancy rate in patients with endometriosis undergoing fresh embryo transfer [J]. Journal of Southern Medical University, 2024, 44(7): 1407-1415. |
| [2] | Ke LIU, Zhenyan MA, Lei FU, Liping ZHANG, Xin A, Shaobo XIAO, Zhen ZHANG, Hongbo ZHANG, Lei ZHAO, Geng QIAN. Predictive value of global longitudinal strain measured by cardiac magnetic resonance imaging for left ventricular remodeling after acute ST-segment elevation myocardial infarction: a multi-centered prospective study [J]. Journal of Southern Medical University, 2024, 44(6): 1033-1039. |
| [3] | CUI Jianing, LIU Wenjia, YAN Fei, ZHAO Yanan, CHEN Weijie, LUO Chuncai, ZHANG Xinghua, LI Tao. Predictive value of cardiac magnetic resonance imaging for adverse left ventricular remodeling after acute ST-segment elevation myocardial infarction [J]. Journal of Southern Medical University, 2024, 44(3): 553-562. |
| [4] | LIU Yunze, LI Chengrun, GUO Juntang, LIU Yang. A clinical-radiomics nomogram for differentiating focal organizing pneumonia and lung adenocarcinoma [J]. Journal of Southern Medical University, 2024, 44(2): 397-404. |
| [5] | CUI Jianing, LI Runxia, LIU Xueqian, ZHAO Yanan, ZHANG Xinghua, LIU Qingbo, LI Tao. Cardiac magnetic resonance-feature tracking technique can assess cardiac function and prognosis in patients with myocardial amyloidosis [J]. Journal of Southern Medical University, 2023, 43(4): 660-666. |
| [6] | ZHANG Haoxuan, LU Jin, JIANG Chengyi, FANG Meifang. Construction and evaluation of an artificial intelligence-based risk prediction model for death in patients with nasopharyngeal cancer [J]. Journal of Southern Medical University, 2023, 43(2): 271-279. |
| [7] | ZHANG Benlong, LU Yixun, LI Li, GAO Yunhe, LIANG Wenquan, XI Hongqing, WANG Xinxin, ZHANG Kecheng, CHEN Lin. Establishment and validation of a nomogram for predicting prognosis of gastric neuroendocrine neoplasms based on data from 490 cases in a single center [J]. Journal of Southern Medical University, 2023, 43(2): 183-190. |
| [8] | KONG Dexian, SONG Liping, XIANG Yang. Construction of a prognostic nomogram combining PET/CT metabolic parameters and blood inflammatory markers for non-small cell lung cancer treated with first-line chemotherapy [J]. Journal of Southern Medical University, 2023, 43(12): 2139-2144. |
| [9] | LIU Zhaojun, ZHOU Xiaoli. A nomogram based on systemic inflammation markers can predict adverse outcomes in patients with heart failure [J]. Journal of Southern Medical University, 2022, 42(8): 1149-1158. |
| [10] | LUO Chao, WANG Gaoming, HU Liwen, QIANG Yong, ZHENG Chao, SHEN Yi. Development and validation of a prognostic model based on SEER data for patients with esophageal carcinoma after esophagectomy [J]. Journal of Southern Medical University, 2022, 42(6): 794-804. |
| [11] | MENG Lingfei, ZHU Xueyan, YANG Liming, LI Xinyang, CHENG Siyu, GUO Shizheng, ZHUANG Xiaohua, ZOU Hongbin, CUI Wenpeng. Development and validation of a prediction model for treatment failure in peritoneal dialysis-associated peritonitis patients: a multicenter study [J]. Journal of Southern Medical University, 2022, 42(4): 546-553. |
| [12] | ZHAO Chenling, DONG Ting, SUN Lunyan, HU Huibing, WANG Qiong, TIAN Liwei, JIANG Zhangsheng. Establishment and validation of a predictive nomogram for liver fibrosis in patients with Wilson disease and abnormal lipid metabolism [J]. Journal of Southern Medical University, 2022, 42(11): 1720-1725. |
| [13] | LIU Jin, YANG Yanling, YAN Ke, ZHU Cairong, JIANG Min. Development and validation of nomograms for predicting stroke recurrence after first-episode ischemic stroke [J]. Journal of Southern Medical University, 2022, 42(1): 130-136. |
| [14] | ZHANG Haijie, YIN Fu, CHEN Menglin, QI Anqi, YANG Liyang, CUI Weiwei, YANG Shanshan, WEN Ge. Predicting postoperative recurrence of stage I-III renal clear cell carcinoma based on preoperative CT radiomics feature nomogram [J]. Journal of Southern Medical University, 2021, 41(9): 1358-1365. |
| [15] | . Factors affecting survival prognosis of advanced gastric cancer and establishment of a nomogram predictive model [J]. Journal of Southern Medical University, 2021, 41(4): 621-627. |
| Viewed | ||||||
|
Full text |
|
|||||
|
Abstract |
|
|||||