
南方医科大学学报 ›› 2026, Vol. 46 ›› Issue (7): 1634-1647.doi: 10.12122/j.issn.1673-4254.2026.07.17
• • 上一篇
王小龙( ), 杨建, 梁爽, 董哲毅()
收稿日期:2026-01-29
出版日期:2026-07-20
发布日期:2026-07-20
通讯作者:
董哲毅
E-mail:450391715@qq.com;shengdai26@163.com
作者简介:王小龙,硕士,主治医师,E-mail: 450391715@qq.com
基金资助:
Xiaolong WANG(), Jian YANG, Shuang LIANG, Zheyi DONG()
Received:2026-01-29
Online:2026-07-20
Published:2026-07-20
Contact:
Zheyi DONG
E-mail:450391715@qq.com;shengdai26@163.com
摘要:
目的 探究2型糖尿病合并慢性肾脏病(T2DM-CKD)患者低密度脂蛋白(LDL-C)与糖化血红蛋白(HbA1c)的纵向协同演变特征,解析双代谢轨迹对全因死亡的交互影响及风险修饰作用。 方法 基于天津市医保数据平台纳入7991例T2DM-CKD患者。采用群体基础轨迹模型(GBTM)识别LDL-C和HbA1c的长期演变模式,并据此构建双代谢轨迹联合组以评估其协同效应。采用 LASSO回归进行特征选择,利用多变量Cox回归及双参照组交互分析策略,系统量化双轨迹的联合风险,并重点评估深度降脂在不同血糖背景下的风险修饰价值。 结果 中位随访5.10(3.15~7.52)年,共记录死亡事件405例(5.1%)。研究识别出3种LDL-C轨迹(深度控制、标准控制、高位回归)及3种HbA1c轨迹(控制良好、中度改善、控制不良)。双重代谢紊乱呈现显著的剂量-反应梯度,“脂差糖差组”死亡风险最高(HR=5.550,95% CI: 3.322~9.274,P<0.001),远超单一指标异常的风险叠加。即便HbA1c控制良好,LDL-C高位回归仍独立增加死亡风险(HR=2.015,P=0.039);反之,在LDL-C深度控制下,HbA1c 控制不良的额外风险不再显著(P=0.480)。交互分析证实,对于HbA1c控制不良(血糖管理困难)的患者,相较于标准降脂,将LDL-C强化至深度控制水平(<1.8 mmol/L)发挥了显著的缓冲保护作用,使死亡风险降低 51%(HR=0.49,95% CI: 0.26~0.92,P=0.026)。相反,从深度控制降至标准控制则使风险增加99%(HR=1.99,95%CI: 1.07~3.69,P=0.029)。 结论 本研究首次揭示了T2DM-CKD患者糖脂代谢轨迹的协同演变规律及其对预后的叠加影响。深度降脂(LDL-C<1.8 mmol/L)对血糖管理困难患者具有显著保护作用。当血糖控制面临挑战时,强化血脂管理是改善患者预后的有效补偿策略,为个体化精准治疗提供了新的循证依据。
王小龙, 杨建, 梁爽, 董哲毅. 强化降脂对血糖管理困难的2型糖尿病合并慢性肾脏病患者死亡风险的缓冲作用:基于双代谢轨迹的队列研究[J]. 南方医科大学学报, 2026, 46(7): 1634-1647.
Xiaolong WANG, Jian YANG, Shuang LIANG, Zheyi DONG. Buffering effect of intensive lipid lowering on mortality risk in type 2 diabetic patients with chronic kidney disease and challenging glycemic management: a cohort study based on dual metabolic trajectories[J]. Journal of Southern Medical University, 2026, 46(7): 1634-1647.
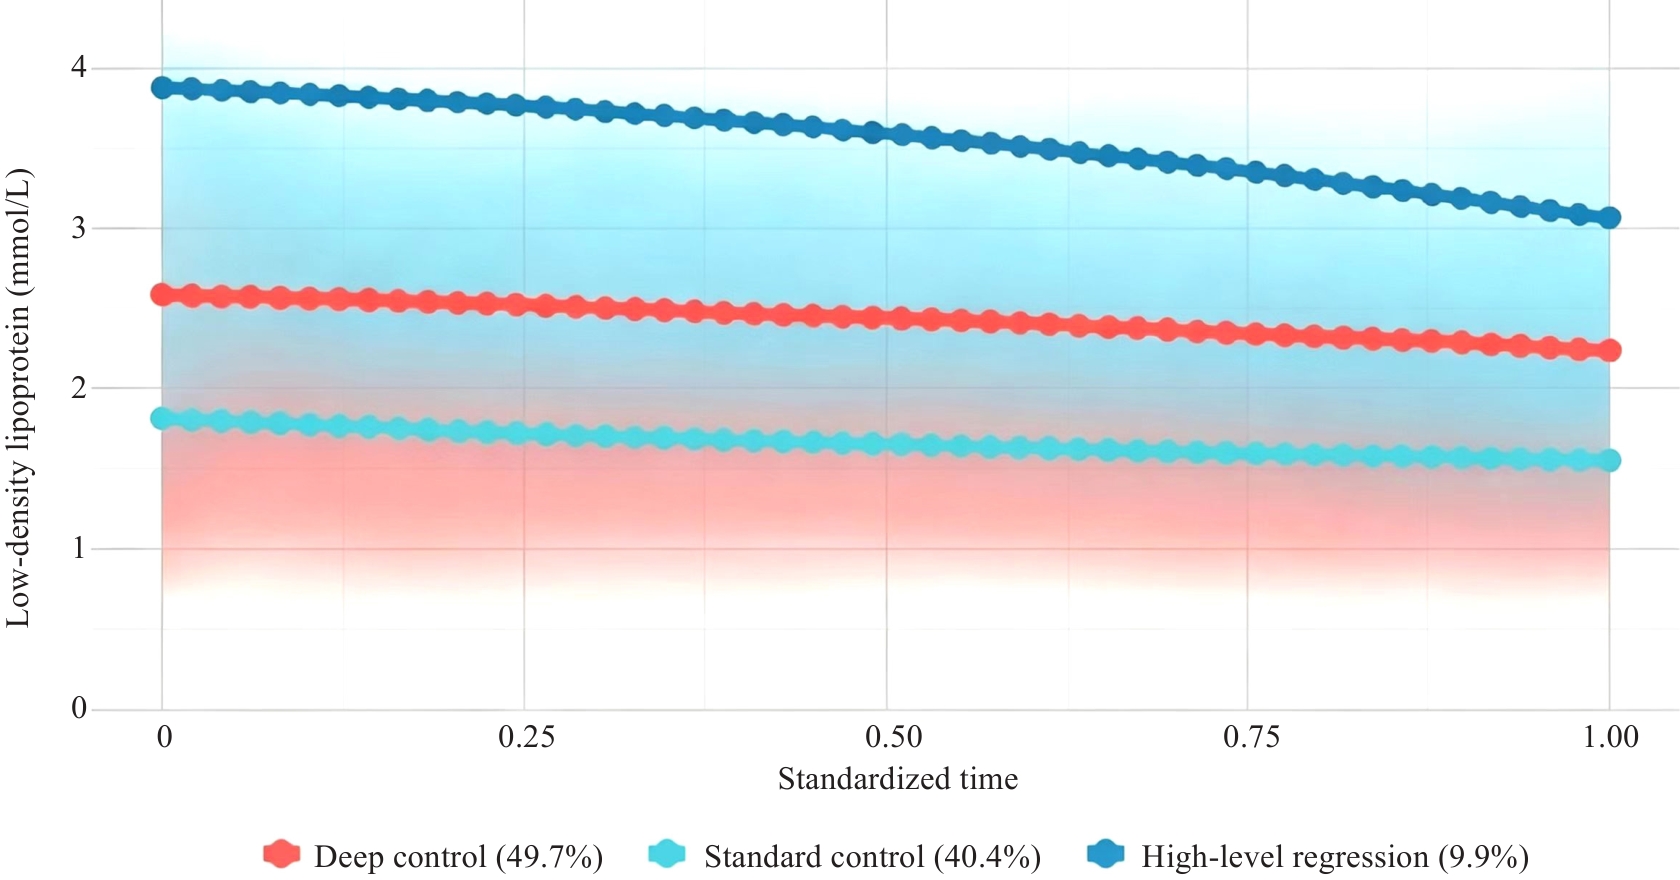
图1 低密度脂蛋白的变化轨迹
Fig.1 Trajectories of low-density lipoprotein.
| Trajectory cohort | Number of patients [n (%)] | Mean indicator values | ||
|---|---|---|---|---|
| Baseline | Endpoint | Overall | ||
| HbA1c | ||||
| Good control | 3378 (42.3) | 5.50 | 4.88 | 5.11 |
| Moderatel improvement | 3254 (40.7) | 7.12 | 6.16 | 6.64 |
| Poor control | 1359 (17.0) | 8.96 | 8.27 | 8.74 |
| LDL-C | ||||
| Deep control | 3970 (49.7) | 1.82 | 1.58 | 1.65 |
| Standard control | 3231 (40.4) | 2.59 | 2.25 | 2.41 |
| High-level regression | 790 (9.9) | 3.88 | 3.04 | 3.54 |
表2 LDL-C与HbA1c潜在类别轨迹组的基线及终点特征
Tab.2 Baseline and endpoint characteristics of latent class trajectory groups for LDL-C and HbA1c
| Trajectory cohort | Number of patients [n (%)] | Mean indicator values | ||
|---|---|---|---|---|
| Baseline | Endpoint | Overall | ||
| HbA1c | ||||
| Good control | 3378 (42.3) | 5.50 | 4.88 | 5.11 |
| Moderatel improvement | 3254 (40.7) | 7.12 | 6.16 | 6.64 |
| Poor control | 1359 (17.0) | 8.96 | 8.27 | 8.74 |
| LDL-C | ||||
| Deep control | 3970 (49.7) | 1.82 | 1.58 | 1.65 |
| Standard control | 3231 (40.4) | 2.59 | 2.25 | 2.41 |
| High-level regression | 790 (9.9) | 3.88 | 3.04 | 3.54 |
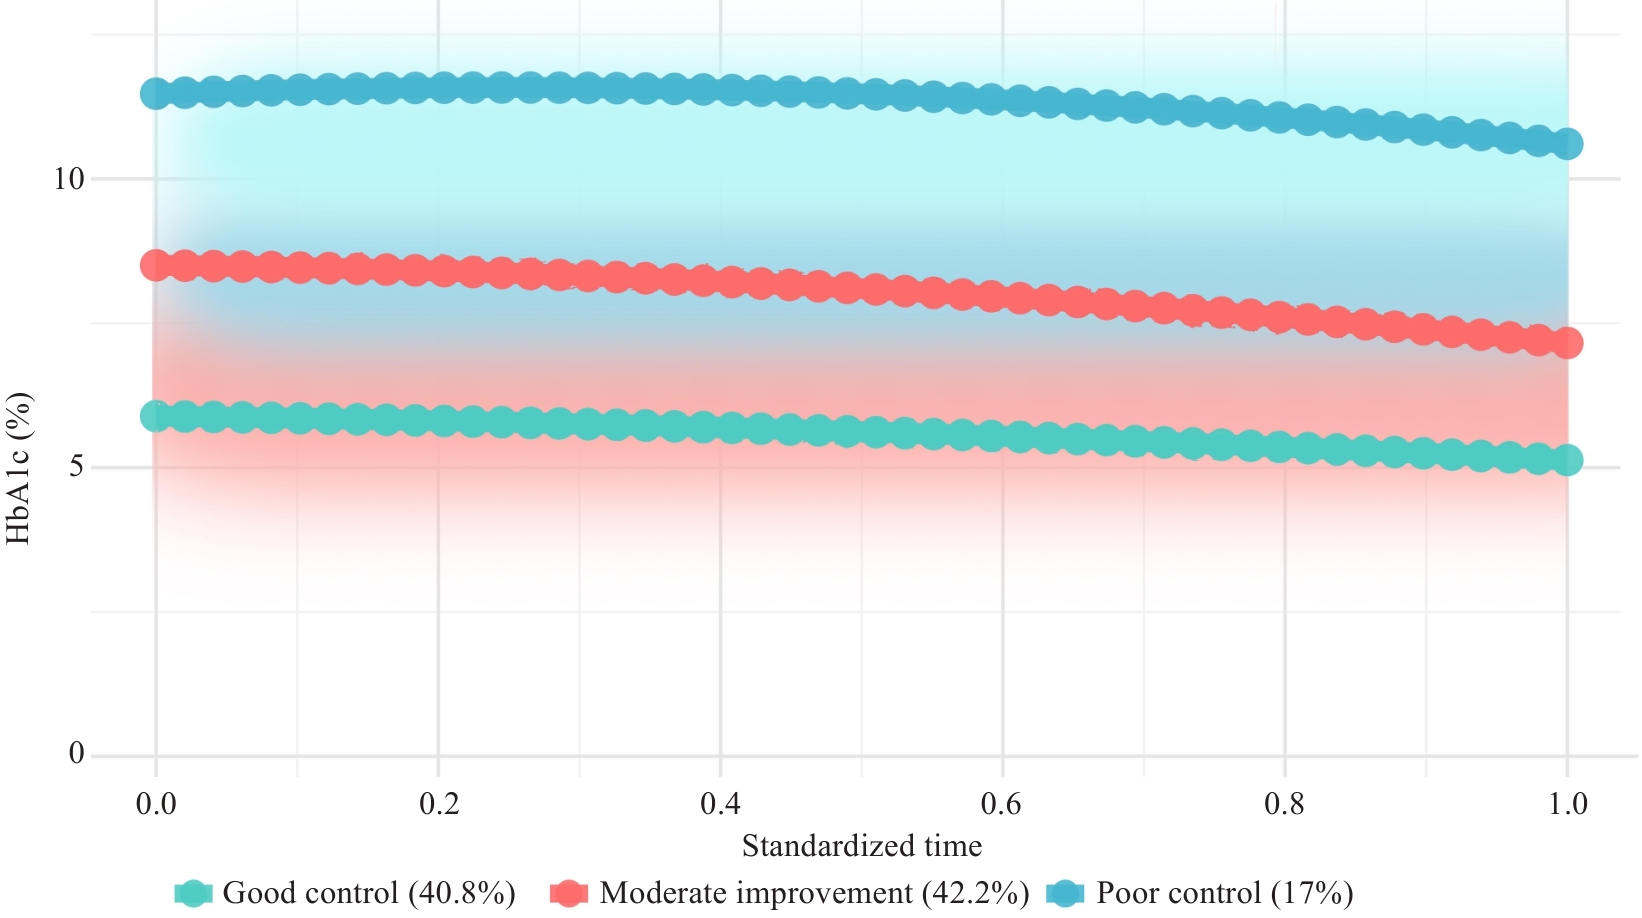
图2 糖化血红蛋白的变化轨迹
Fig.2 Trajectories of glycated hemoglobin.
| Item | Survival (n=7586) | Death (n=405) | Total (n=7991) | P |
|---|---|---|---|---|
| Age (year) | 58.21 (50.47, 64.55) | 65.46 (58.89, 71.69) | 58.58 (50.83, 65.04) | <0.001 |
| Male [n (%)] | 4300(56.7) | 240 (59.3) | 4540 (56.8) | 0.333 |
| BMI (kg/m2) | 25.78 (23.67, 28.37) | 25.51 (23.51, 28.58) | 25.78 (23.66, 28.38) | 0.431 |
| SBP (mmHg) | 130.00 (122.00, 140.00) | 130.00 (126.00, 140.00) | 130.00 (122.00, 140.00) | 0.002 |
| DBP (mmHg) | 80.00 (76.00, 85.00) | 80.00 (78.00, 86.00) | 80.00 (76.00, 85.00) | 0.247 |
| Laboratory tests | ||||
| Hemoglobin (g/L) | 139.00 (127.00, 152.00) | 126.00 (112.00, 141.00) | 139.00 (126.00, 151.00) | <0.001 |
| White blood cells (10⁹/L) | 6.79 (5.68, 8.12) | 7.00 (5.93, 8.53) | 6.79 (5.69, 8.14) | 0.017 |
| Neutrophils (10⁹/L) | 4.14 (3.28, 5.27) | 4.59 (3.61, 5.89) | 4.15 (3.30, 5.30) | <0.001 |
| Lymphocytes (10⁹/L) | 1.92 (1.51, 2.38) | 1.68 (1.26, 2.12) | 1.90 (1.50, 2.37) | <0.001 |
| Platelets (10⁹/L) | 226.00 (189.00, 270.00) | 210.00 (169.00, 258.00) | 226.00 (187.70, 269.00) | <0.001 |
| ALT (U/L) | 19.70 (14.00, 29.60) | 15.90 (11.40, 23.00) | 19.50 (14.00, 29.10) | <0.001 |
| AST (U/L) | 18.90 (15.00, 24.50) | 16.60 (13.50, 22.00) | 18.70 (15.00, 24.30) | <0.001 |
| Total protein (g/L) | 69.80 (64.50, 74.50) | 66.30 (60.60, 71.30) | 69.60 (64.20, 74.40) | <0.001 |
| Albumin (g/L) | 42.20 (38.70, 45.30) | 37.90 (34.10, 42.00) | 42.00 (38.50, 45.10) | <0.001 |
| Direct bilirubin (μmol/L) | 2.90 (2.00, 4.19) | 2.55 (1.60, 3.50) | 2.90 (1.98, 4.13) | <0.001 |
| Total bilirubin (μmol/L) | 7.90 (5.74, 10.70) | 5.90 (4.20, 8.65) | 7.85 (5.63, 10.61) | <0.001 |
| Total cholesterol (mmol/L) | 5.12 (4.31, 6.04) | 5.09 (4.20, 6.18) | 5.12 (4.30, 6.05) | 0.922 |
| Triglycerides (mmol/L) | 1.78 (1.23, 2.71) | 1.77 (1.21, 2.60) | 1.78 (1.23, 2.70) | 0.464 |
| HDL-C (mmol/L) | 1.13 (0.96, 1.35) | 1.09 (0.91, 1.33) | 1.13 (0.95, 1.35) | 0.001 |
| LDL-C( mmol/L) | 2.15 (1.70, 2.80) | 2.29 (1.74, 3.13) | 2.16 (1.70, 2.81) | 0.009 |
| Glucose (mmol/L) | 8.55 (6.84, 11.43) | 8.67 (6.44, 11.88) | 8.57 (6.83, 11.46) | 0.934 |
| Blood urea nitrogen (mmol/L) | 5.90 (4.73, 7.50) | 7.60 (5.89, 10.60) | 5.96 (4.76, 7.61) | <0.001 |
| Uric acid (μmol/L) | 335.00 (275.00, 410.00) | 352.00 (283.10, 445.90) | 336.00 (275.00, 411.00) | <0.001 |
| Serum creatinine (μmol/L) | 70.90 (57.00, 92.00) | 100.40 (74.00, 148.00) | 71.80 (57.30, 94.00) | <0.001 |
| eGFR [mL·min-1·(1.73 m²)-1] | 93.21 (71.11, 104.60) | 60.73 (38.36, 85.72) | 92.40 (68.84, 104.09) | <0.001 |
| INR | 0.94 (0.89, 1.00) | 0.96 (0.90, 1.03) | 0.94 (0.89, 1.00) | <0.001 |
| D-dimer (μg/mL) | 0.36 (0.22, 0.60) | 0.61 (0.33, 1.11) | 0.37 (0.22, 0.63) | <0.001 |
| Phosphorus (mmol/L) | 1.18 (1.06, 1.31) | 1.19 (1.05, 1.37) | 1.18 (1.06, 1.32) | 0.251 |
| Potassium (mmol/L) | 4.14 (3.86, 4.43) | 4.20 (3.85, 4.60) | 4.14 (3.86, 4.44) | 0.013 |
| Sodium (mmol/L) | 140.08 (138.00, 142.00) | 140.00 (137.40, 142.10) | 140.07 (138.00, 142.00) | 0.250 |
| Calcium (mmol/L) | 2.29 (2.19, 2.38) | 2.18 (2.05, 2.30) | 2.28 (2.18, 2.38) | <0.001 |
| 24-hour UTP (g/24 h) | 0.24 (0.11, 0.83) | 0.95 (0.26, 4.03) | 0.25 (0.11, 0.94) | <0.001 |
| CKD stage [n (%)] | <0.001 | |||
| G1 | 4237 (55.8) | 81 (20.0) | 4318 (54.0) | |
| G2 | 2057 (27.1) | 123 (30.4) | 2180 (27.3) | |
| G3 | 1063 (14.0) | 131 (32.3) | 1194 (14.9) | |
| G4 | 163 (2.1) | 46 (11.4) | 209 (2.6) | |
| G5 | 66 (0.9) | 24 (5.9) | 90 (1.1) | |
| Comorbidities | ||||
| Hypertension [n (%)] | 4629 (61.0) | 279 (68.9) | 4908 (61.4) | 0.002 |
| Duration of hypertension (year) | 0.84 (0.00, 3.69) | 0.75 (0.00, 3.19) | 0.84 (0.00, 3.64) | 0.332 |
| Duration of diabetes (year) | 2.43 (0.41, 5.12) | 2.06 (0.46, 4.76) | 2.40 (0.41, 5.09) | 0.215 |
| Dyslipidemia [n (%)] | 3208 (42.3) | 150 (37.0) | 3358 (42.0) | 0.042 |
表3 2型糖尿病合并慢性肾脏病患者按生存状态分层的基线特征
Tab.3 Baseline characteristics of T2DM patients with CKD stratified by survival status
| Item | Survival (n=7586) | Death (n=405) | Total (n=7991) | P |
|---|---|---|---|---|
| Age (year) | 58.21 (50.47, 64.55) | 65.46 (58.89, 71.69) | 58.58 (50.83, 65.04) | <0.001 |
| Male [n (%)] | 4300(56.7) | 240 (59.3) | 4540 (56.8) | 0.333 |
| BMI (kg/m2) | 25.78 (23.67, 28.37) | 25.51 (23.51, 28.58) | 25.78 (23.66, 28.38) | 0.431 |
| SBP (mmHg) | 130.00 (122.00, 140.00) | 130.00 (126.00, 140.00) | 130.00 (122.00, 140.00) | 0.002 |
| DBP (mmHg) | 80.00 (76.00, 85.00) | 80.00 (78.00, 86.00) | 80.00 (76.00, 85.00) | 0.247 |
| Laboratory tests | ||||
| Hemoglobin (g/L) | 139.00 (127.00, 152.00) | 126.00 (112.00, 141.00) | 139.00 (126.00, 151.00) | <0.001 |
| White blood cells (10⁹/L) | 6.79 (5.68, 8.12) | 7.00 (5.93, 8.53) | 6.79 (5.69, 8.14) | 0.017 |
| Neutrophils (10⁹/L) | 4.14 (3.28, 5.27) | 4.59 (3.61, 5.89) | 4.15 (3.30, 5.30) | <0.001 |
| Lymphocytes (10⁹/L) | 1.92 (1.51, 2.38) | 1.68 (1.26, 2.12) | 1.90 (1.50, 2.37) | <0.001 |
| Platelets (10⁹/L) | 226.00 (189.00, 270.00) | 210.00 (169.00, 258.00) | 226.00 (187.70, 269.00) | <0.001 |
| ALT (U/L) | 19.70 (14.00, 29.60) | 15.90 (11.40, 23.00) | 19.50 (14.00, 29.10) | <0.001 |
| AST (U/L) | 18.90 (15.00, 24.50) | 16.60 (13.50, 22.00) | 18.70 (15.00, 24.30) | <0.001 |
| Total protein (g/L) | 69.80 (64.50, 74.50) | 66.30 (60.60, 71.30) | 69.60 (64.20, 74.40) | <0.001 |
| Albumin (g/L) | 42.20 (38.70, 45.30) | 37.90 (34.10, 42.00) | 42.00 (38.50, 45.10) | <0.001 |
| Direct bilirubin (μmol/L) | 2.90 (2.00, 4.19) | 2.55 (1.60, 3.50) | 2.90 (1.98, 4.13) | <0.001 |
| Total bilirubin (μmol/L) | 7.90 (5.74, 10.70) | 5.90 (4.20, 8.65) | 7.85 (5.63, 10.61) | <0.001 |
| Total cholesterol (mmol/L) | 5.12 (4.31, 6.04) | 5.09 (4.20, 6.18) | 5.12 (4.30, 6.05) | 0.922 |
| Triglycerides (mmol/L) | 1.78 (1.23, 2.71) | 1.77 (1.21, 2.60) | 1.78 (1.23, 2.70) | 0.464 |
| HDL-C (mmol/L) | 1.13 (0.96, 1.35) | 1.09 (0.91, 1.33) | 1.13 (0.95, 1.35) | 0.001 |
| LDL-C( mmol/L) | 2.15 (1.70, 2.80) | 2.29 (1.74, 3.13) | 2.16 (1.70, 2.81) | 0.009 |
| Glucose (mmol/L) | 8.55 (6.84, 11.43) | 8.67 (6.44, 11.88) | 8.57 (6.83, 11.46) | 0.934 |
| Blood urea nitrogen (mmol/L) | 5.90 (4.73, 7.50) | 7.60 (5.89, 10.60) | 5.96 (4.76, 7.61) | <0.001 |
| Uric acid (μmol/L) | 335.00 (275.00, 410.00) | 352.00 (283.10, 445.90) | 336.00 (275.00, 411.00) | <0.001 |
| Serum creatinine (μmol/L) | 70.90 (57.00, 92.00) | 100.40 (74.00, 148.00) | 71.80 (57.30, 94.00) | <0.001 |
| eGFR [mL·min-1·(1.73 m²)-1] | 93.21 (71.11, 104.60) | 60.73 (38.36, 85.72) | 92.40 (68.84, 104.09) | <0.001 |
| INR | 0.94 (0.89, 1.00) | 0.96 (0.90, 1.03) | 0.94 (0.89, 1.00) | <0.001 |
| D-dimer (μg/mL) | 0.36 (0.22, 0.60) | 0.61 (0.33, 1.11) | 0.37 (0.22, 0.63) | <0.001 |
| Phosphorus (mmol/L) | 1.18 (1.06, 1.31) | 1.19 (1.05, 1.37) | 1.18 (1.06, 1.32) | 0.251 |
| Potassium (mmol/L) | 4.14 (3.86, 4.43) | 4.20 (3.85, 4.60) | 4.14 (3.86, 4.44) | 0.013 |
| Sodium (mmol/L) | 140.08 (138.00, 142.00) | 140.00 (137.40, 142.10) | 140.07 (138.00, 142.00) | 0.250 |
| Calcium (mmol/L) | 2.29 (2.19, 2.38) | 2.18 (2.05, 2.30) | 2.28 (2.18, 2.38) | <0.001 |
| 24-hour UTP (g/24 h) | 0.24 (0.11, 0.83) | 0.95 (0.26, 4.03) | 0.25 (0.11, 0.94) | <0.001 |
| CKD stage [n (%)] | <0.001 | |||
| G1 | 4237 (55.8) | 81 (20.0) | 4318 (54.0) | |
| G2 | 2057 (27.1) | 123 (30.4) | 2180 (27.3) | |
| G3 | 1063 (14.0) | 131 (32.3) | 1194 (14.9) | |
| G4 | 163 (2.1) | 46 (11.4) | 209 (2.6) | |
| G5 | 66 (0.9) | 24 (5.9) | 90 (1.1) | |
| Comorbidities | ||||
| Hypertension [n (%)] | 4629 (61.0) | 279 (68.9) | 4908 (61.4) | 0.002 |
| Duration of hypertension (year) | 0.84 (0.00, 3.69) | 0.75 (0.00, 3.19) | 0.84 (0.00, 3.64) | 0.332 |
| Duration of diabetes (year) | 2.43 (0.41, 5.12) | 2.06 (0.46, 4.76) | 2.40 (0.41, 5.09) | 0.215 |
| Dyslipidemia [n (%)] | 3208 (42.3) | 150 (37.0) | 3358 (42.0) | 0.042 |
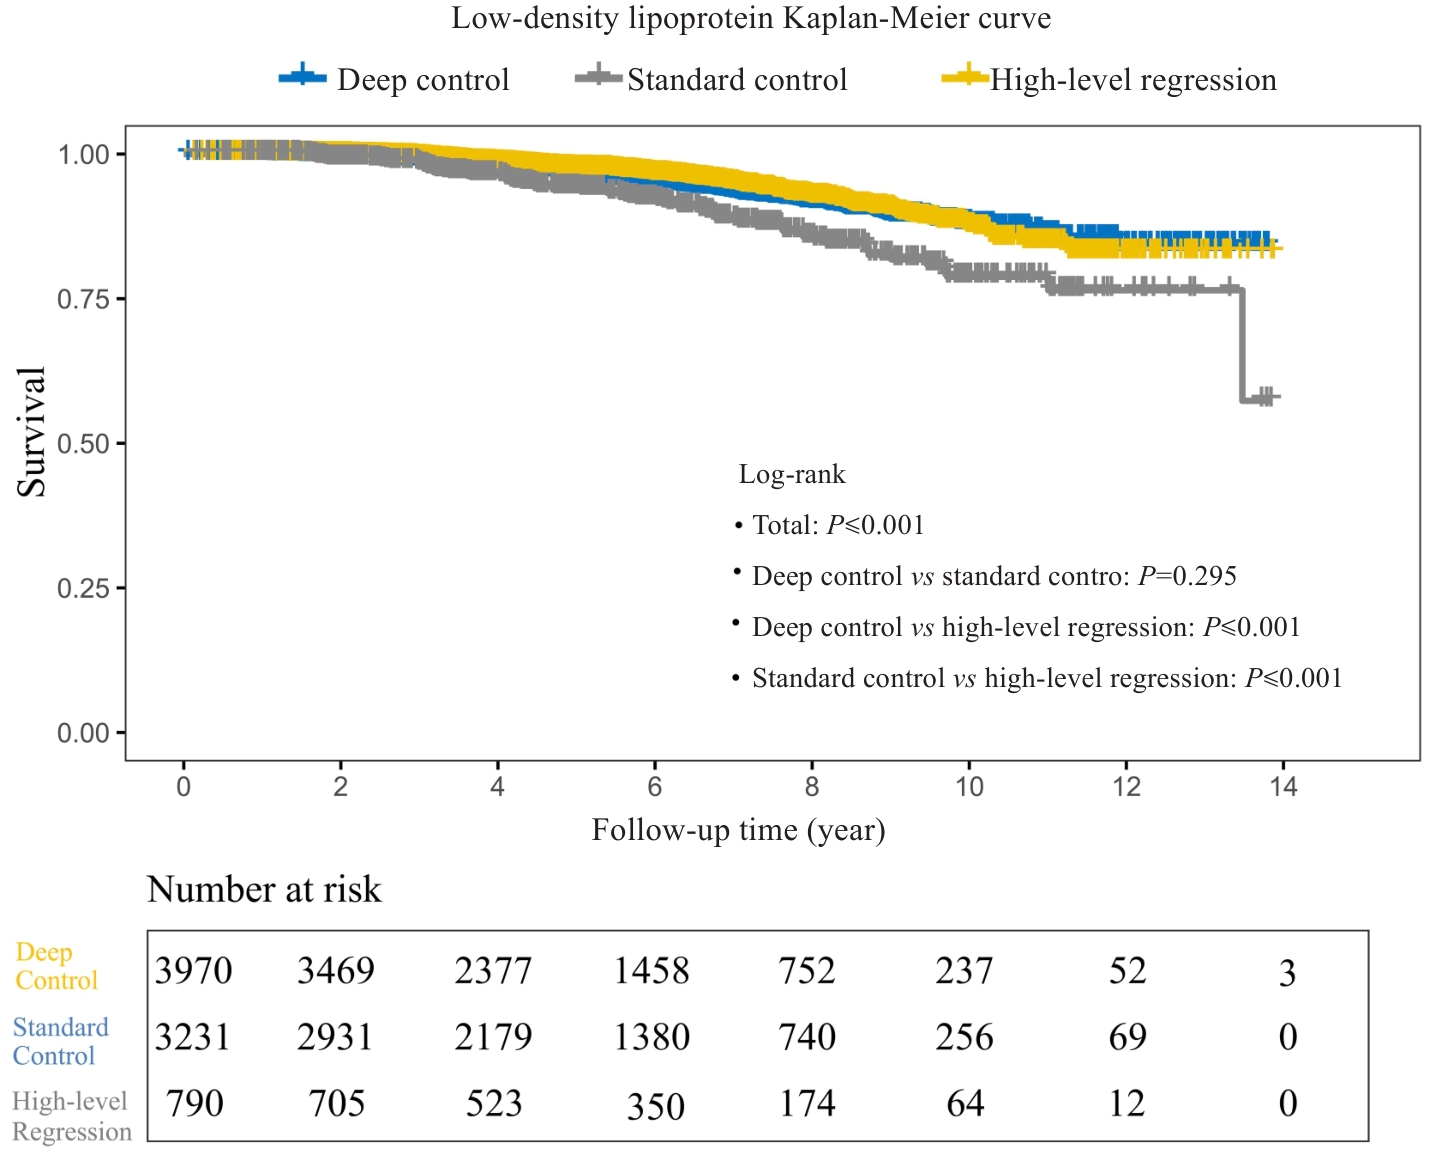
图3 LDL轨迹与全因死亡率的Kaplan-Meier生存分析
Fig.3 Kaplan-Meier survival analysis of LDL trajectories and all-cause mortality.
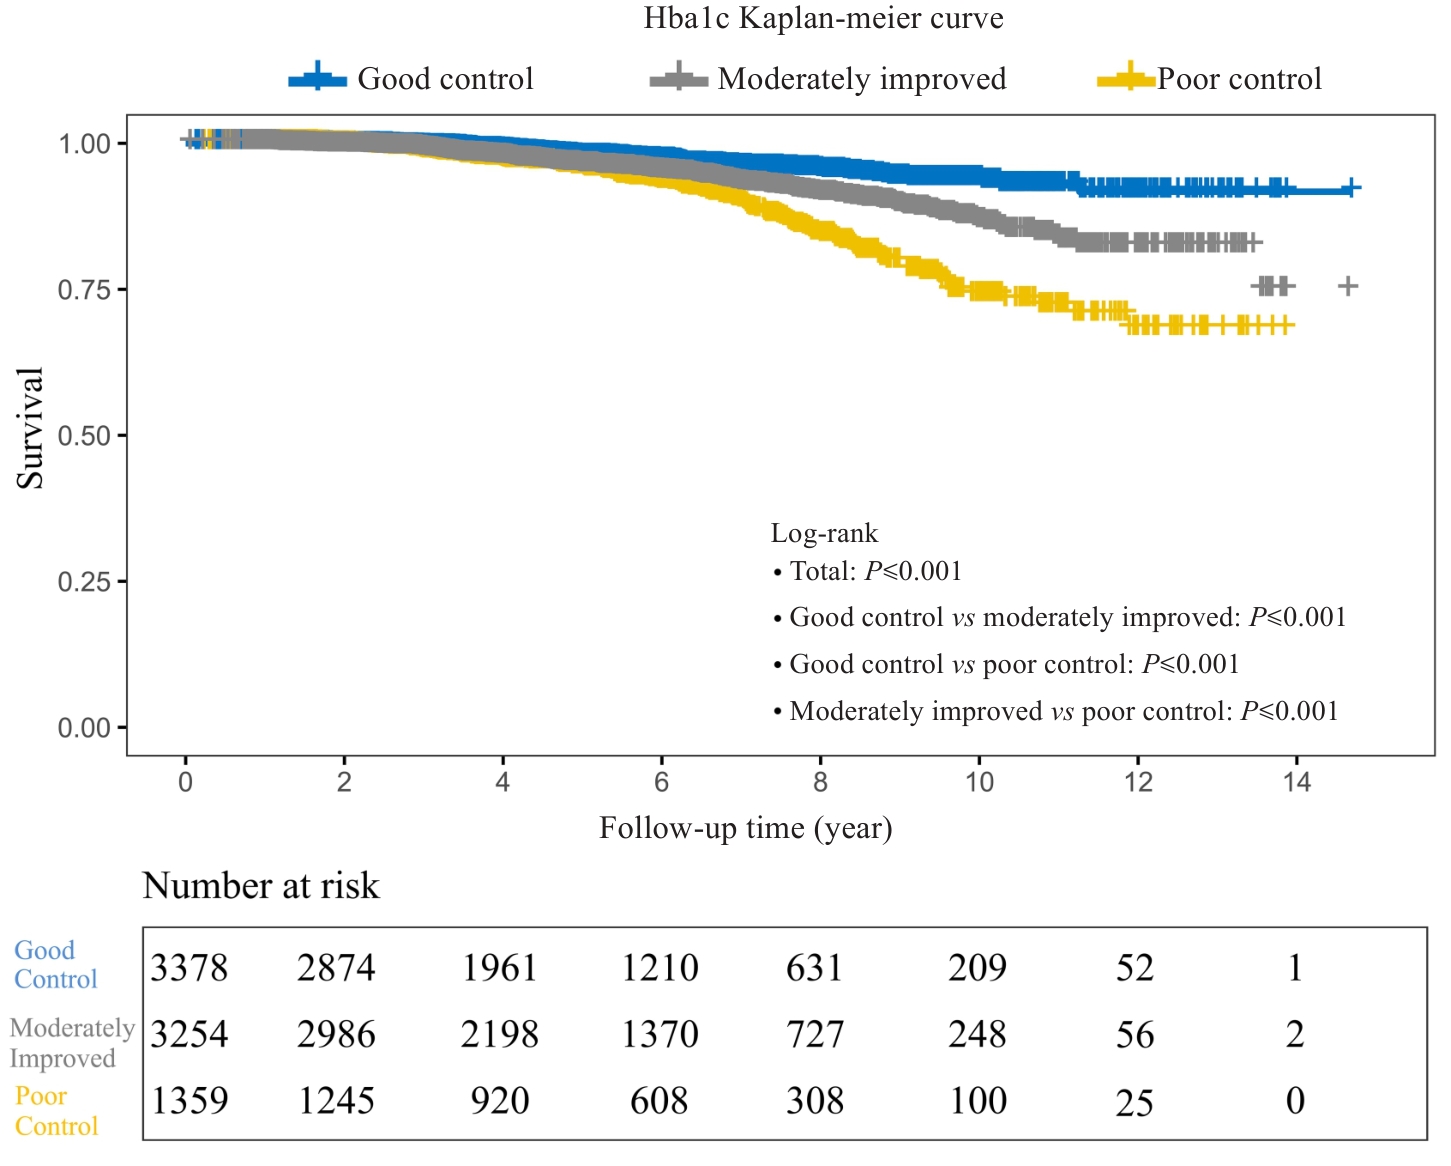
图4 HbA1c轨迹与全因死亡率的Kaplan-Meier生存分析
Fig.4 Kaplan-Meier survival analysis of HbA1c trajectories and all-cause mortality.
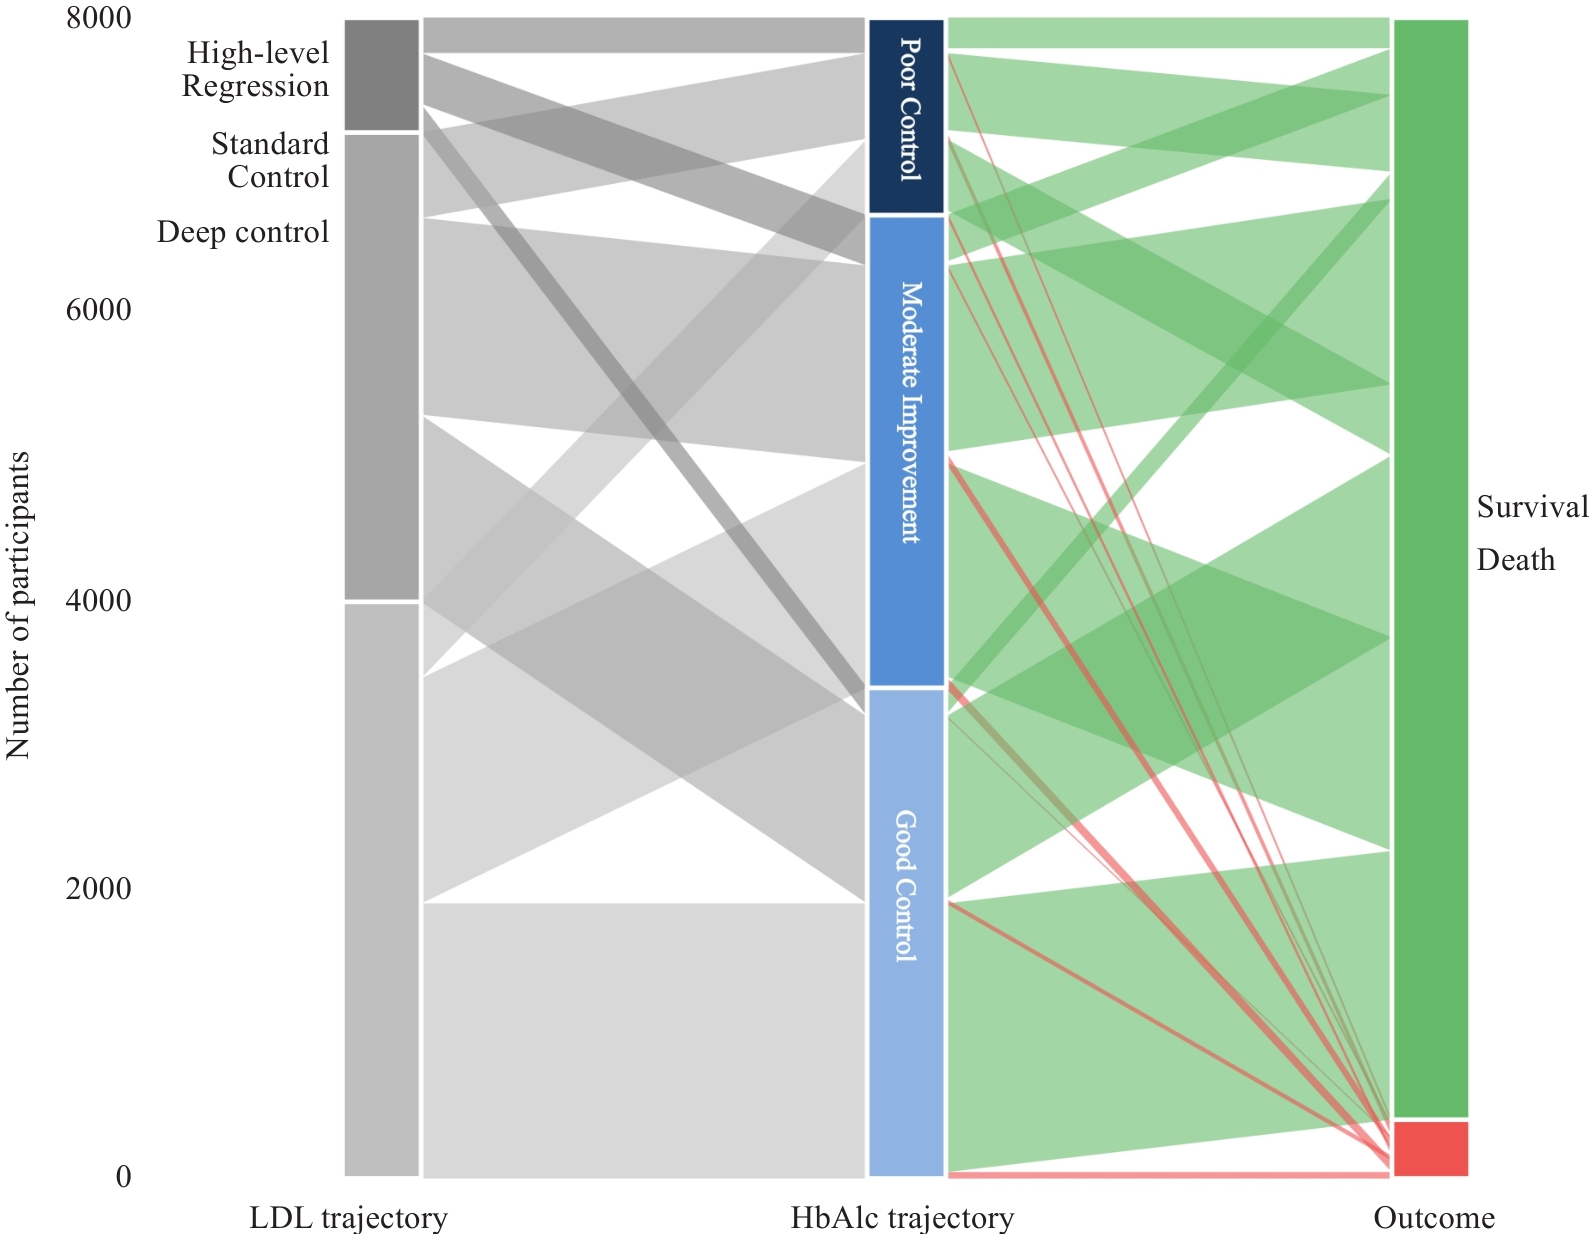
图5 LDL-C与HbA1c轨迹向临床结局演变的多维流动桑基图
Fig.5 Multidimensional flow Sankey diagram of the evolution from LDL-C and HbA1c trajectories to clinical outcomes.
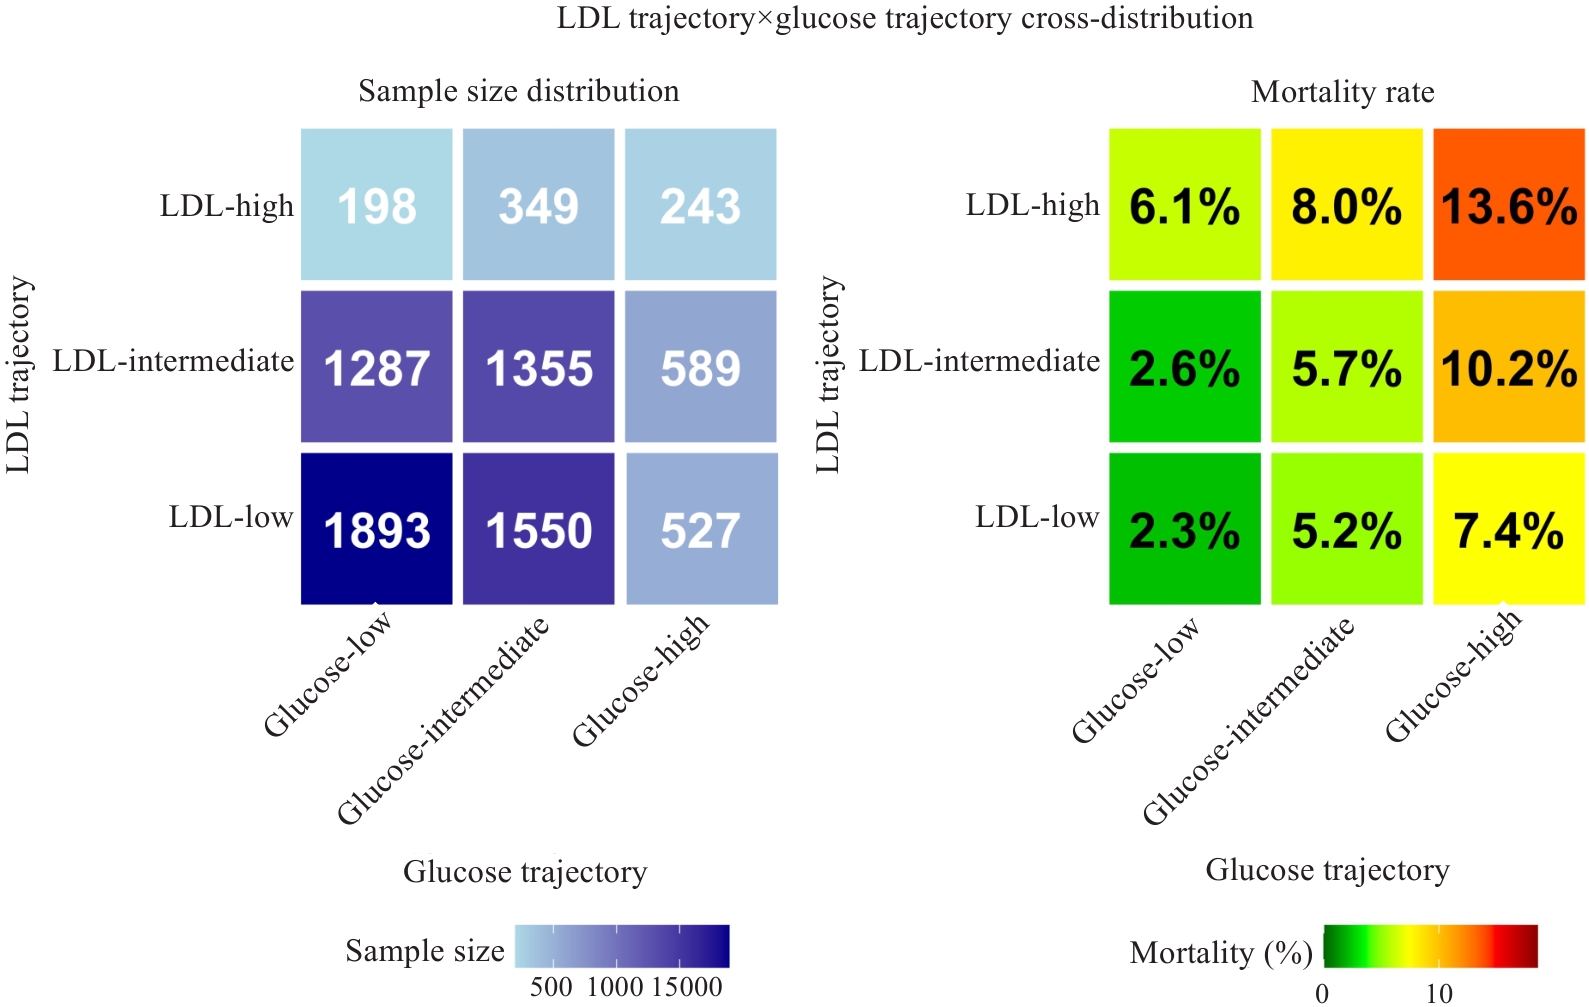
图6 LDL-C与HbA1c双轨迹交叉分布及死亡率热图
Fig.6 Heatmap of cross-distribution and mortality rates for LDL-C and HbA1c dual trajectories.
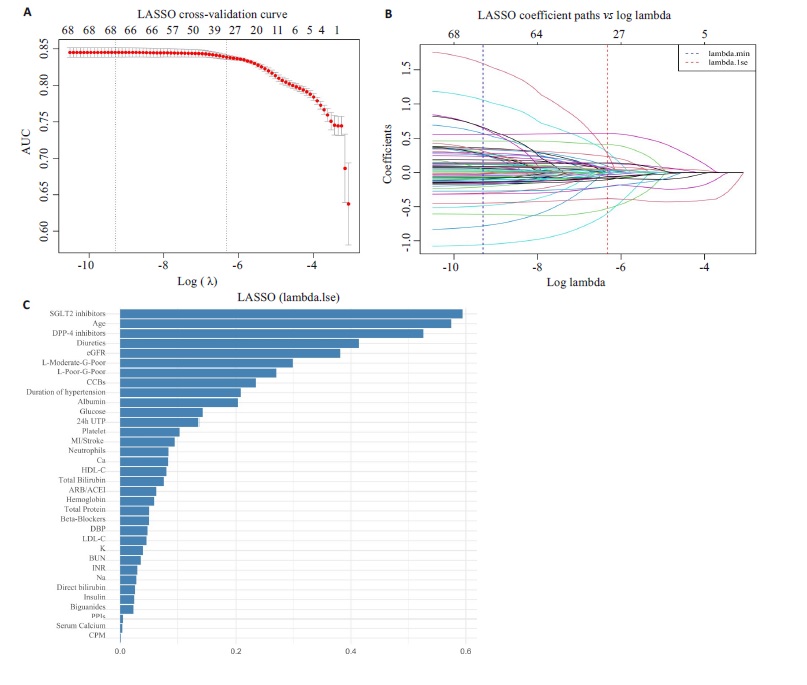
图8 基于 LASSO 算法的特征选择
Fig.8 Feature selection based on the LASSOalgorithm. A: Selection of the tuning parameter(λ) for the LASSO model using 5-fold crossvalidationbased on the minimum criterion. Theoptimal λ value was 0.001793. B: LASSOcoefficient profiles of clinical features. C:LASSO variable importance ranking plot,illustrating the relative weight distribution ofthe absolute values of the coefficients for eachfeature in the model.
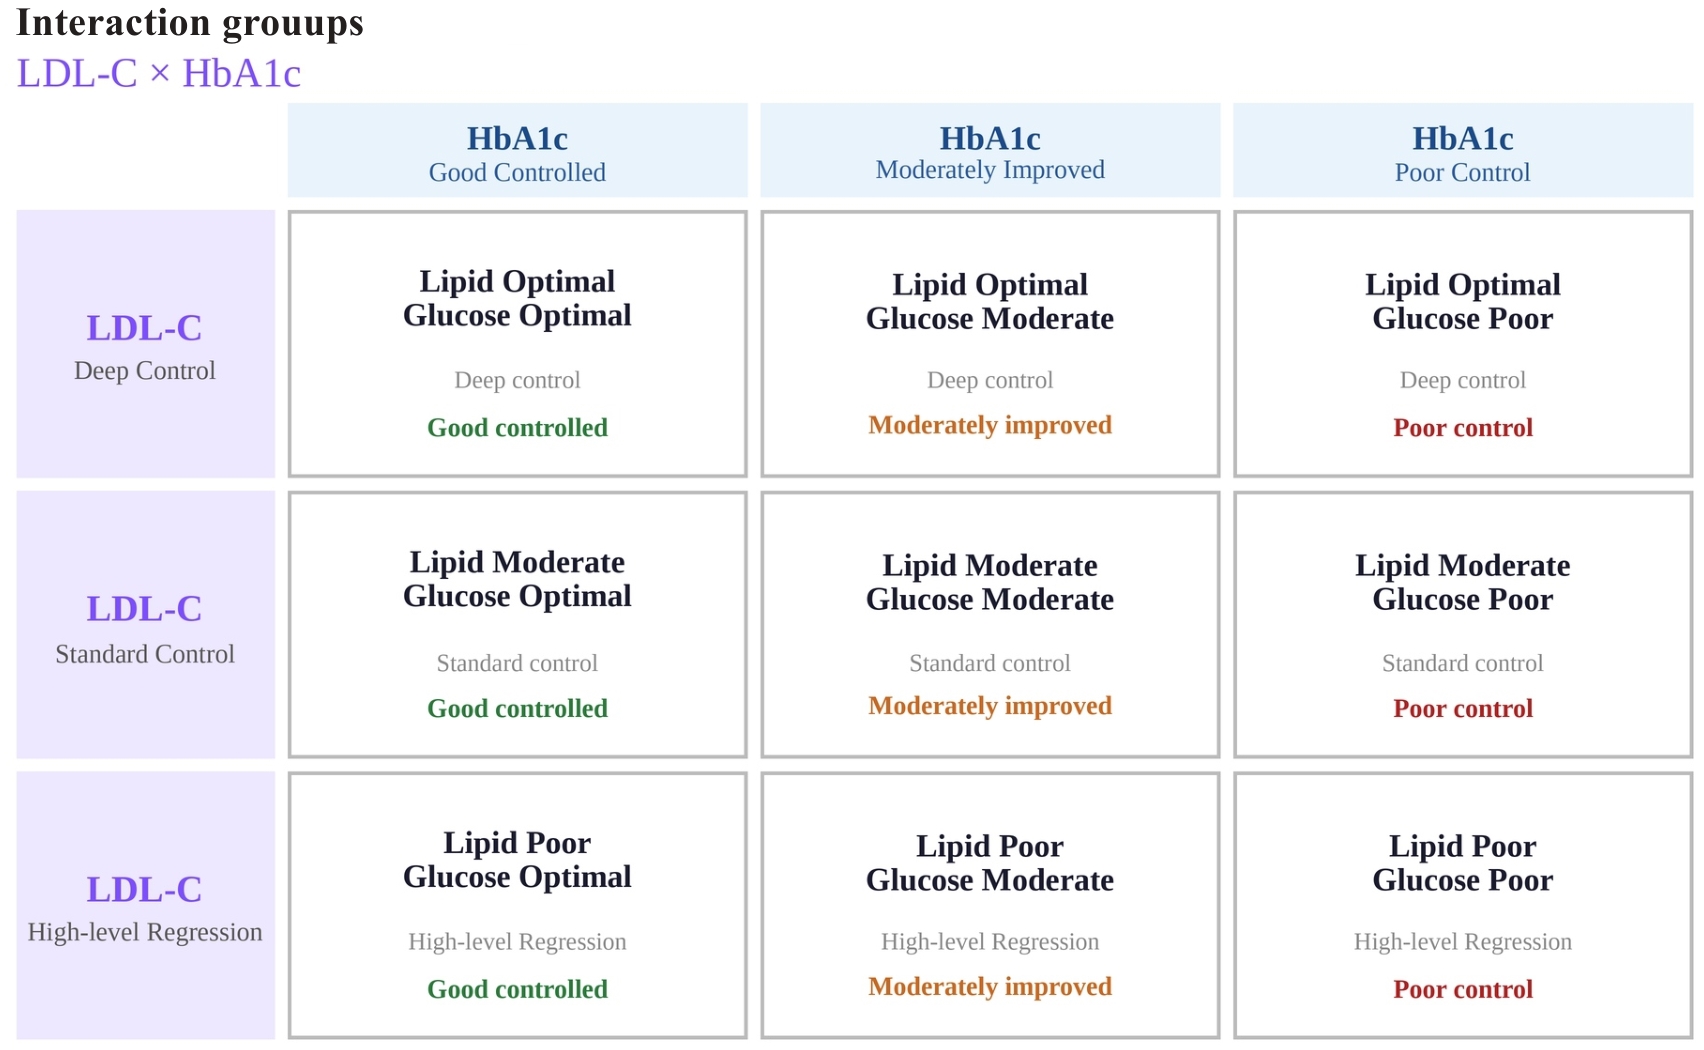
图7 LDL-C与HbA1c双轨迹交叉分组命名体系
Fig.7 Nomenclature system for the cross-grouping of LDL-C and HbA1c dual trajectories.
| Risk factor | Model 1 | Model 2 | Model 3 | |||
|---|---|---|---|---|---|---|
| HR (95% CI) | P | HR (95% CI) | P | HR (95% CI) | P | |
| Lipid optimal glucose optimal | 1.0 (Reference) | 1.0 (Reference) | 1.0 (Reference) | |||
| Lipid optimal glucose moderate | 1.840 (1.269-2.668) | 0.001 | 1.239 (0.847-1.814) | 0.270 | 1.160 (0.792-1.700) | 0.445 |
| Lipid optimal glucose poor | 2.302 (1.492-3.552) | <0.001 | 1.394 (0.890-2.184) | 0.146 | 1.177 (0.748-1.852) | 0.480 |
| Lipid moderate glucose optimal | 0.891 (0.566-1.402) | 0.616 | 1.061 (0.667-1.686) | 0.803 | 1.002 (0.630-1.593) | 0.994 |
| Lipid moderate glucose moderate | 1.813 (1.248-2.634) | 0.002 | 1.506 (1.023-2.218) | 0.038 | 1.454 (0.987-2.142) | 0.058 |
| Lipid moderate glucose poor | 3.392 (2.292-5.018) | <0.001 | 2.619 (1.745-3.933) | <0.001 | 2.343 (1.554-3.533) | <0.001 |
| Lipid poor glucose optimal | 1.989 (1.049-3.772) | 0.035 | 2.147 (1.104-4.173) | 0.024 | 2.015 (1.036-3.918) | 0.039 |
| Lipid poor glucose moderate | 2.471 (1.535-3.979) | <0.001 | 2.162 (1.287-3.631) | 0.004 | 2.142 (1.273-3.606) | 0.004 |
| Lipid poor glucose poor | 5.457 (3.467-8.591) | <0.001 | 5.551 (3.323-9.273) | <0.001 | 5.550 (3.322-9.274) | <0.001 |
| Age (year) | 1.061 (1.048-1.074) | <0.001 | 1.060 (1.047-1.073) | <0.001 | ||
| Hypertension duration (year) | 1.036 (0.989-1.085) | 0.140 | 1.017 (0.969-1.067) | 0.492 | ||
| MI/Stroke | 1.672 (1.339-2.090) | <0.001 | 1.589 (1.270-1.988) | <0.001 | ||
| DBP (mmHg) | 1.015 (1.004-1.027) | 0.010 | 1.011 (1.000-1.023) | 0.049 | ||
| Platelets (10⁹/L) | 0.998 (0.997-1.000) | 0.021 | 0.998 (0.997-1.000) | 0.031 | ||
| Neutrophils (10⁹/L) | 1.058 (1.016-1.101) | 0.006 | 1.051 (1.010-1.095) | 0.015 | ||
| Hemoglobin (g/L) | 0.994 (0.989-1.000) | 0.059 | 0.996 (0.991-1.002) | 0.226 | ||
| INR | 1.244 (0.627-2.469) | 0.532 | 1.379 (0.706-2.692) | 0.347 | ||
| Albumin (g/L) | 0.909 (0.887-0.932) | <0.001 | 0.916 (0.893-0.940) | <0.001 | ||
| Total protein (g/L) | 1.038 (1.021-1.055) | <0.001 | 1.042 (1.025-1.060) | <0.001 | ||
| Direct bilirubin (μmol/L) | 1.004 (0.983-1.025) | 0.730 | 1.010 (0.988-1.032) | 0.376 | ||
| Indirect bilirubin (μmol/L) | 0.999 (0.972-1.027) | 0.962 | 0.996 (0.970-1.022) | 0.740 | ||
| HDL-C (mmol/L) | 0.678 (0.481-0.954) | 0.026 | 0.734 (0.522-1.033) | 0.076 | ||
| Potassium (mmol/L) | 0.852 (0.698-1.039) | 0.113 | 0.862 (0.708-1.050) | 0.140 | ||
| Sodium (mmol/L) | 0.987 (0.964-1.011) | 0.282 | 0.993 (0.969-1.018) | 0.573 | ||
| Calcium (mmol/L) | 0.905 (0.617-1.327) | 0.609 | 0.882 (0.597-1.303) | 0.528 | ||
| Blood urea nitrogen (mmol/L) | 1.027 (1.001-1.054) | 0.042 | 1.024 (0.997-1.052) | 0.077 | ||
| Serum creatinine (μmol/L) | 1.000 (0.998-1.001) | 0.807 | 1.000 (0.998-1.002) | 0.819 | ||
| 24-hour UTP (g/24 h) | 1.124 (1.088-1.160) | <0.001 | 1.107 (1.071-1.144) | <0.001 | ||
| Glucose (mmol/L) | 1.048 (1.026-1.072) | <0.001 | 1.046 (1.023-1.071) | <0.001 | ||
| eGFR (mL/min/1.73 m²) | 0.981 (0.976-0.987) | <0.001 | 0.984 (0.978-0.991) | <0.001 | ||
| Proton pump inhibitors | 1.068 (0.854-1.337) | 0.563 | ||||
| β-blockers | 1.131 (0.912-1.404) | 0.262 | ||||
| Calcium channel blockers | 1.345 (1.056-1.713) | 0.017 | ||||
| Diuretics | 1.715 (1.352-2.175) | <0.001 | ||||
| Biguanides | 0.898 (0.715-1.128) | 0.354 | ||||
| CPM | 1.112 (0.856-1.445) | 0.426 | ||||
| ARB/ACEI | 1.123 (0.884-1.426) | 0.342 | ||||
| DPP4 inhibitors | 1.135 (0.833-1.547) | 0.423 | ||||
| SGLT2 inhibitors | 1.064 (0.592-1.912) | 0.836 | ||||
| Insulin | 1.346 (0.953-1.901) | 0.092 | ||||
表4 T2DM合并CKD患者全因死亡风险因素的多变量Cox回归分析
Tab.4 Multivariate Cox regression analysis of risk factors for all-cause mortality in T2DM patients with CKD
| Risk factor | Model 1 | Model 2 | Model 3 | |||
|---|---|---|---|---|---|---|
| HR (95% CI) | P | HR (95% CI) | P | HR (95% CI) | P | |
| Lipid optimal glucose optimal | 1.0 (Reference) | 1.0 (Reference) | 1.0 (Reference) | |||
| Lipid optimal glucose moderate | 1.840 (1.269-2.668) | 0.001 | 1.239 (0.847-1.814) | 0.270 | 1.160 (0.792-1.700) | 0.445 |
| Lipid optimal glucose poor | 2.302 (1.492-3.552) | <0.001 | 1.394 (0.890-2.184) | 0.146 | 1.177 (0.748-1.852) | 0.480 |
| Lipid moderate glucose optimal | 0.891 (0.566-1.402) | 0.616 | 1.061 (0.667-1.686) | 0.803 | 1.002 (0.630-1.593) | 0.994 |
| Lipid moderate glucose moderate | 1.813 (1.248-2.634) | 0.002 | 1.506 (1.023-2.218) | 0.038 | 1.454 (0.987-2.142) | 0.058 |
| Lipid moderate glucose poor | 3.392 (2.292-5.018) | <0.001 | 2.619 (1.745-3.933) | <0.001 | 2.343 (1.554-3.533) | <0.001 |
| Lipid poor glucose optimal | 1.989 (1.049-3.772) | 0.035 | 2.147 (1.104-4.173) | 0.024 | 2.015 (1.036-3.918) | 0.039 |
| Lipid poor glucose moderate | 2.471 (1.535-3.979) | <0.001 | 2.162 (1.287-3.631) | 0.004 | 2.142 (1.273-3.606) | 0.004 |
| Lipid poor glucose poor | 5.457 (3.467-8.591) | <0.001 | 5.551 (3.323-9.273) | <0.001 | 5.550 (3.322-9.274) | <0.001 |
| Age (year) | 1.061 (1.048-1.074) | <0.001 | 1.060 (1.047-1.073) | <0.001 | ||
| Hypertension duration (year) | 1.036 (0.989-1.085) | 0.140 | 1.017 (0.969-1.067) | 0.492 | ||
| MI/Stroke | 1.672 (1.339-2.090) | <0.001 | 1.589 (1.270-1.988) | <0.001 | ||
| DBP (mmHg) | 1.015 (1.004-1.027) | 0.010 | 1.011 (1.000-1.023) | 0.049 | ||
| Platelets (10⁹/L) | 0.998 (0.997-1.000) | 0.021 | 0.998 (0.997-1.000) | 0.031 | ||
| Neutrophils (10⁹/L) | 1.058 (1.016-1.101) | 0.006 | 1.051 (1.010-1.095) | 0.015 | ||
| Hemoglobin (g/L) | 0.994 (0.989-1.000) | 0.059 | 0.996 (0.991-1.002) | 0.226 | ||
| INR | 1.244 (0.627-2.469) | 0.532 | 1.379 (0.706-2.692) | 0.347 | ||
| Albumin (g/L) | 0.909 (0.887-0.932) | <0.001 | 0.916 (0.893-0.940) | <0.001 | ||
| Total protein (g/L) | 1.038 (1.021-1.055) | <0.001 | 1.042 (1.025-1.060) | <0.001 | ||
| Direct bilirubin (μmol/L) | 1.004 (0.983-1.025) | 0.730 | 1.010 (0.988-1.032) | 0.376 | ||
| Indirect bilirubin (μmol/L) | 0.999 (0.972-1.027) | 0.962 | 0.996 (0.970-1.022) | 0.740 | ||
| HDL-C (mmol/L) | 0.678 (0.481-0.954) | 0.026 | 0.734 (0.522-1.033) | 0.076 | ||
| Potassium (mmol/L) | 0.852 (0.698-1.039) | 0.113 | 0.862 (0.708-1.050) | 0.140 | ||
| Sodium (mmol/L) | 0.987 (0.964-1.011) | 0.282 | 0.993 (0.969-1.018) | 0.573 | ||
| Calcium (mmol/L) | 0.905 (0.617-1.327) | 0.609 | 0.882 (0.597-1.303) | 0.528 | ||
| Blood urea nitrogen (mmol/L) | 1.027 (1.001-1.054) | 0.042 | 1.024 (0.997-1.052) | 0.077 | ||
| Serum creatinine (μmol/L) | 1.000 (0.998-1.001) | 0.807 | 1.000 (0.998-1.002) | 0.819 | ||
| 24-hour UTP (g/24 h) | 1.124 (1.088-1.160) | <0.001 | 1.107 (1.071-1.144) | <0.001 | ||
| Glucose (mmol/L) | 1.048 (1.026-1.072) | <0.001 | 1.046 (1.023-1.071) | <0.001 | ||
| eGFR (mL/min/1.73 m²) | 0.981 (0.976-0.987) | <0.001 | 0.984 (0.978-0.991) | <0.001 | ||
| Proton pump inhibitors | 1.068 (0.854-1.337) | 0.563 | ||||
| β-blockers | 1.131 (0.912-1.404) | 0.262 | ||||
| Calcium channel blockers | 1.345 (1.056-1.713) | 0.017 | ||||
| Diuretics | 1.715 (1.352-2.175) | <0.001 | ||||
| Biguanides | 0.898 (0.715-1.128) | 0.354 | ||||
| CPM | 1.112 (0.856-1.445) | 0.426 | ||||
| ARB/ACEI | 1.123 (0.884-1.426) | 0.342 | ||||
| DPP4 inhibitors | 1.135 (0.833-1.547) | 0.423 | ||||
| SGLT2 inhibitors | 1.064 (0.592-1.912) | 0.836 | ||||
| Insulin | 1.346 (0.953-1.901) | 0.092 | ||||
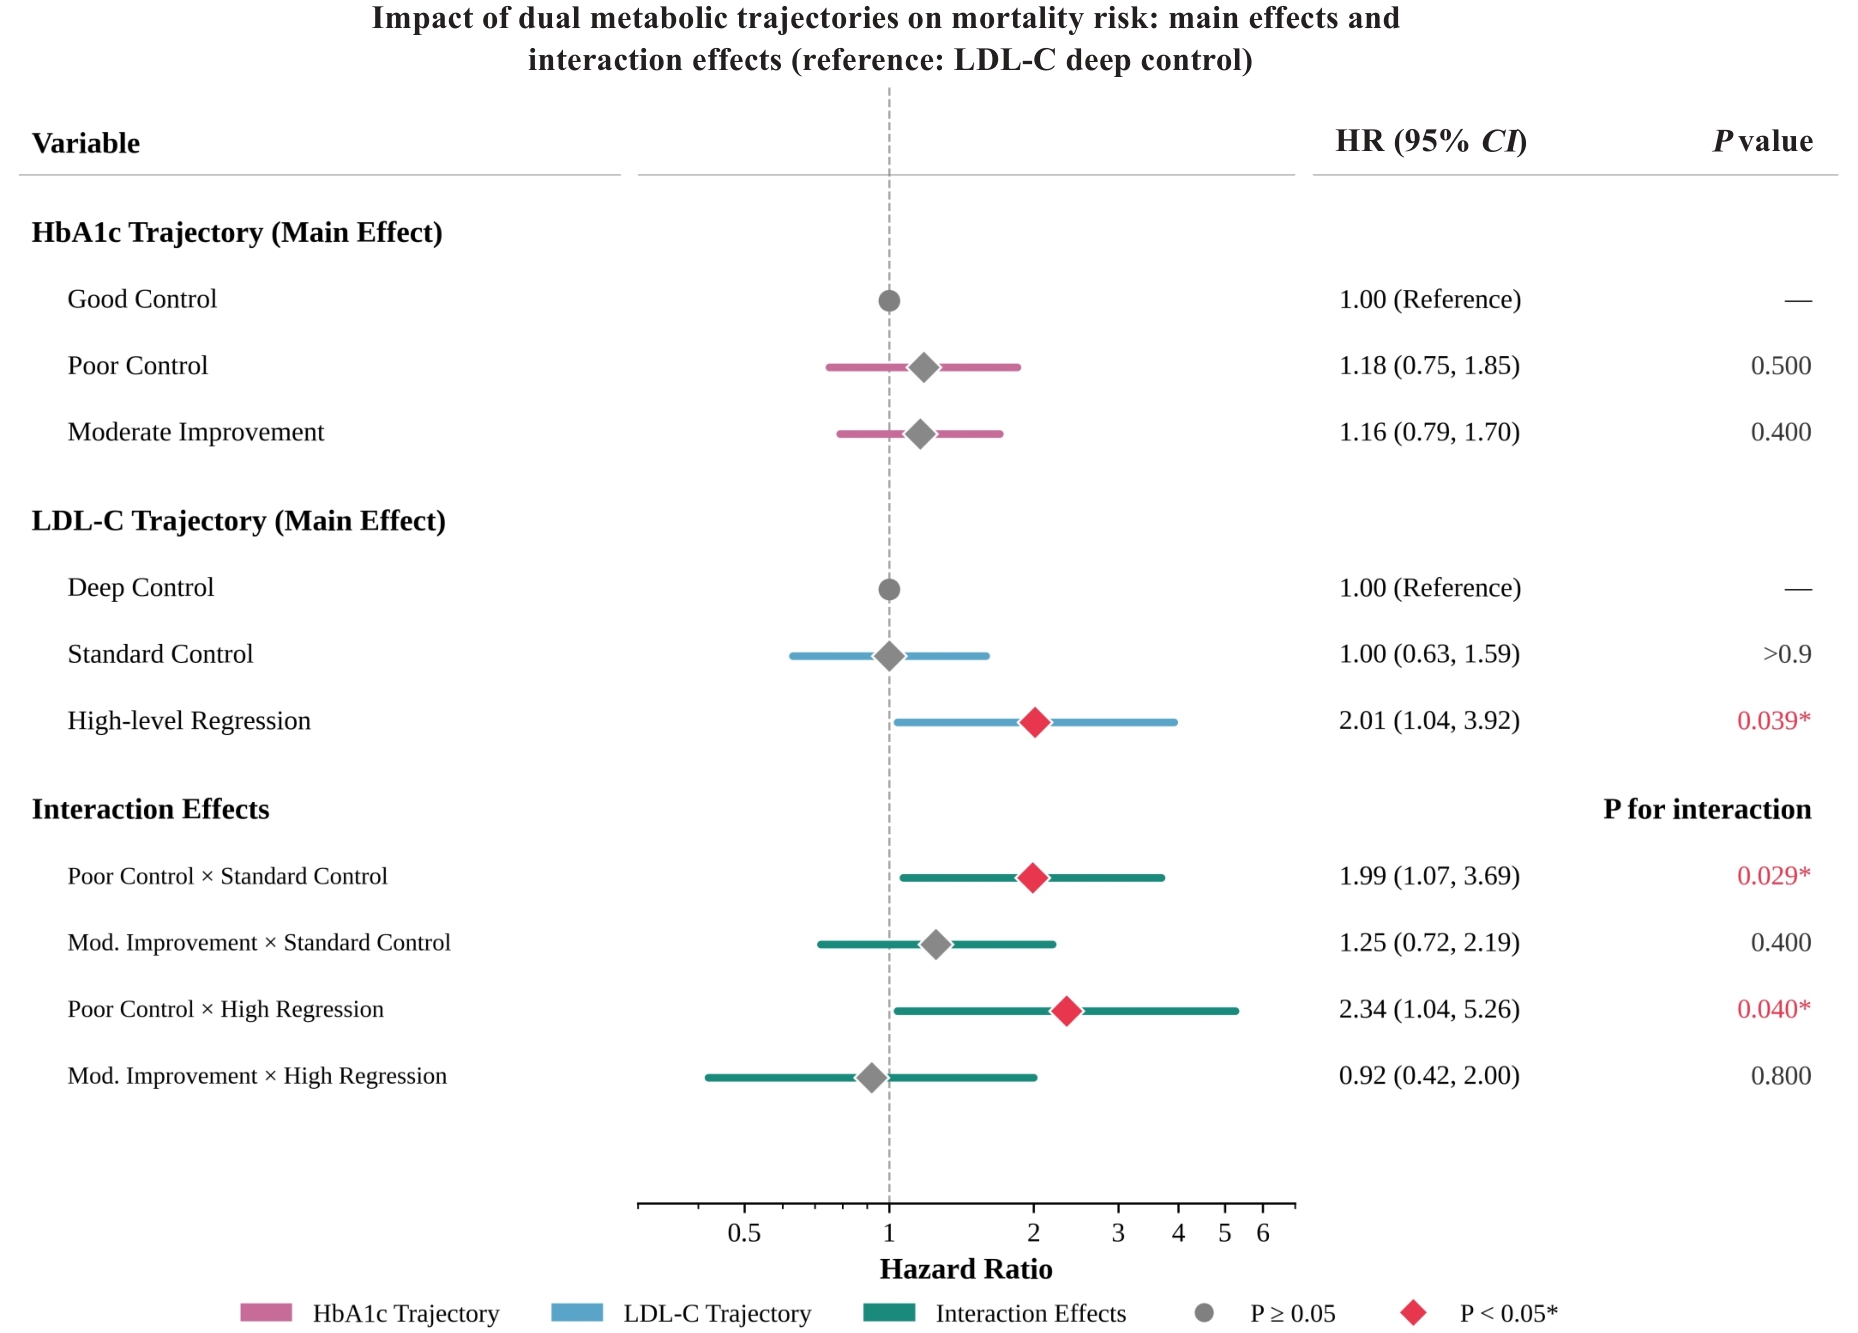
图9 双代谢轨迹对死亡风险的主效应与交互效应(以深度控制为参照)
Fig.9 Main effects and interaction effects of dual metabolic trajectories on mortality risk (with intensive control as the reference). The multivariate Cox regression model adjusted for age, duration of hypertension, stroke history, diastolic blood pressure, laboratory parameters (platelets, neutrophils, hemoglobin, INR, albumin, total protein, direct/indirect bilirubin, HDL-C, potassium, sodium, calcium, BUN, serum creatinine, 24-hour UTP, glucose, eGFR), and medications (PPIs, β-blockers, CCBs, diuretics, biguanides, CPM, RAS inhibitors, DPP-4 inhibitors, SGLT-2 inhibitors, insulin).
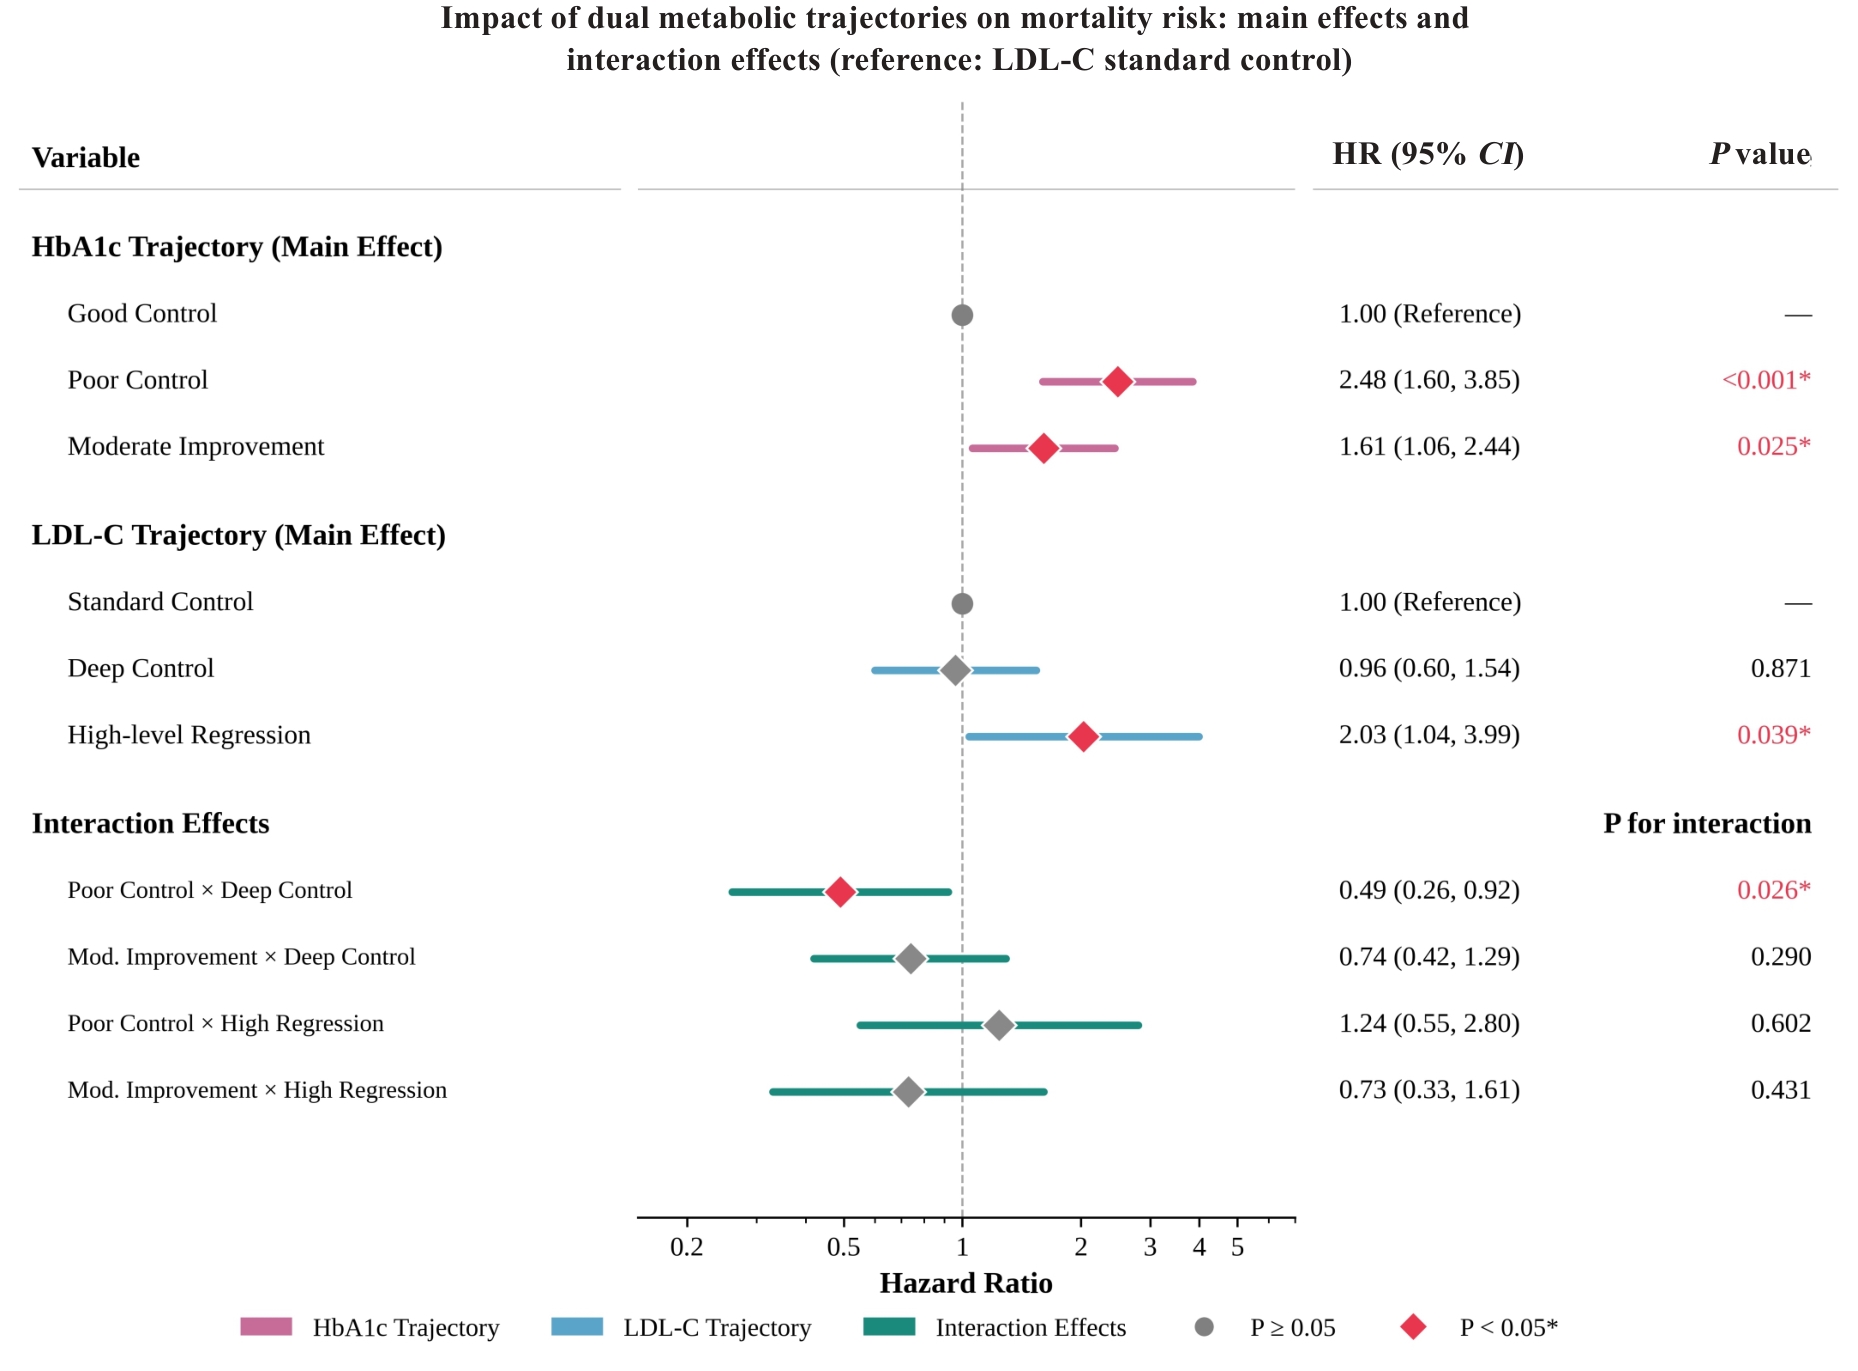
图10 双代谢轨迹对死亡风险的主效应与交互效应(以标准控制为参照)
Fig.10 Main effects and interaction effects of dual metabolic trajectories on mortality risk (with standard control as the reference). The multivariate Cox regression model adjusted for age, duration of hypertension, stroke history, diastolic blood pressure, laboratory parameters (platelets, neutrophils, hemoglobin, INR, albumin, total protein, direct/indirect bilirubin, HDL-C, potassium, sodium, calcium, BUN, serum creatinine, 24-hour UTP, glucose, eGFR), and medications (PPIs, β-blockers, CCBs, diuretics, biguanides, CPM, RAS inhibitors, DPP-4 inhibitors, SGLT-2 inhibitors, insulin).
| [1] | Sun H, Saeedi P, Karuranga S, et al. IDF Diabetes Atlas: Global, regional and country-level diabetes prevalence estimates for 2021 and projections for 2045[J]. Diabetes Res Clin Pract, 2022, 183: 109119. doi:10.1016/j.diabres.2023.110945 |
| [2] | Kovesdy CP. Epidemiology of chronic kidney disease: an update 2022[J]. Kidney Int Suppl, 2022, 12(1): 7-11. doi:10.1016/j.kisu.2021.11.003 |
| [3] | Xie DD, Ma TP, Cui HL, et al. Global burden and influencing factors of chronic kidney disease due to type 2 diabetes in adults aged 20-59 years, 1990–2019[J]. Sci Rep, 2023, 13: 20234. doi:10.1038/s41598-023-47091-y |
| [4] | International Diabetes Federation. Diabetes facets and figures[EB/OL]. [2024-10-30]. . doi:10.1016/s1499-2671(08)24263-2 |
| [5] | Jia WP, Yu R, Wang LM, et al. Prevalence of chronic kidney disease among Chinese adults with diabetes: a nationwide population-based cross-sectional study[J]. Lancet Reg Health West Pac, 2025, 55: 101463. |
| [6] | Hauwanga WN, Abdalhamed TY, Ezike LA, et al. The pathophysiology and vascular complications of diabetes in chronic kidney disease: a comprehensive review[J]. Cureus, 2024, 16(12): e76498. doi:10.7759/cureus.76498 |
| [7] | Amorim RG, da Silva Guedes G, de Lima Vasconcelos SM, et al. Kidney disease in diabetes mellitus: cross-linking between hyperglycemia, Redox Imbalance and inflammation[J]. Arq Bras Cardiol, 2019, 112(5): 577-87. |
| [8] | Gavina C, Carvalho DS, Dias DM, et al. Premature mortality in type 2 diabetes mellitus associated with heart failure and chronic kidney disease: 20 years of real-world data[J]. J Clin Med, 2022, 11(8): 2131. doi:10.3390/jcm11082131 |
| [9] | Branch M, German C, Bertoni A, et al. Incremental risk of cardiovascular disease and/or chronic kidney disease for future ASCVD and mortality in patients with type 2 diabetes mellitus: ACCORD trial[J]. J Diabetes Complicat, 2019, 33(7): 468-72. doi:10.1016/j.jdiacomp.2019.04.004 |
| [10] | Garrick R. The effects of lowering LDL cholesterol with simvastatin plus ezetimibe in patients with chronic kidney disease (Study of Heart and Renal Protection): a randomised placebo-controlled trial[J]. Yearb Med, 2011, 2011: 190-3. doi:10.1016/j.ymed.2011.08.055 |
| [11] | Disease Kidney : Improving Global Outcomes (KDIGO) Lipid Work Group. KDIGO clinical practice guideline for lipid management in chronic kidney disease[J]. Kidney Int Suppl, 2013, 3(3): 259-305. |
| [12] | Cholesterol Treatment Trialists' (CTT) Collaboration, Herrington WG, Emberson J, et al. Impact of renal function on the effects of LDL cholesterol lowering with statin-based regimens: a meta-analysis of individual participant data from 28 randomised trials[J]. Lancet Diabetes Endocrinol, 2016, 4(10): 829-39. doi:10.1016/s2213-8587(16)30156-5 |
| [13] | UK Prospective Diabetes Study (UKPDS) Group. Intensive blood-glucose control with sulphonylureas or insulin compared with conventional treatment and risk of complications in patients with type 2 diabetes (UKPDS 33)[J]. Lancet, 1998, 352(9131): 837-53. doi:10.1016/s0140-6736(98)07019-6 |
| [14] | Papademetriou V, Lovato L, Doumas M, et al. Chronic kidney disease and intensive glycemic control increase cardiovascular risk in patients with type 2 diabetes[J]. Kidney Int, 2015, 87(3): 649-59. doi:10.1038/ki.2014.296 |
| [15] | ADVANCE Collaborative Group, Patel A, MacMahon S, et al. Intensive blood glucose control and vascular outcomes in patients with type 2 diabetes[J]. N Engl J Med, 2008, 358(24): 2560-72. doi:10.1056/nejmoa0802987 |
| [16] | Williams ME, Garg R. Glycemic management in ESRD and earlier stages of CKD[J]. Am J Kidney Dis, 2014, 63(2): S22-38. doi:10.1053/j.ajkd.2013.10.049 |
| [17] | Tang MY, Berg A, Rhee EP, et al. The impact of carbamylation and Anemia on HbA1c's association with renal outcomes in patients with diabetes and chronic kidney disease[J]. Diabetes Care, 2023, 46(1): 130-7. doi:10.2337/dci23-0011 |
| [18] | Nagin DS, Odgers CL. Group-based trajectory modeling in clinical research[J]. Annu Rev Clin Psychol, 2010, 6: 109-38. doi:10.1146/annurev.clinpsy.121208.131413 |
| [19] | Lavikainen P, Aarnio E, Linna M, et al. Data-driven long-term glycaemic control trajectories and their associated health and economic outcomes in Finnish patients with incident type 2 diabetes[J]. PLoS One, 2022, 17(6): e0269245. doi:10.1371/journal.pone.0269245 |
| [20] | Wang SW, Li LC, Fu CM, et al. Trajectory of low-density lipoprotein cholesterol in patients with chronic kidney disease and its association with cardiovascular disease[J]. Front Cardiovasc Med, 2022, 9: 887915. doi:10.3389/fcvm.2022.887915 |
| [21] | Chen SJ, Chiang HY, Chen PS, et al. Association of poorly controlled HbA1c with increased risk of progression to end-stage kidney disease and all-cause mortality in patients with diabetes and chronic kidney disease[J]. PLoS One, 2022, 17(9): e0274605. doi:10.1371/journal.pone.0274605 |
| [22] | Vekic J, Zeljkovic A, Cicero AFG, et al. Atherosclerosis development and progression: the role of atherogenic small, dense LDL[J]. Medicina, 2022, 58(2): 299. doi:10.3390/medicina58020299 |
| [23] | Sima AV, Botez GM, Stancu CS, et al. Effect of irreversibly glycated LDL in human vascular smooth muscle cells: lipid loading, oxidative and inflammatory stress[J]. J Cellular Molecular Medi, 2010, 14(12): 2790-802. doi:10.1111/j.1582-4934.2009.00933.x |
| [24] | DeFronzo RA. Insulin resistance, lipotoxicity, type 2 diabetes and atherosclerosis: the missing links. The Claude Bernard Lecture 2009[J]. Diabetologia, 2010, 53(7): 1270-87. doi:10.1007/s00125-010-1684-1 |
| [25] | Levey AS, Stevens LA, Schmid CH, et al. A new equation to estimate glomerular filtration rate[J]. Ann Intern Med, 2009, 150(9): 604-12. doi:10.7326/0003-4819-150-9-200905050-00006 |
| [26] | Duncan MS, Vasan RS, Xanthakis V. Trajectories of blood lipid concentrations over the adult life course and risk of cardiovascular disease and all-cause mortality: observations from the Framingham study over 35 years[J]. J Am Heart Assoc, 2019, 8(11): e011433. doi:10.1161/jaha.118.011433 |
| [27] | Rawshani A, Rawshani A, Franzén S, et al. Risk factors, mortality, and cardiovascular outcomes in patients with type 2 diabetes[J]. N Engl J Med, 2018, 379(7): 633-44. doi:10.1056/nejmoa1800256 |
| [28] | Cao X, Zhang LF, Wang X, et al. Cardiovascular disease and all-cause mortality associated with individual and combined cardiometabolic risk factors[J]. BMC Public Health, 2023, 23(1): 1725. doi:10.1186/s12889-023-16659-8 |
| [29] | Eckel RH, Grundy SM, Zimmet PZ. The metabolic syndrome[J]. Lancet, 2005, 365(9468): 1415-28. doi:10.1016/s0140-6736(05)66378-7 |
| [30] | Younis N, Sharma R, Soran H, et al. Glycation as an atherogenic modification of LDL[J]. Curr Opin Lipidol, 2008, 19(4): 378-84. doi:10.1097/mol.0b013e328306a057 |
| [31] | Liao JK, Laufs U. Pleiotropic effects of statins[J]. Annu Rev Pharmacol Toxicol, 2005, 45: 89-118. doi:10.1146/annurev.pharmtox.45.120403.095748 |
| [32] | Action to Control Cardiovascular Risk in Diabetes Study Group, Gerstein HC, Miller ME, et al. Effects of intensive glucose lowering in type 2 diabetes[J]. N Engl J Med, 2008, 358(24): 2545-59. doi:10.1056/nejmoa0802743 |
| [33] | Pei JY, Wang XP, Pei ZY, et al. Glycemic control, HbA1c variability, and major cardiovascular adverse outcomes in type 2 diabetes patients with elevated cardiovascular risk: insights from the ACCORD study[J]. Cardiovasc Diabetol, 2023, 22(1): 287. doi:10.1186/s12933-023-02026-9 |
| [34] | Neumiller JJ, Hirsch IB. Management of hyperglycemia in diabetic kidney disease[J]. Diabetes Spectr, 2015, 28(3): 214-9. doi:10.2337/diaspect.28.3.214 |
| [1] | 林灶强, 江梦瑶, 冯流畅, 方坤洋, 方萍君, 谭秦湘. 熟地黄通过多靶点机制治疗慢性肾脏病[J]. 南方医科大学学报, 2026, 46(7): 1611-1621. |
| [2] | 王梓渝, 伍静雯, 王涵冰, 徐艳, 姜春玲, 周莉. 红细胞分布宽度/红细胞压积与脓毒症患者28 d全因死亡率的关系[J]. 南方医科大学学报, 2026, 46(6): 1256-1266. |
| [3] | 邹晓松, 张幸, 李平, 田瑞雪, 路晓淼. 姜黄素通过抑制RANBP3L基因表达减轻2型糖尿病小鼠的骨质疏松症[J]. 南方医科大学学报, 2026, 46(2): 325-334. |
| [4] | 呼琴, 金华. 清肾颗粒通过调控miR-23b及Nrf2通路改善慢性肾脏病湿热证患者的肾功能:基于网络药理学和临床试验[J]. 南方医科大学学报, 2025, 45(9): 1867-1879. |
| [5] | 韩瑞敏, 赵曼可, 袁俊芳, 史振红, 王珍, 王德峰. 枯草杆菌二联活菌肠溶胶囊调节2型糖尿病合并昼夜节律紊乱小鼠糖脂代谢的作用机制[J]. 南方医科大学学报, 2025, 45(7): 1490-1497. |
| [6] | 马思雨, 陈美庆, 吴天宇, 赵文红. 膳食亚麻木酚素通过调控Bcl2/Bax/caspase3信号轴通道改善大鼠母体反式脂肪酸暴露所导致的子代肾损伤[J]. 南方医科大学学报, 2025, 45(12): 2658-2666. |
| [7] | 许怀文, 翁丽, 薛鸿. CXCL12可作为2型糖尿病合并慢性阻塞性肺疾病的潜在治疗靶点[J]. 南方医科大学学报, 2025, 45(1): 100-109. |
| [8] | 周凤敏, 郭艳菊, 陈 宁. 运动诱导的Irisin表达改善2型糖尿病大鼠的肾脏损伤[J]. 南方医科大学学报, 2024, 44(4): 675-681. |
| [9] | 方福生, 王 宁, 刘星宇, 王 薇, 孙 菁, 李 红, 孙般若, 谷昭艳, 傅晓敏, 闫双通. 基于C肽的胰岛素抵抗指数可准确评估健康体检者的胰岛素抵抗与血尿酸水平的相关性[J]. 南方医科大学学报, 2023, 43(9): 1509-1514. |
| [10] | 刘 泽, 何汶霞, 房睿哲, 肖 钢, 言 芳, 邱祁广, 方会龙, 王俊杰. 生命潮生物反馈技术干预2型糖尿病的先导观察[J]. 南方医科大学学报, 2023, 43(9): 1622-1628. |
| [11] | 周 蓓, 李 静, 方晨圆, 黄亚楠, 桑贵蕊, 陶少平, 何春玲. 二甲双胍/维格列汀和利拉鲁肽对肥胖合并2型糖尿病患者的临床疗效比较[J]. 南方医科大学学报, 2023, 43(3): 436-442. |
| [12] | 邓钰莹, 陈华锋, 李功辉, 陈立桁, 傅 强. 慢性肾脏病对肌钙蛋白诊断急性心肌梗死准确性的影响[J]. 南方医科大学学报, 2023, 43(2): 300-307. |
| [13] | 刘思妤, 刘 青, 彭群龙, 张远芳, 王俊杰. 二氢杨梅素通过抑制HMGB1改善糖尿病大鼠心功能不全[J]. 南方医科大学学报, 2022, 42(5): 641-648. |
| [14] | 苏 姗, 汤旭磊, 车红霞, 甄洁玉, 刘丽娟, 赵 楠, 刘进进, 关聪会, 傅松波, 王丽婷, 李红利, 张 迪, 王强梅, 甄东户. 基线25(OH)D水平与2型糖尿病发病风险无相关性:基于5044例人群的前瞻性队列研究[J]. 南方医科大学学报, 2021, 41(6): 811-819. |
| [15] | 唐淬蓉, 胡承光, 周宇辰, 宋杨达, 李 孟, 廖敏君, 孙家润, 钟春秀, 周 琳, 林志昭, 周元平. 乙型肝炎肝硬化合并糖尿病时发生肝细胞癌的风险:一项随访5年的前瞻性队列研究[J]. 南方医科大学学报, 2021, 41(3): 313-318. |
| 阅读次数 | ||||||
|
全文 |
|
|||||
|
摘要 |
|
|||||
