南方医科大学学报 ›› 2025, Vol. 45 ›› Issue (9): 2034-2045.doi: 10.12122/j.issn.1673-4254.2025.09.23
• • 上一篇
张晶晶1( ), 冯松2(), 张达利1, 薛剑3, 周超1, 刘鹏程1, 付双楠1, 宫嫚1, 冯卉2(), 张宁1()
收稿日期:2024-12-15
出版日期:2025-09-20
发布日期:2025-09-28
通讯作者:
冯卉,张宁
E-mail:zt2230224@126.com;flying-1984@163.com;fenghui810@126.com;zhangning198191@sina.com
作者简介:张晶晶,主治医师,E-mail: zt2230224@126.com;基金资助:
Jingjing ZHANG1(), Song FENG2(), Dali ZHANG1, Jian XUE3, Chao ZHOU1, Pengcheng LIU1, Shuangnan FU1, Man GONG1, Hui FENG2(), Ning ZHANG1()
Received:2024-12-15
Online:2025-09-20
Published:2025-09-28
Contact:
Hui FENG, Ning ZHANG
E-mail:zt2230224@126.com;flying-1984@163.com;fenghui810@126.com;zhangning198191@sina.com
摘要:
目的 探讨乙型肝炎病毒(HBV)感染对代谢相关脂肪性肝病(MAFLD)患者口腔微生态及代谢物的影响,并分析其潜在机制。 方法 纳入2023年11月~2024年1月本院就诊的单纯MAFLD患者(48例)和合并慢性乙型肝炎患者[MAFLD+慢性乙型病毒性肝炎(CHB)组,47例],采集空腹舌苔样本,结合16S rDNA高通量测序与非靶向代谢组学技术,对比菌群结构及代谢物差异,通过相关性分析和功能注释探讨其与临床指标的关联及生物学通路。 结果 合并CHB组空腹血糖、总胆固醇(TC)、谷氨酰转移酶(GGT)及脂肪肝程度均低于单纯MAFLD组(P<0.05)。菌群分析显示,MAFLD+CHB组Patescibacteria(门水平)、Hydrogenophaga和Absconditabacteriales(属水平)丰度升高,Megasphaera丰度降低(P<0.05),且差异菌群与TC、GGT、低密度脂蛋白等指标相关(r=-0.68~0.75,P<0.05)。代谢组学显示,合并CHB组469种代谢物上调(如脂质类、氨基酸类),2306种下调(如有机含氧化合物、苯丙素类),KEGG富集分析显示亚油酸代谢、甘油磷脂代谢通路异常激活(P<0.01)。菌群-代谢物相关性分析显示,Patescibacteria与脂质代谢物正相关,Megasphaera与脂肪酸代谢物负相关(P<0.05),共同影响糖脂代谢及氧化应激通路。 结论 与单纯MAFLD患者相比,合并慢性HBV感染的MAFLD患者部分脂代谢指标及肝脏脂肪变程度较低,同时伴有口腔菌群结构及代谢谱的改变,具体机制尚待进一步研究。
张晶晶, 冯松, 张达利, 薛剑, 周超, 刘鹏程, 付双楠, 宫嫚, 冯卉, 张宁. 乙型肝炎病毒-代谢相关脂肪性肝病共病患者脂质代谢紊乱与口腔微生物组及代谢产物变化相关[J]. 南方医科大学学报, 2025, 45(9): 2034-2045.
Jingjing ZHANG, Song FENG, Dali ZHANG, Jian XUE, Chao ZHOU, Pengcheng LIU, Shuangnan FU, Man GONG, Hui FENG, Ning ZHANG. Altered oral microbiome and metabolites are associated with improved lipid metabolism in HBV-infected patients with metabolic dysfunction-associated fatty liver disease[J]. Journal of Southern Medical University, 2025, 45(9): 2034-2045.
| Indicator | MAFLD (n=48) | MAFLD+CHB (n=47) | Total (n=95) | P |
|---|---|---|---|---|
| Degree of steotosis | ||||
| Mild | 15 (31.3%) | 31 (66.0%) | 46 (48.4%) | 0.0179 |
| Medium | 26 (54.2%) | 14 (29.8%) | 40 (42.1%) | |
| Severe | 7 (14.6%) | 2 (4.3%) | 9 (9.5%) | |
| Age (years, Mean±SD) | 46.8±11.2 | 46.6±8.03 | 46.7±9.70 | 0.976 |
| Gender (Male) | 33 (68.8%) | 35 (74.5%) | 68 (71.6%) | 0.826 |
| BMI (Mean±SD) | 26.7±5.02 | 27.5±2.98 | 27.1±4.14 | 0.326 |
| Waist (cm) | 93.4±10.3 | 97.2±9.98 | 95.3±10.3 | 0.305 |
| Hypertension | 12 (25.0%) | 9 (19.1%) | 21 (22.1%) | 0.79 |
| T2DM | 10 (20.8%) | 3 (6.4%) | 13 (13.7%) | 0.123 |
| CHD | 3 (6.3%) | 2 (4.3%) | 5 (5.3%) | 0.910 |
| ALT (U/L) | 51.6±39.8 | 38.7±22.0 | 45.2±32.7 | 0.586 |
| AST (U/L) | 40.7±38.2 | 30.3±12.7 | 35.6±28.9 | 0.221 |
| ALP (U/L) | 90.2±26.0 | 78.7±20.8 | 84.5±24.2 | 0.0975 |
| GGT (U/L) | 64.8±52.9 | 35.2±16.9 | 50.1±42.0 | 0.00116 |
| Glucose (mmol/L) | 6.77±1.91 | 5.79±1.45 | 6.28±1.76 | <0.001 |
| TG (mmol/L) | 2.80±2.84 | 1.89±0.835 | 2.35±2.14 | 0.215 |
| TC (mmol/L) | 5.07±0.989 | 4.62±0.703 | 4.85±0.885 | 0.046 |
| HDL (mmol/L) | 1.18±0.246 | 1.12±0.235 | 1.15±0.242 | 0.541 |
| LDL (mmol/L) | 3.40±0.772 | 3.24±0.603 | 3.32±0.695 | 0.568 |
| Apo-A1 (g/L) | 1.23±0.206 | 1.18±0.191 | 1.21±0.199 | 0.419 |
| Apo-B (g/L) | 0.935±0.237 | 0.867±0.149 | 0.901±0.201 | 0.274 |
| Lp-a (mg/L) | 113±177 | 149±222 | 131±200 | 0.458 |
| APRI | 0.579±1.06 | 0.411±0.297 | 0.496±0.783 | 0.609 |
| FIB-4 | 1.37±1.47 | 1.37±0.972 | 1.37±1.24 | 0.862 |
表1 患者基线指标及人口学特征
Tab.1 Baseline demographic and clinical characteristics of the enrolled patients
| Indicator | MAFLD (n=48) | MAFLD+CHB (n=47) | Total (n=95) | P |
|---|---|---|---|---|
| Degree of steotosis | ||||
| Mild | 15 (31.3%) | 31 (66.0%) | 46 (48.4%) | 0.0179 |
| Medium | 26 (54.2%) | 14 (29.8%) | 40 (42.1%) | |
| Severe | 7 (14.6%) | 2 (4.3%) | 9 (9.5%) | |
| Age (years, Mean±SD) | 46.8±11.2 | 46.6±8.03 | 46.7±9.70 | 0.976 |
| Gender (Male) | 33 (68.8%) | 35 (74.5%) | 68 (71.6%) | 0.826 |
| BMI (Mean±SD) | 26.7±5.02 | 27.5±2.98 | 27.1±4.14 | 0.326 |
| Waist (cm) | 93.4±10.3 | 97.2±9.98 | 95.3±10.3 | 0.305 |
| Hypertension | 12 (25.0%) | 9 (19.1%) | 21 (22.1%) | 0.79 |
| T2DM | 10 (20.8%) | 3 (6.4%) | 13 (13.7%) | 0.123 |
| CHD | 3 (6.3%) | 2 (4.3%) | 5 (5.3%) | 0.910 |
| ALT (U/L) | 51.6±39.8 | 38.7±22.0 | 45.2±32.7 | 0.586 |
| AST (U/L) | 40.7±38.2 | 30.3±12.7 | 35.6±28.9 | 0.221 |
| ALP (U/L) | 90.2±26.0 | 78.7±20.8 | 84.5±24.2 | 0.0975 |
| GGT (U/L) | 64.8±52.9 | 35.2±16.9 | 50.1±42.0 | 0.00116 |
| Glucose (mmol/L) | 6.77±1.91 | 5.79±1.45 | 6.28±1.76 | <0.001 |
| TG (mmol/L) | 2.80±2.84 | 1.89±0.835 | 2.35±2.14 | 0.215 |
| TC (mmol/L) | 5.07±0.989 | 4.62±0.703 | 4.85±0.885 | 0.046 |
| HDL (mmol/L) | 1.18±0.246 | 1.12±0.235 | 1.15±0.242 | 0.541 |
| LDL (mmol/L) | 3.40±0.772 | 3.24±0.603 | 3.32±0.695 | 0.568 |
| Apo-A1 (g/L) | 1.23±0.206 | 1.18±0.191 | 1.21±0.199 | 0.419 |
| Apo-B (g/L) | 0.935±0.237 | 0.867±0.149 | 0.901±0.201 | 0.274 |
| Lp-a (mg/L) | 113±177 | 149±222 | 131±200 | 0.458 |
| APRI | 0.579±1.06 | 0.411±0.297 | 0.496±0.783 | 0.609 |
| FIB-4 | 1.37±1.47 | 1.37±0.972 | 1.37±1.24 | 0.862 |
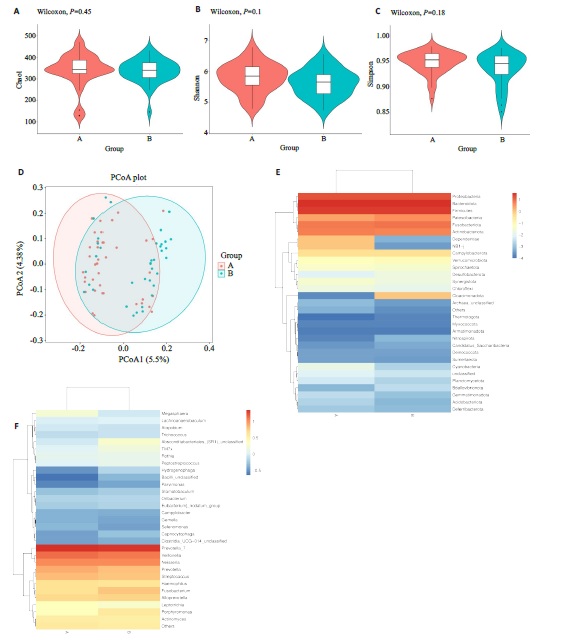
图1 两组患者舌苔差异菌群分析
Fig.1 Differences in microbial flora between the two groups. A-C: Alpha diversity analysis usingthe Chao1, Shannon, and Simpson methods. D:Beta diversity analysis using the Principal Coordinates Analysis (PCoA) method. E, F:Heatmaps annotating species abundance at the phylum level, with a gradient from blue to red indicating a change in abundance from low to high, where bluer colors represent lower abundance and redder colors represent higher abundance.
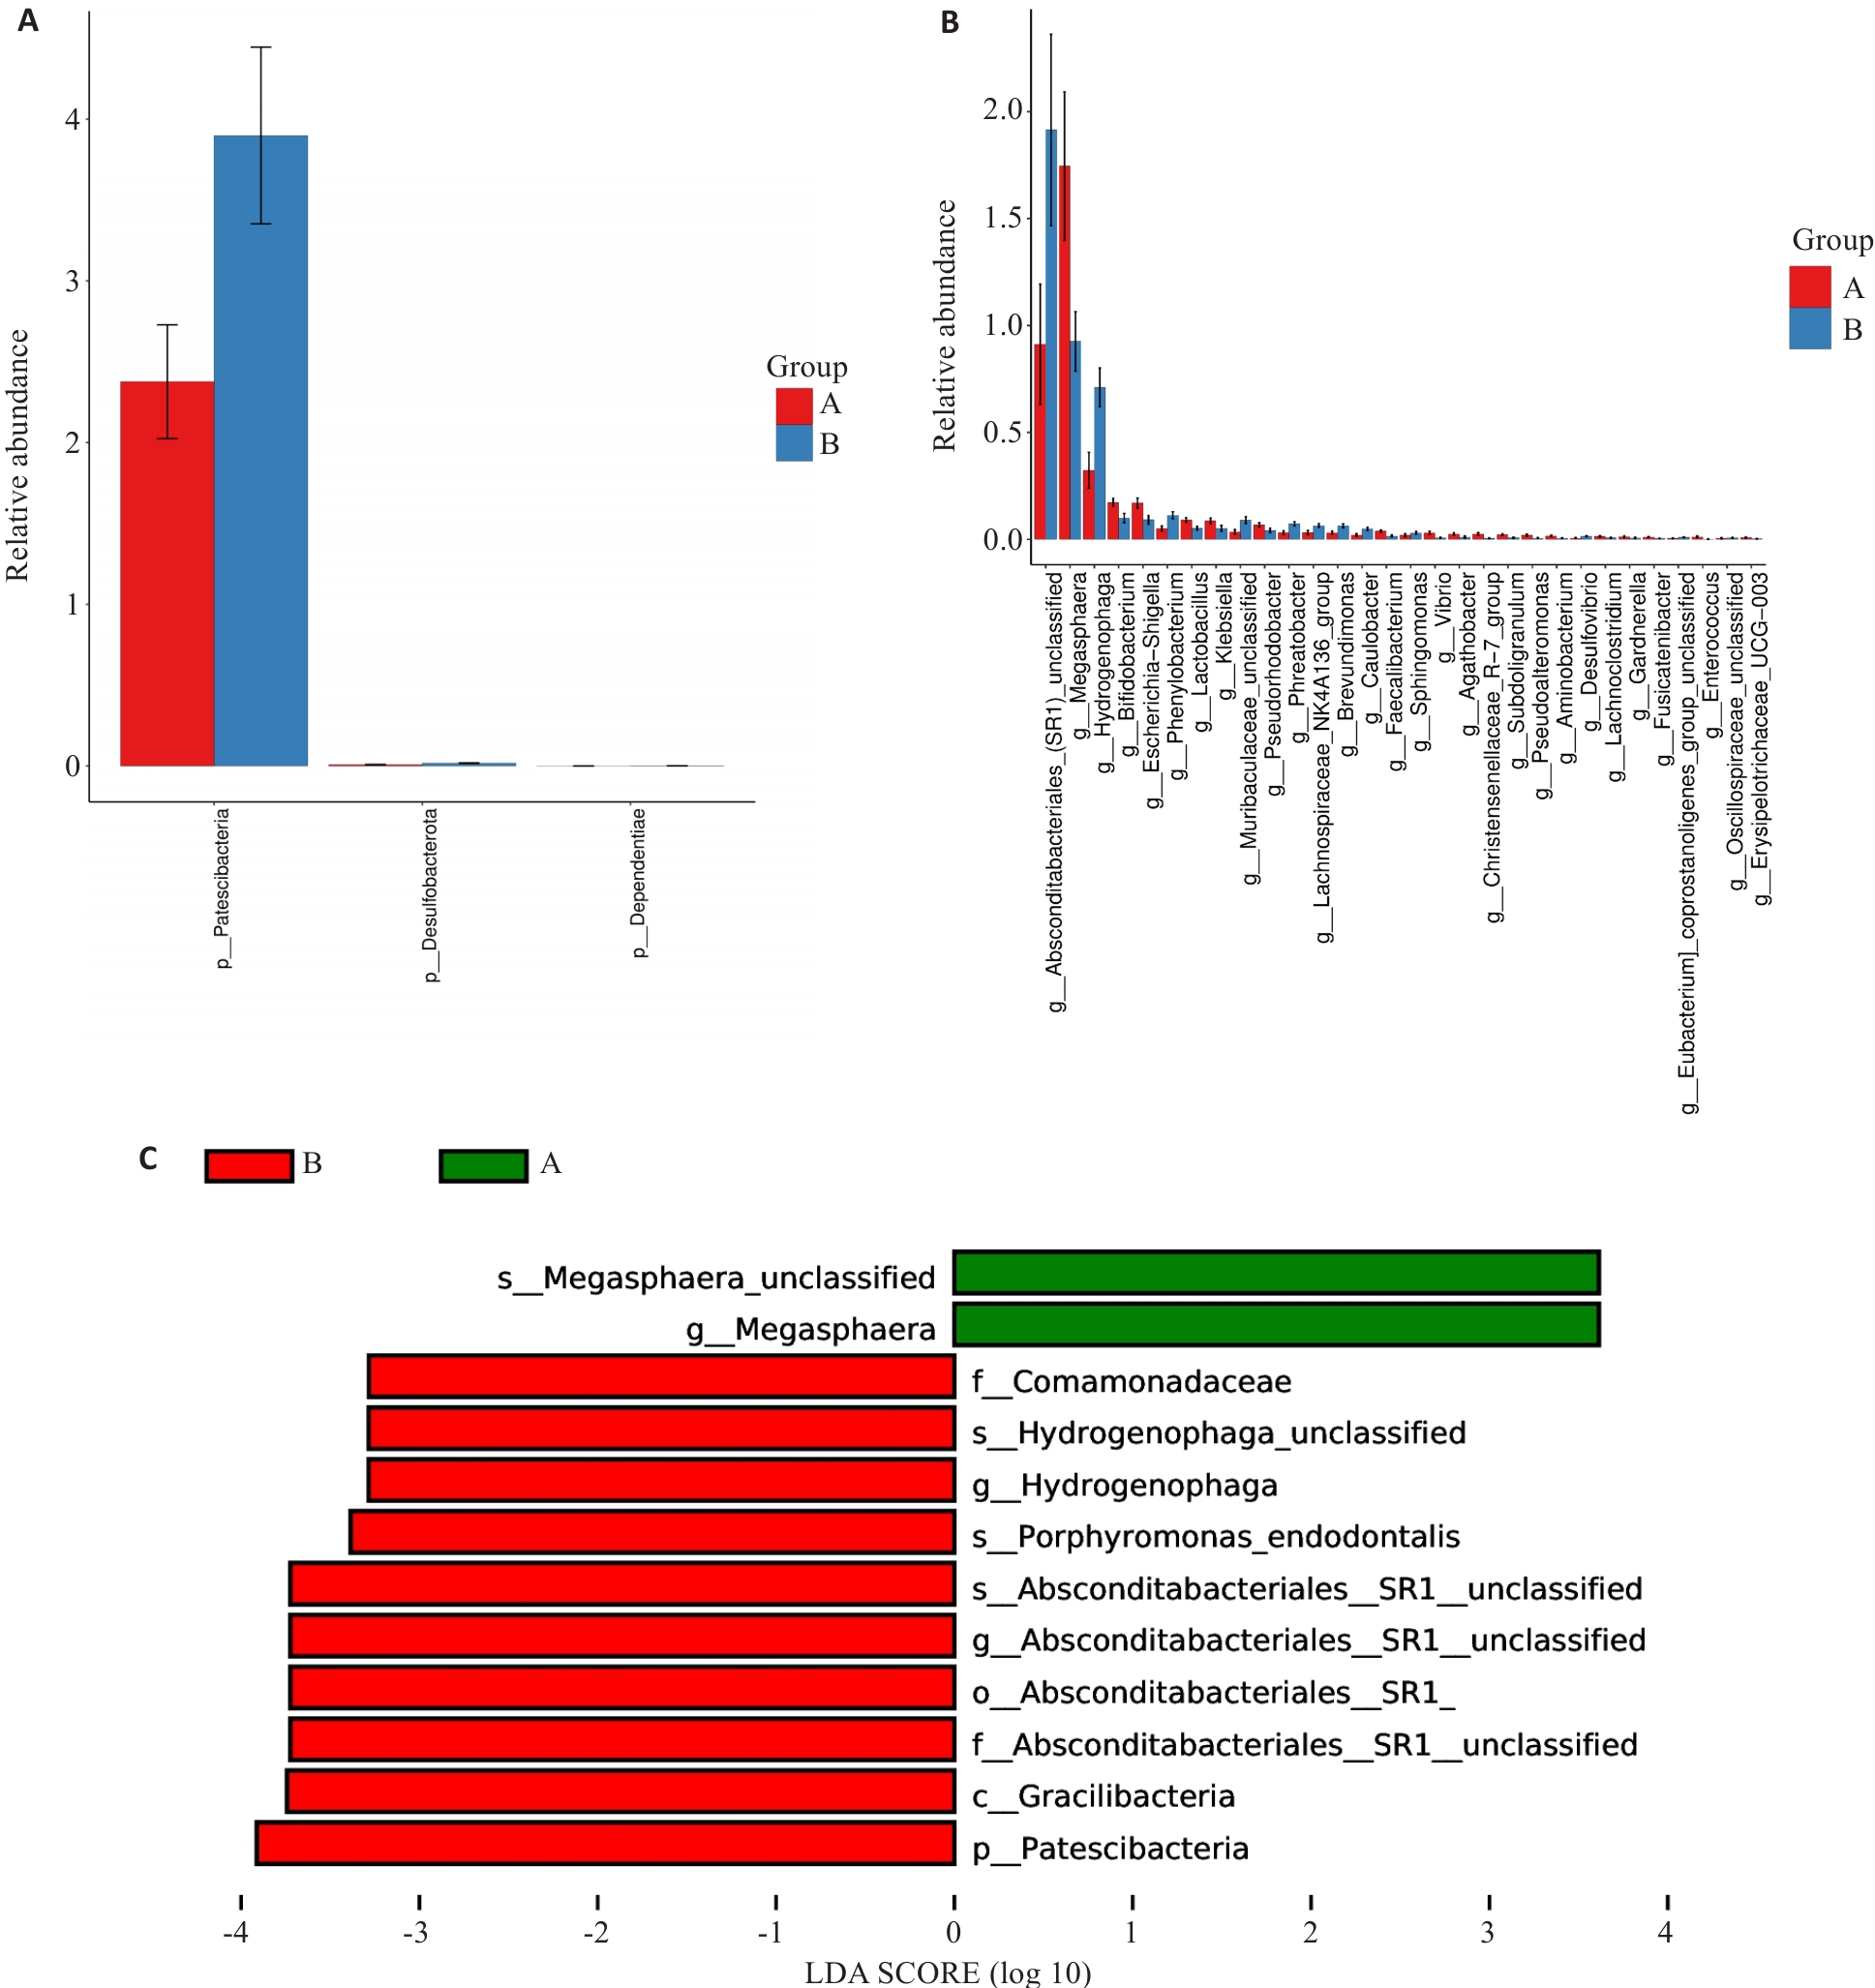
图2 差异性分析
Fig.2 Analysis of variances. A: Differences at the phylum level. B: Differences at the genus level. C: LEfSe analysis at all levels. Group A: MAFLD; Group B: MAFLD+CHB.
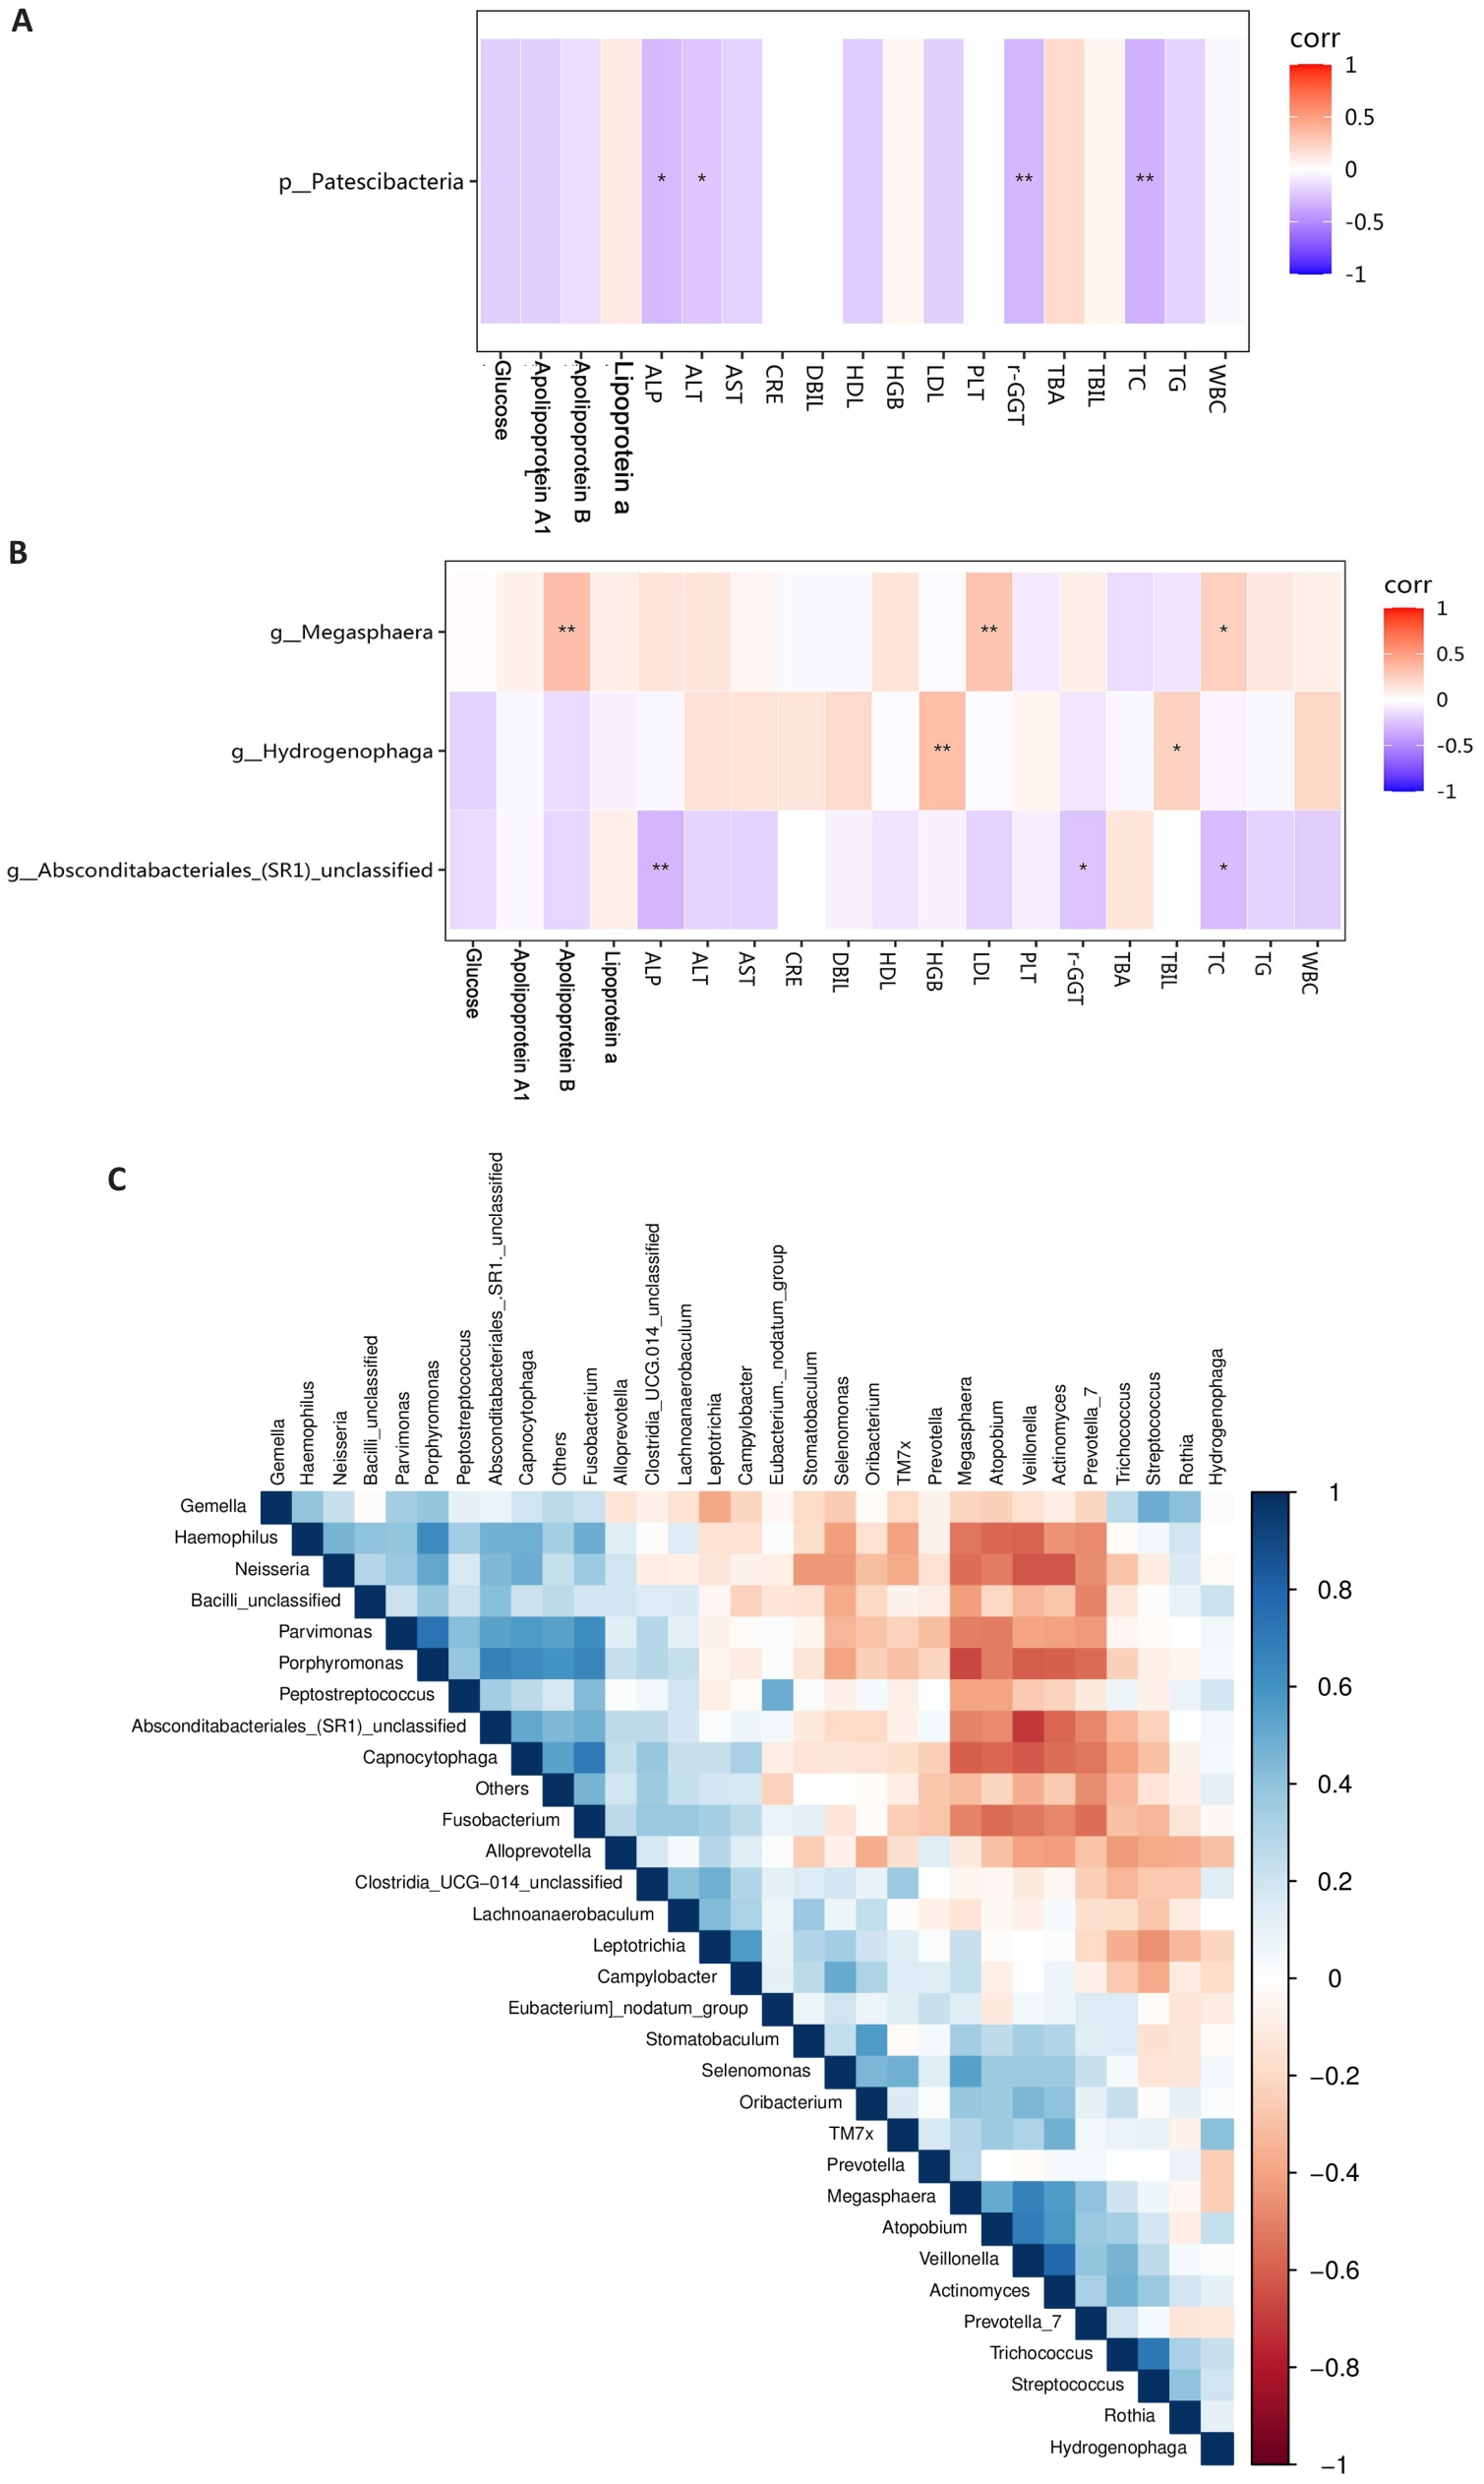
图3 差异菌群的相关性分析
Fig.3 Correlation analysis of different bacterial groups. A: Correlation analysis between phylum-level bacteria and blood indicators. B: Correlation analysis between genus-level bacteria and biochemical indicators. C: Correlation analysis among differentially abundant genus-level bacteria. Group A: MAFLD; Group B: MAFLD+CHB. *P<0.05, **P<0.01.
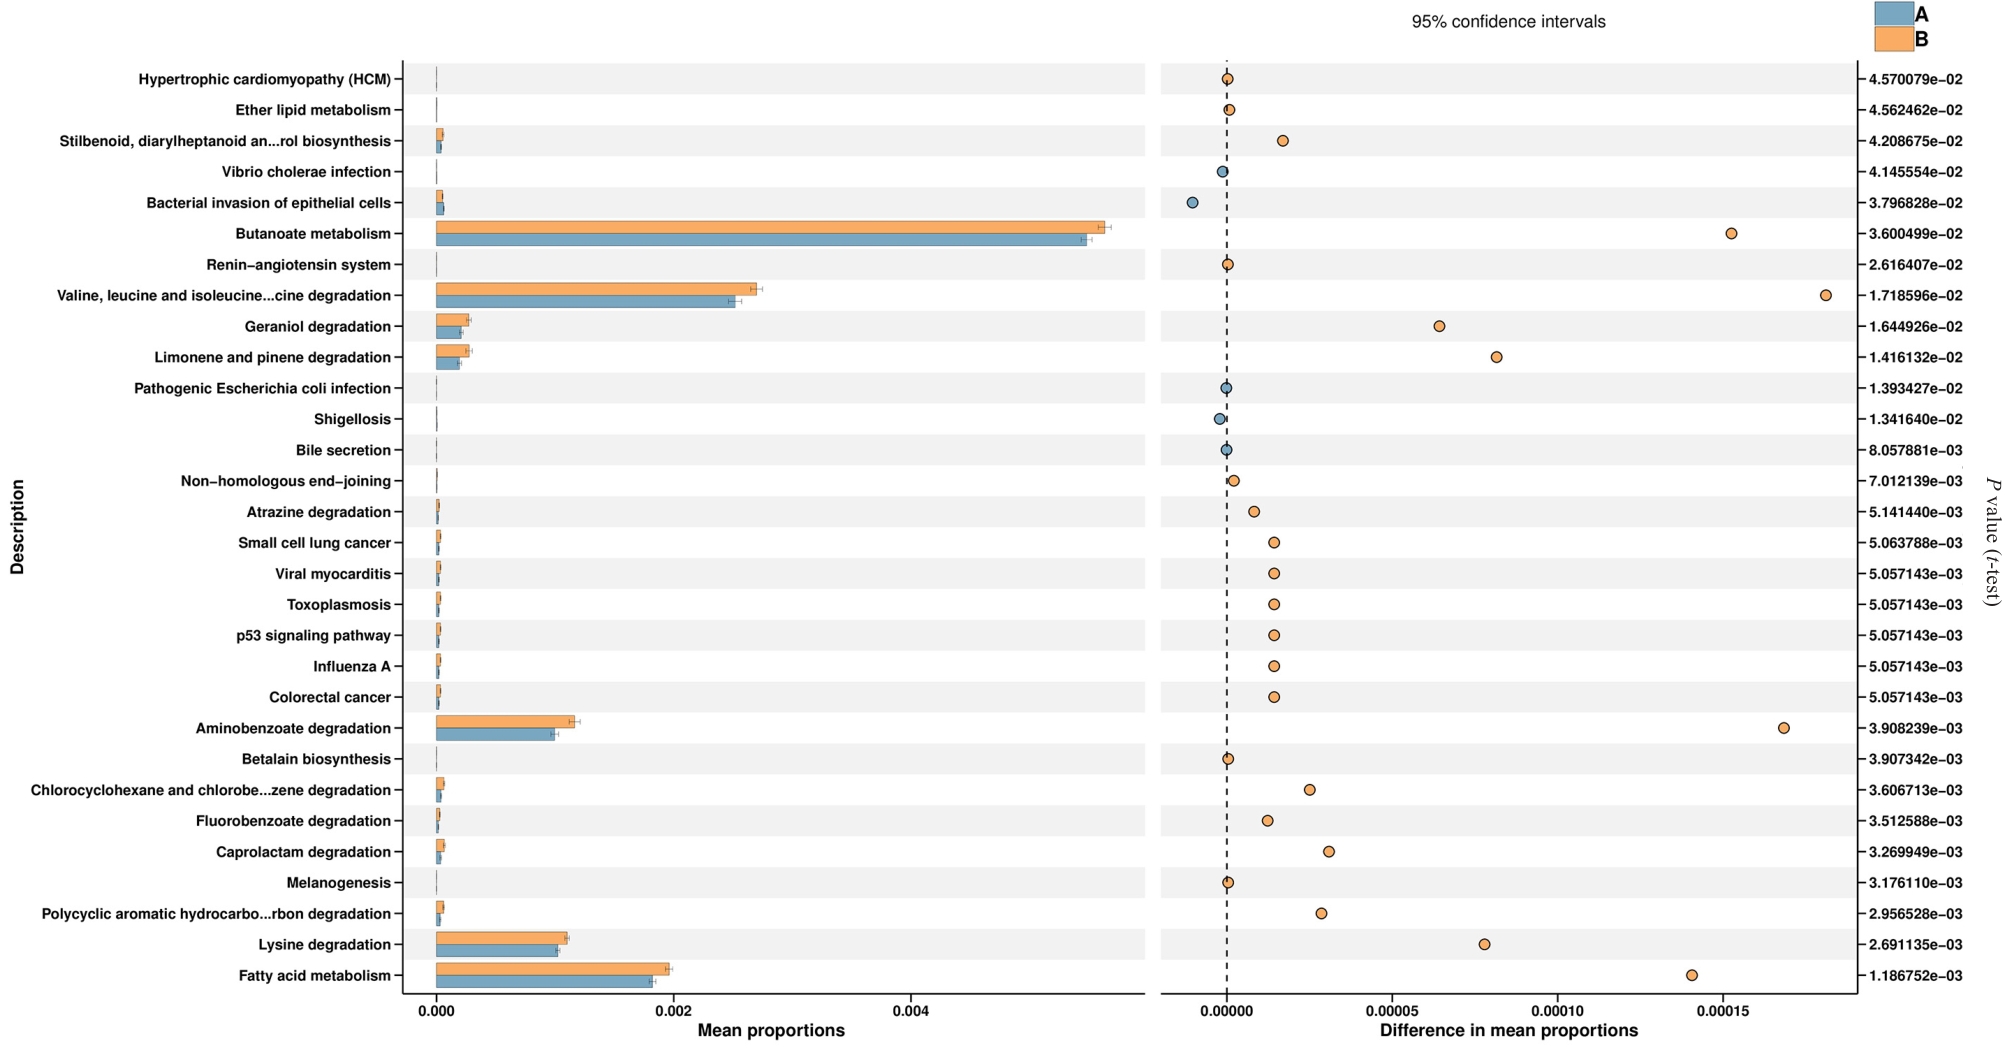
图4 两组差异菌的KO功能注释
Fig.4 KO functional annotation of differentially abundant bacteria between the two groups. Group A: MAFLD; Group B: MAFLD+CHB.
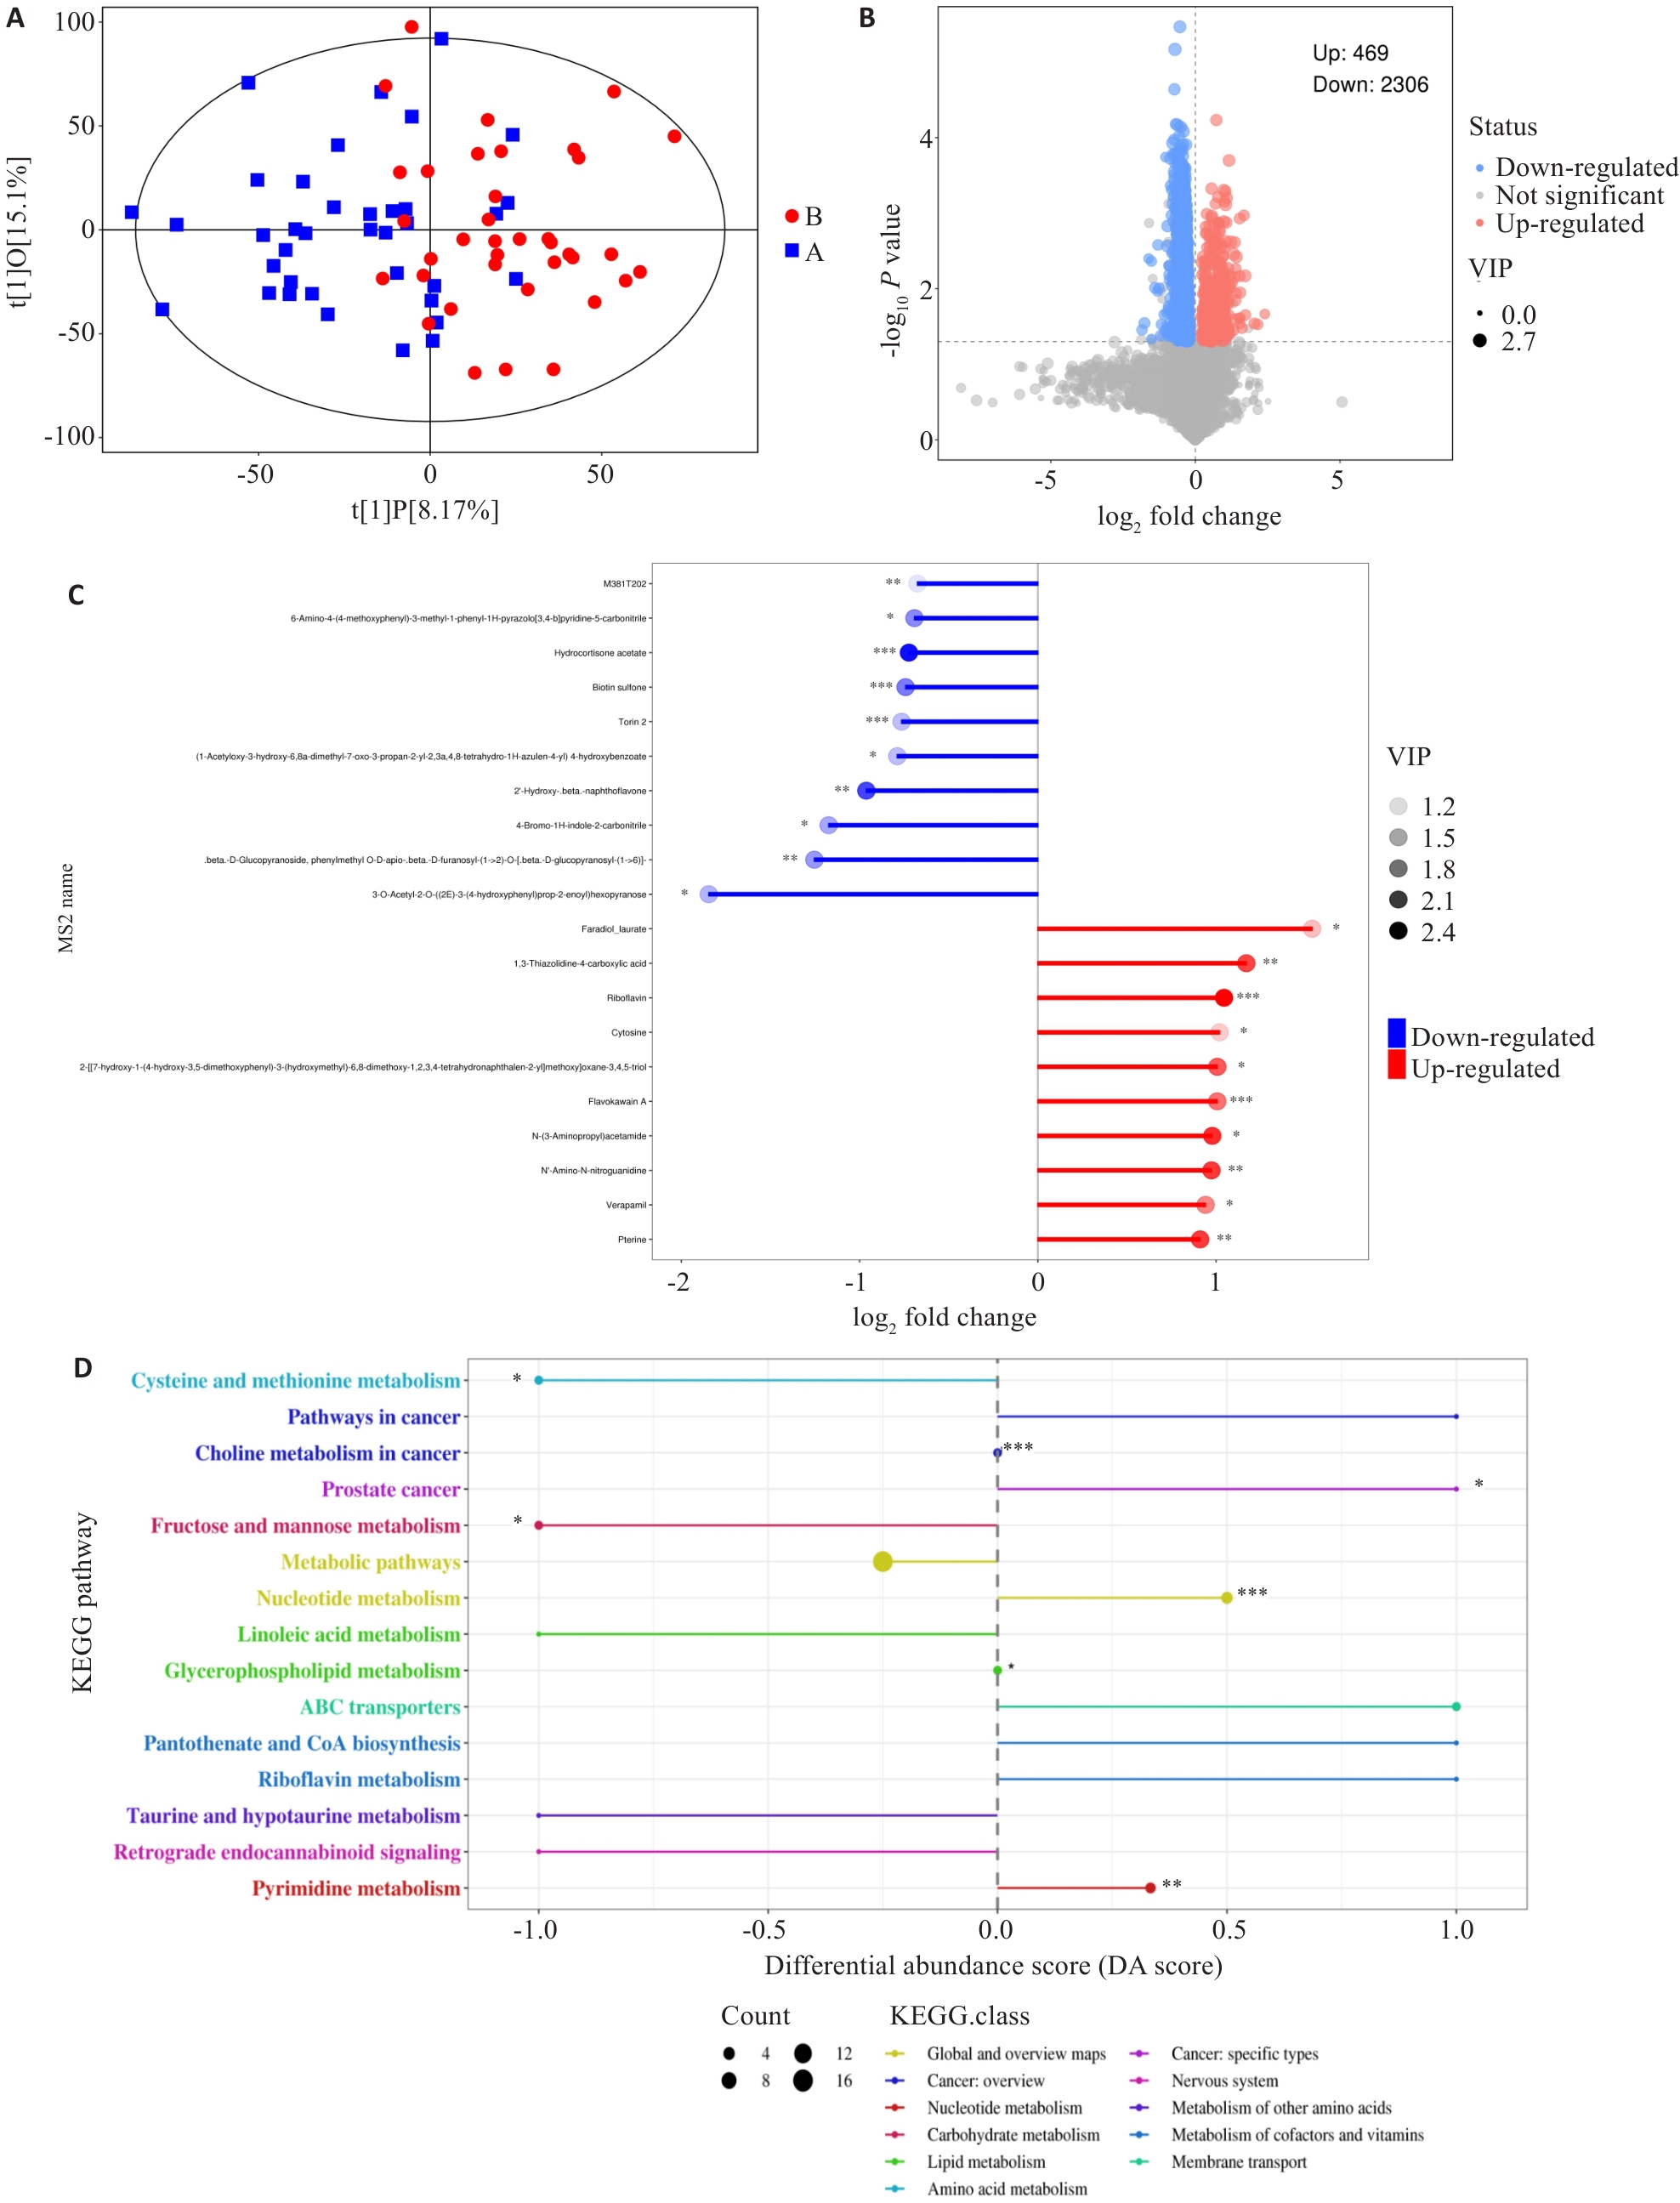
图5 两组差异代谢物分布情况及通路富集分析
Fig.5 Distribution and pathway enrichment analysis of differential metabolites between the two groups. A: Scatter plot showing the differences between the sample groups (OPLS-DA model). B: Volcano plot showing the overall distribution of metabolite differences between the two groups. C: The top 10 metabolites with the highest upregulation and downregulation fold after logarithmic transformation among the differential metabolites. D: Differential abundance scores of KEGG enrichment for differential metabolites between the two groups. DA Score of 1 indicates an upregulation trend in the expression of all annotated differential metabolites within that pathway, while -1 indicates a downregulation trend. The larger the dot, the greater the number of differential metabolites in that pathway. *P<0.05, *P<0.01, ***P<0.001.
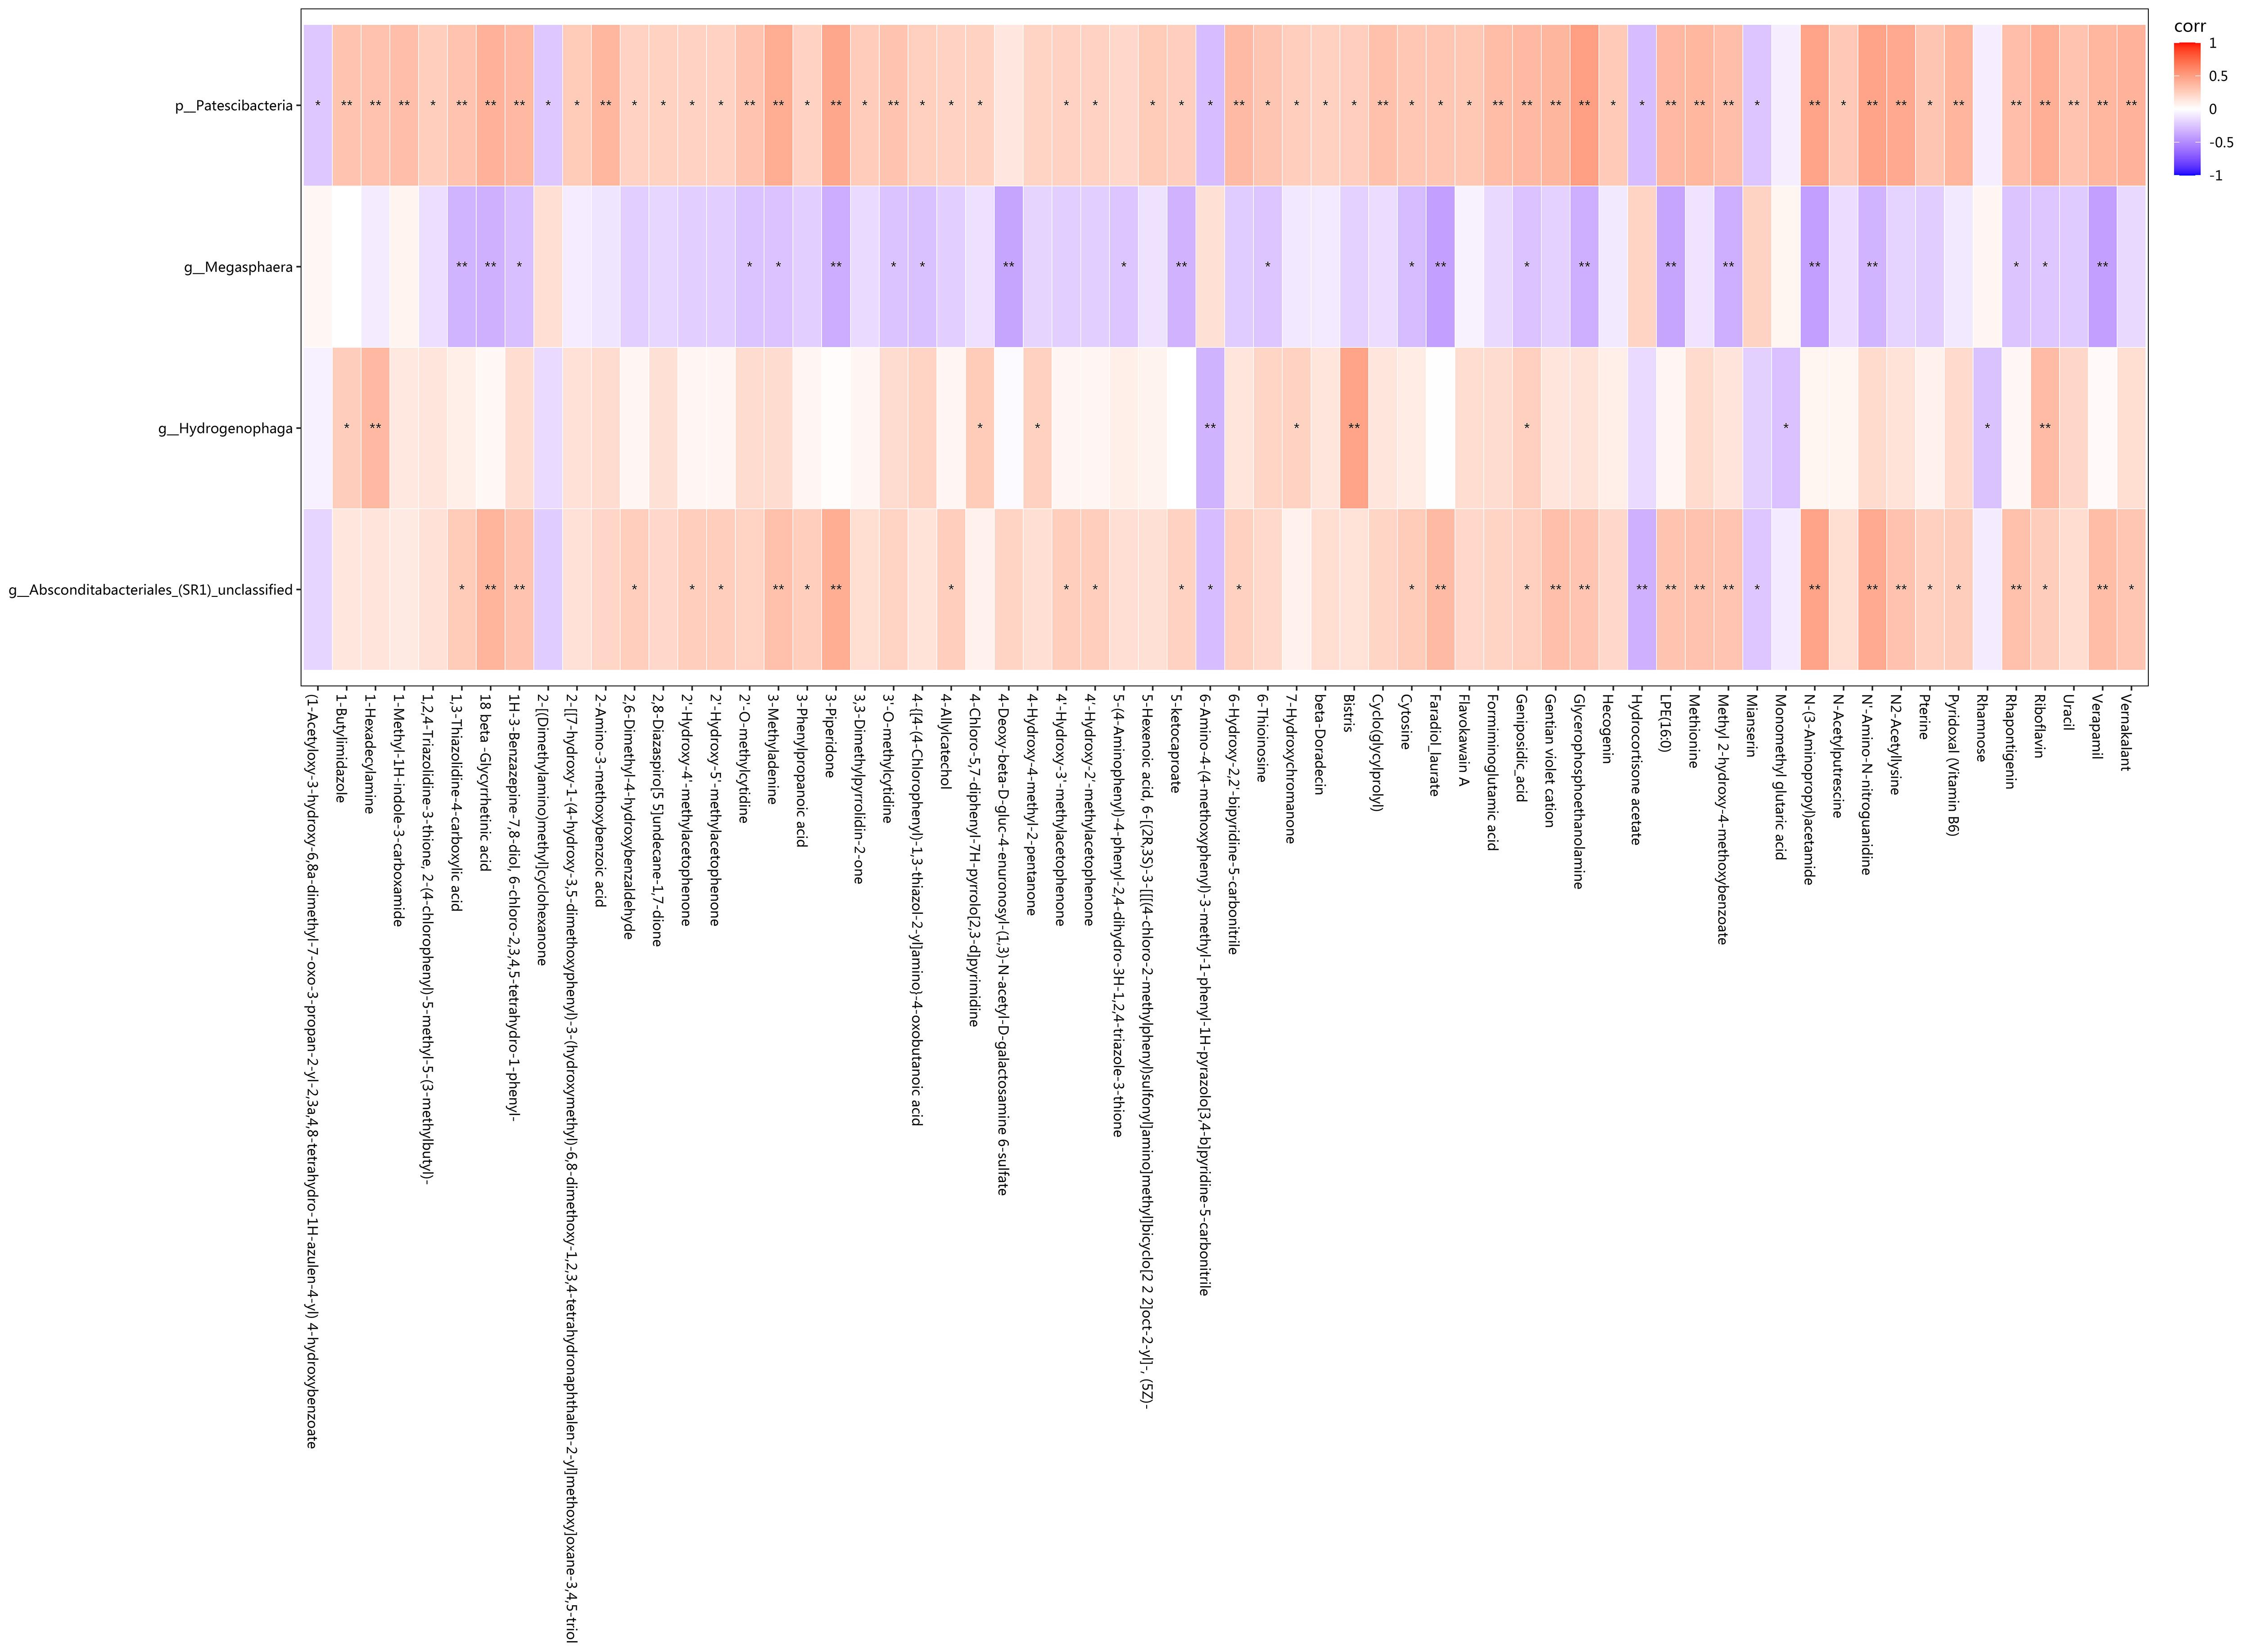
图6 差异菌和差异代谢物中相关性存在统计学差异的相关分析
Fig.6 Correlation analysis showing statistical differences in the correlation between the differential bacteria and metabolites. Red represents positive correlation, blue represents negative correlation, and darker colors indicate stronger correlation. *P<0.05, **P<0.01.
| [1] | Younossi ZM, Wong G, Anstee QM, et al. The global burden of liver disease[J]. Clin Gastroenterol Hepatol, 2023, 21(8): 1978-91. doi:10.1016/j.cgh.2023.04.015 |
| [2] | European Association for the Study of the Liver (EASL), European Association for the Study of Diabetes (EASD), European Association for the Study of Obesity (EASO). EASL-EASD-EASO Clinical Practice Guidelines on the management of metabolic dysfunction-associated steatotic liver disease (MASLD)[J]. J Hepatol, 2024, 81(3): 492-542. doi:10.1159/000539371 |
| [3] | Thomas JA, Kendall BJ, El-Serag HB, et al. Hepatocellular and extrahepatic cancer risk in people with non-alcoholic fatty liver disease[J]. Lancet Gastroenterol Hepatol, 2024, 9(2): 159-69. doi:10.1016/s2468-1253(23)00275-3 |
| [4] | De A, Bhagat N, Mehta M, et al. Metabolic dysfunction-associated steatotic liver disease (MASLD) definition is better than MAFLD criteria for lean patients with NAFLD[J]. J Hepatol, 2024, 80(2): e61-2. doi:10.1016/j.jhep.2023.07.031 |
| [5] | Yang A, Zhu X, Zhang L, et al. Transitioning from NAFLD to MAFLD and MASLD: consistent prevalence and risk factors in a Chinese cohort[J]. J Hepatol, 2024, 80(4): e154-5. doi:10.1016/j.jhep.2023.09.033 |
| [6] | Danpanichkul P, Duangsonk K, Chen VL, et al. Global burden of HBV-related liver disease: primary liver cancer due to chronic HBV infection increased in over one-third of countries globally from 2000 to 2021[J]. Hepatology, 2025, 29: 130945-58. doi:10.1097/hep.0000000000001260 |
| [7] | Wong RJ, Gish RG, Cheung R, et al. Low prevalence of vaccination or documented immunity to hepatitis a and hepatitis B viruses among individuals with chronic liver disease[J]. Am J Med, 2021, 134(7): 882-92. doi:10.1016/j.amjmed.2021.02.008 |
| [8] | Tourkochristou E, Assimakopoulos SF, Thomopoulos K, et al. NAFLD and HBV interplay-related mechanisms underlying liver disease progression[J]. Front Immunol, 2022, 13: 965548. doi:10.3389/fimmu.2022.965548 |
| [9] | Huang SC, Su TH, Tseng TC, et al. Metabolic dysfunction-associated steatotic liver disease facilitates hepatitis B surface antigen seroclearance and seroconversion[J]. Clin Gastroenterol Hepatol, 2024, 22(3): 581-90. e6. doi:10.1016/j.cgh.2023.09.040 |
| [10] | Kim MN, Han K, Yoo J, et al. Increased risk of hepatocellular carcinoma and mortality in chronic viral hepatitis with concurrent fatty liver[J]. Aliment Pharmacol Ther, 2022, 55(1): 97-107. doi:10.1111/apt.16706 |
| [11] | Vassilopoulos S, Kalligeros M, Vassilopoulos A, et al. Impact of prior HBV, HAV, and HEV infection on non-alcoholic fatty liver disease[J]. J Viral Hepat, 2023, 30(8): 685-93. doi:10.1111/jvh.13862 |
| [12] | Joo EJ, Cheong HS, Kwon MJ, et al. Relationship between gut microbiome diversity and hepatitis B viral load in patients with chronic hepatitis B[J]. Gut Pathog, 2021, 13(1): 65. doi:10.1186/s13099-021-00461-1 |
| [13] | Tilg H, Adolph TE, Trauner M. Gut-liver axis: Pathophysiological concepts and clinical implications[J]. Cell Metab, 2022, 34(11): 1700-18. doi:10.1016/j.cmet.2022.09.017 |
| [14] | Lang S, Schnabl B. Microbiota and fatty liver disease-the known, the unknown, and the future[J]. Cell Host Microbe, 2020, 28(2): 233-44. doi:10.1016/j.chom.2020.07.007 |
| [15] | Han W, Huang C, Ji Y, et al. Alterations in the gut microbiota and hepatitis-B-virus infection in southern Chinese patients with coexisting non-alcoholic fatty liver disease and type-2 diabetes mellitus[J]. Front Med: Lausanne, 2021, 8: 805029. doi:10.3389/fmed.2021.805029 |
| [16] | Lei Y, Li S, He M, et al. Oral pathogenic bacteria and the oral-gut-liver axis: a new understanding of chronic liver diseases[J]. Diagnostics: Basel, 2023, 13(21): 3324. doi:10.3390/diagnostics13213324 |
| [17] | Chen TP, Yu HC, Lin WY, et al. The role of microbiome in the pathogenesis of oral-gut-liver axis between periodontitis and nonalcoholic fatty liver disease[J]. J Dent Sci, 2023, 18(3): 972-5. doi:10.1016/j.jds.2023.03.012 |
| [18] | Eslam M, Newsome PN, Sarin SK, et al. A new definition for metabolic dysfunction-associated fatty liver disease: an international expert consensus statement[J]. J Hepatol, 2020, 73(1): 202-9. doi:10.1016/j.jhep.2020.07.045 |
| [19] | Eslam M, Fan JG, Yu ML, et al. The Asian Pacific association for the study of the liver clinical practice guidelines for the diagnosis and management of metabolic dysfunction-associated fatty liver disease[J]. Hepatol Int, 2025, 19(2): 261-301. |
| [20] | Liu G, Li T, Zhu X, et al. An independent evaluation in a CRC patient cohort of microbiome 16S rRNA sequence analysis methods: OTU clustering, DADA2, and Deblur[J]. Front Microbiol, 2023, 14: 1178744. doi:10.3389/fmicb.2023.1178744 |
| [21] | Cheng YM, Hsieh TH, Wang CC, et al. Impact of HBV infection on clinical outcomes in patients with metabolic dysfunction-associated fatty liver disease[J]. JHEP Rep, 2023, 5(9): 100836. doi:10.1016/j.jhepr.2023.100836 |
| [22] | Gu H, Tian Y, Xia J, et al. Li-Hong Tang alleviates dextran sodium sulfate-induced colitis by regulating NRF2/HO-1 signaling pathway and gut microbiota[J]. Front Pharmacol, 2024, 15: 1413666. doi:10.3389/fphar.2024.1413666 |
| [23] | Mukuda K, Inoue R, Takata M, et al. Temporal effects of lascufloxacin on human gut and salivary microbiota: Analysis using next-generation sequencing method[J]. J Infect Chemother, 2025, 31(1): 102483. doi:10.1016/j.jiac.2024.07.023 |
| [24] | Zhao YT, Liu S, Wang WZ, et al. Associations of indoor airborne microbiome with lung function: evidence from a randomized, double-blind, crossover study of microbial intervention[J]. Environ Sci: Processes Impacts, 2024, 26(11): 2020-35. doi:10.1039/d4em00392f |
| [25] | Yunusbayev B, Bogdanova A, Nadyrchenko N, et al. Gut dysbiosis narrative in psoriasis: matched-pair approach identifies only subtle shifts correlated with elevated fecal calprotectin[J]. Microbiol Spectr, 2025, 13(1): e0138224. doi:10.1128/spectrum.01382-24 |
| [26] | Du Y, Neng Q, Li Y, et al. Gastrointestinal autonomic neuropathy exacerbates gut microbiota dysbiosis in adult patients with type 2 diabetes mellitus[J]. Front Cell Infect Microbiol, 2021, 11: 804733. doi:10.3389/fcimb.2021.804733 |
| [27] | Badmus OO, Hillhouse SA, Anderson CD, et al. Molecular mechanisms of metabolic associated fatty liver disease (MAFLD): functional analysis of lipid metabolism pathways[J]. Clin Sci: Lond, 2022, 136(18): 1347-66. doi:10.1042/cs20220572 |
| [28] | Paulusma CC, Lamers WH, Broer S, et al. Amino acid metabolism, transport and signalling in the liver revisited[J]. Biochem Pharmacol, 2022, 201: 115074. doi:10.1016/j.bcp.2022.115074 |
| [29] | Li H, Xu QY, Xie Y, et al. Effects of chronic HBV infection on lipid metabolism in non-alcoholic fatty liver disease: a lipidomic analysis[J]. Ann Hepatol, 2021, 24: 100316. doi:10.1016/j.aohep.2021.100316 |
| [30] | Shen Y, Wu SD, Chen Y, et al. Alterations in gut microbiome and metabolomics in chronic hepatitis B infection-associated liver disease and their impact on peripheral immune response[J]. Gut Microbes, 2023, 15(1): 2155018. doi:10.1080/19490976.2022.2155018 |
| [31] | Li XX, Wu S, Du Y, et al. Entecavir therapy reverses gut microbiota dysbiosis induced by hepatitis B virus infection in a mouse model[J]. Int J Antimicrob Agents, 2020, 56(1): 106000. doi:10.1016/j.ijantimicag.2020.106000 |
| [32] | Albuquerque-Souza E, Sahingur SE. Periodontitis, chronic liver diseases, and the emerging oral-gut-liver axis[J]. Periodontol 2000, 2022, 89(1): 125-41. doi:10.1111/prd.12427 |
| [1] | 李国永, 黎仁玲, 刘艺婷, 柯宏霞, 李菁, 王新华. 牛蒡子治疗小鼠病毒性肺炎后肺纤维化的机制:基于代谢组学、网络药理学和实验验证方法[J]. 南方医科大学学报, 2025, 45(6): 1185-1199. |
| [2] | 周超, 张晶晶, 唐巧, 付双楠, 张宁, 何召云, 张瑾, 张田义, 刘鹏程, 宫嫚. 血清色氨酸用于乙肝相关慢加急性肝衰竭90 d死亡风险分层管理的潜在价值:一项多中心回顾性研究[J]. 南方医科大学学报, 2025, 45(1): 59-64. |
| [3] | 于官正, 程炜强, 涂星, 张满, 李鸿, 聂娟. 隔山消治疗溃疡性结肠炎的机制:基于UPLC-QE-MS、网络药理学及代谢组学技术[J]. 南方医科大学学报, 2024, 44(8): 1485-1496. |
| [4] | 刘鹏程, 娄丽娟, 刘霞, 王建, 姜颖. M2巨噬细胞特征基因风险评分能准确预测HBV相关肝细胞癌患者的预后[J]. 南方医科大学学报, 2024, 44(5): 827-840. |
| [5] | 胡司淦, 程增为, 李敏, 高世毅, 高大胜, 康品方. 冠状动脉慢性完全闭塞病变侧支循环的建立与胰岛素抵抗的相关性[J]. 南方医科大学学报, 2024, 44(4): 780-786. |
| [6] | 崔成玲, 许玉珍, 唐超群, 蒋佳颖, 胡英, 双杰. 高原低氧暴露导致小鼠脾脏组织脂代谢发生紊乱的分子机制[J]. 南方医科大学学报, 2024, 44(10): 2024-2032. |
| [7] | 徐龙飞, 韩 晶, 杨 喆, 杨燕平, 陈金慧, 吴西军, 王 琪, 洪 艳. LRG1抑制小鼠肝巨噬细胞活化从而改善代谢相关脂肪性肝病:基于增强TGF-β1信号通路[J]. 南方医科大学学报, 2023, 43(7): 1164-1171. |
| [8] | 王旋成, 朱一帆, 周海琳, 黄宗声, 陈鸿炜, 张嘉豪, 杨珊伊, 陈广辉, 张淇淞. 血清非靶向代谢组学联合靶向胆汁酸代谢组学筛查结直肠癌的潜在生物标志物[J]. 南方医科大学学报, 2023, 43(3): 443-453. |
| [9] | 高毅男, 王培君, 逯素梅, 马万山. 甲基转移酶样3抑制剂STM2457通过调节线粒体功能改善代谢相关脂肪性肝病[J]. 南方医科大学学报, 2023, 43(10): 1689-1696. |
| [10] | 刘文虎, 汤建才, 常晋霞. RUNX3调控胃癌细胞对曲妥珠单抗耐药的机制:基于超效高液相色谱-四极杆/静电场轨道阱质谱的代谢组学分析[J]. 南方医科大学学报, 2022, 42(4): 498-508. |
| [11] | 王佳媛, 袁依依, 张 坤, 孙 翔, 卜 歆, 董 健, 吴有盛, 田红英, 沈 岚. NDRG2通过调控肝癌细胞磷脂和甘油三酯代谢抑制肝细胞癌的生长:基于代谢组学分析[J]. 南方医科大学学报, 2022, 42(12): 1765-1773. |
| [12] | 李玉杰, 吴登强, 韦常宏, 杨雪佳, 周素芳. CDK1、CCNB1和NDC80与乙型肝炎相关肝细胞癌的预后和进展相关:基于生物信息学方法[J]. 南方医科大学学报, 2021, 41(10): 1509-1518. |
| [13] | 张磊,范志娟,康华,王宇凡,刘树业,单忠强. HPLC/MS分析乙肝相关性肝细胞癌的血清代谢轮廓分析[J]. 南方医科大学学报, 2019, 39(01): 49-. |
| [14] | 秦娇,强丽,陈文,吴刚. 红细胞分布宽度可作为乙型肝炎相关慢加急性肝衰竭患者短期死亡的独立预测因子[J]. 南方医科大学学报, 2018, 38(11): 1354-. |
| [15] | 王晶,李春林,白璐璐,唐强虎,张瑞源,Ting-Li Han,郭玉明,Philip N.Baker,夏茵茵,涂白杰. 苯并[a]芘暴露大鼠的皮层代谢组学研究[J]. 南方医科大学学报, 2018, 38(02): 162-. |
| 阅读次数 | ||||||
|
全文 |
|
|||||
|
摘要 |
|
|||||