南方医科大学学报 ›› 2026, Vol. 46 ›› Issue (4): 770-784.doi: 10.12122/j.issn.1673-4254.2026.04.06
陈浩1,2,3( ), 李振汉4,5, 纪梦佳6, 汪鑫诚7, 陈博峰6, 管谦1, 武嫚4, 卢林明1()
收稿日期:2025-10-23
出版日期:2026-04-20
发布日期:2026-04-24
通讯作者:
卢林明
E-mail:ha0chen@wnmc.edu.cn;llm7172@sina.com
作者简介:陈 浩,博士后,副教授,E-mail: ha0chen@wnmc.edu.cn
基金资助:
Hao CHEN1,2,3(), Zhenhan LI4,5, Mengjia JI6, Xincheng WANG7, Bofeng CHEN6, Qian GUAN1, Man WU4, Linming LU1()
Received:2025-10-23
Online:2026-04-20
Published:2026-04-24
Contact:
Linming LU
E-mail:ha0chen@wnmc.edu.cn;llm7172@sina.com
Supported by:摘要:
目的 分析非酒精性脂肪性肝病(NAFLD)的全球负担趋势、驱动因素及健康不平等,利用可解释机器学习识别关键死亡风险因素,并通过孟德尔随机化验证其潜在因果关联。 方法 基于全球疾病负担(GBD)2021数据,提取1990~2021年NAFLD的发病率、患病率、死亡率、残疾调整生命年(DALYs)等指标。运用Joinpoint回归分析趋势,分解分析法量化人口增长、老龄化和流行病学变化的贡献,集中指数评估健康不平等,XGBoost-SHAP机器学习识别死亡预测因子,并使用双样本孟德尔随机化对关键因子进行因果验证;分析按性别和社会人口指数(SDI)分层。 结果 全球NAFLD年龄标准化DALY率在男性(平均年度百分比变化[AAPC]=+0.34%)和女性(AAPC=+0.05%)中均呈上升趋势。分解分析显示,人口增长是全球DALYs增加的主要驱动力,而在高SDI地区,人口老龄化对男性死亡的贡献度达52.37%。健康不平等分析显示,2021年DALYs的集中指数为-0.05,负担向低SDI人群集中。机器学习识别吸烟(相对重要性=100%)和高龄(70~74岁:60%)为最关键死亡预测因素,模型测试集拟合优度良好(R²=0.98)。SDI分层分析显示吸烟和老龄化在不同SDI区域均位列前两位。孟德尔随机化进一步验证了吸烟起始(OR=1.35,P<0.05)与衰老(以衰弱指数代理,OR=2.01,P<0.05)与NAFLD风险间的正向因果关联。 结论 NAFLD负担沉重,存在性别与社会经济不平等。吸烟和高龄是关键风险因素,需制定整合烟草控制、老年健康管理与健康公平促进的针对性干预策略。
陈浩, 李振汉, 纪梦佳, 汪鑫诚, 陈博峰, 管谦, 武嫚, 卢林明. 全球非酒精性脂肪性肝病负担的关键决定因素:基于GBD数据的机器学习联合孟德尔随机化验证[J]. 南方医科大学学报, 2026, 46(4): 770-784.
Hao CHEN, Zhenhan LI, Mengjia JI, Xincheng WANG, Bofeng CHEN, Qian GUAN, Man WU, Linming LU. Key determinants of global burden of non-alcoholic fatty liver disease: machine learning combined with Mendelian randomization analysis based on GBD data[J]. Journal of Southern Medical University, 2026, 46(4): 770-784.
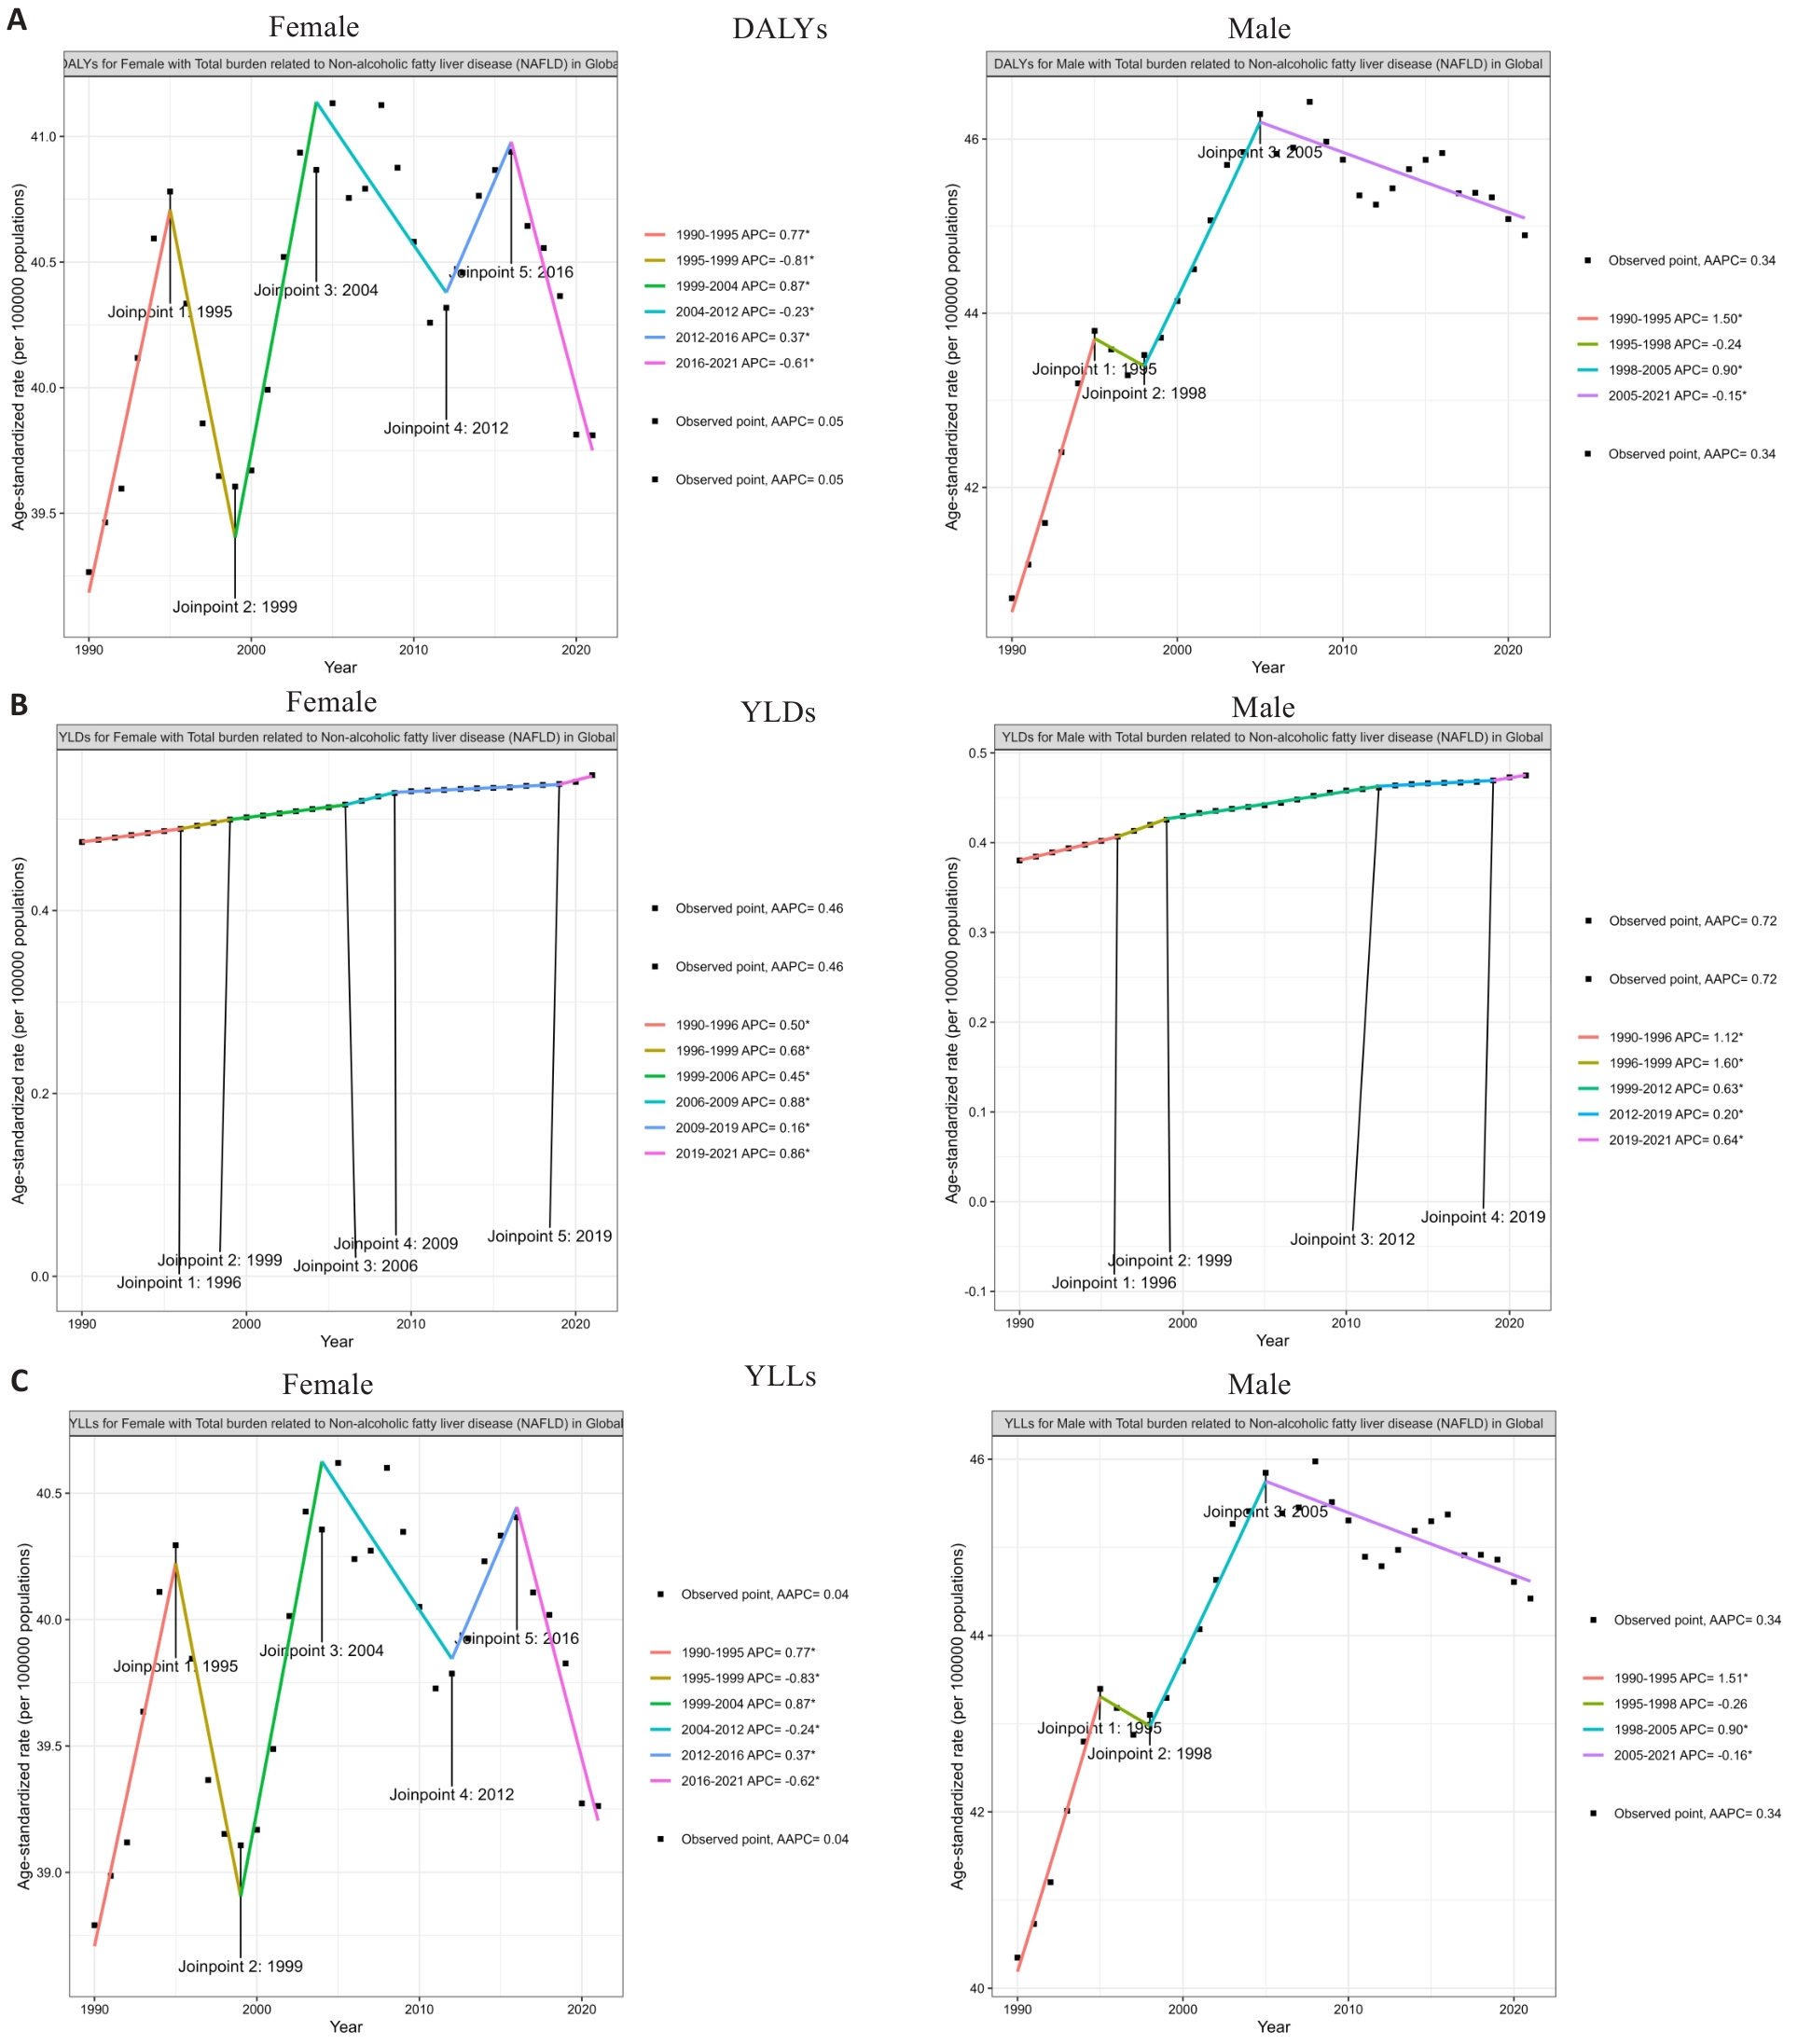
图1 全球NAFLD年龄标准化DALY率、YLDs和YLLs趋势(1990~2021年)按性别分层
Fig.1 Global trends in age-standardized disability-adjusted life years (DALYs), years lived with disability (YLDs), and years of life lost (YLLs) rates of NAFLD (1990-2021) stratified by sex. A: Age-standardized DALYs rate; B: Age-standardized YLDs rate; C: Age-standardized YLLs rate.
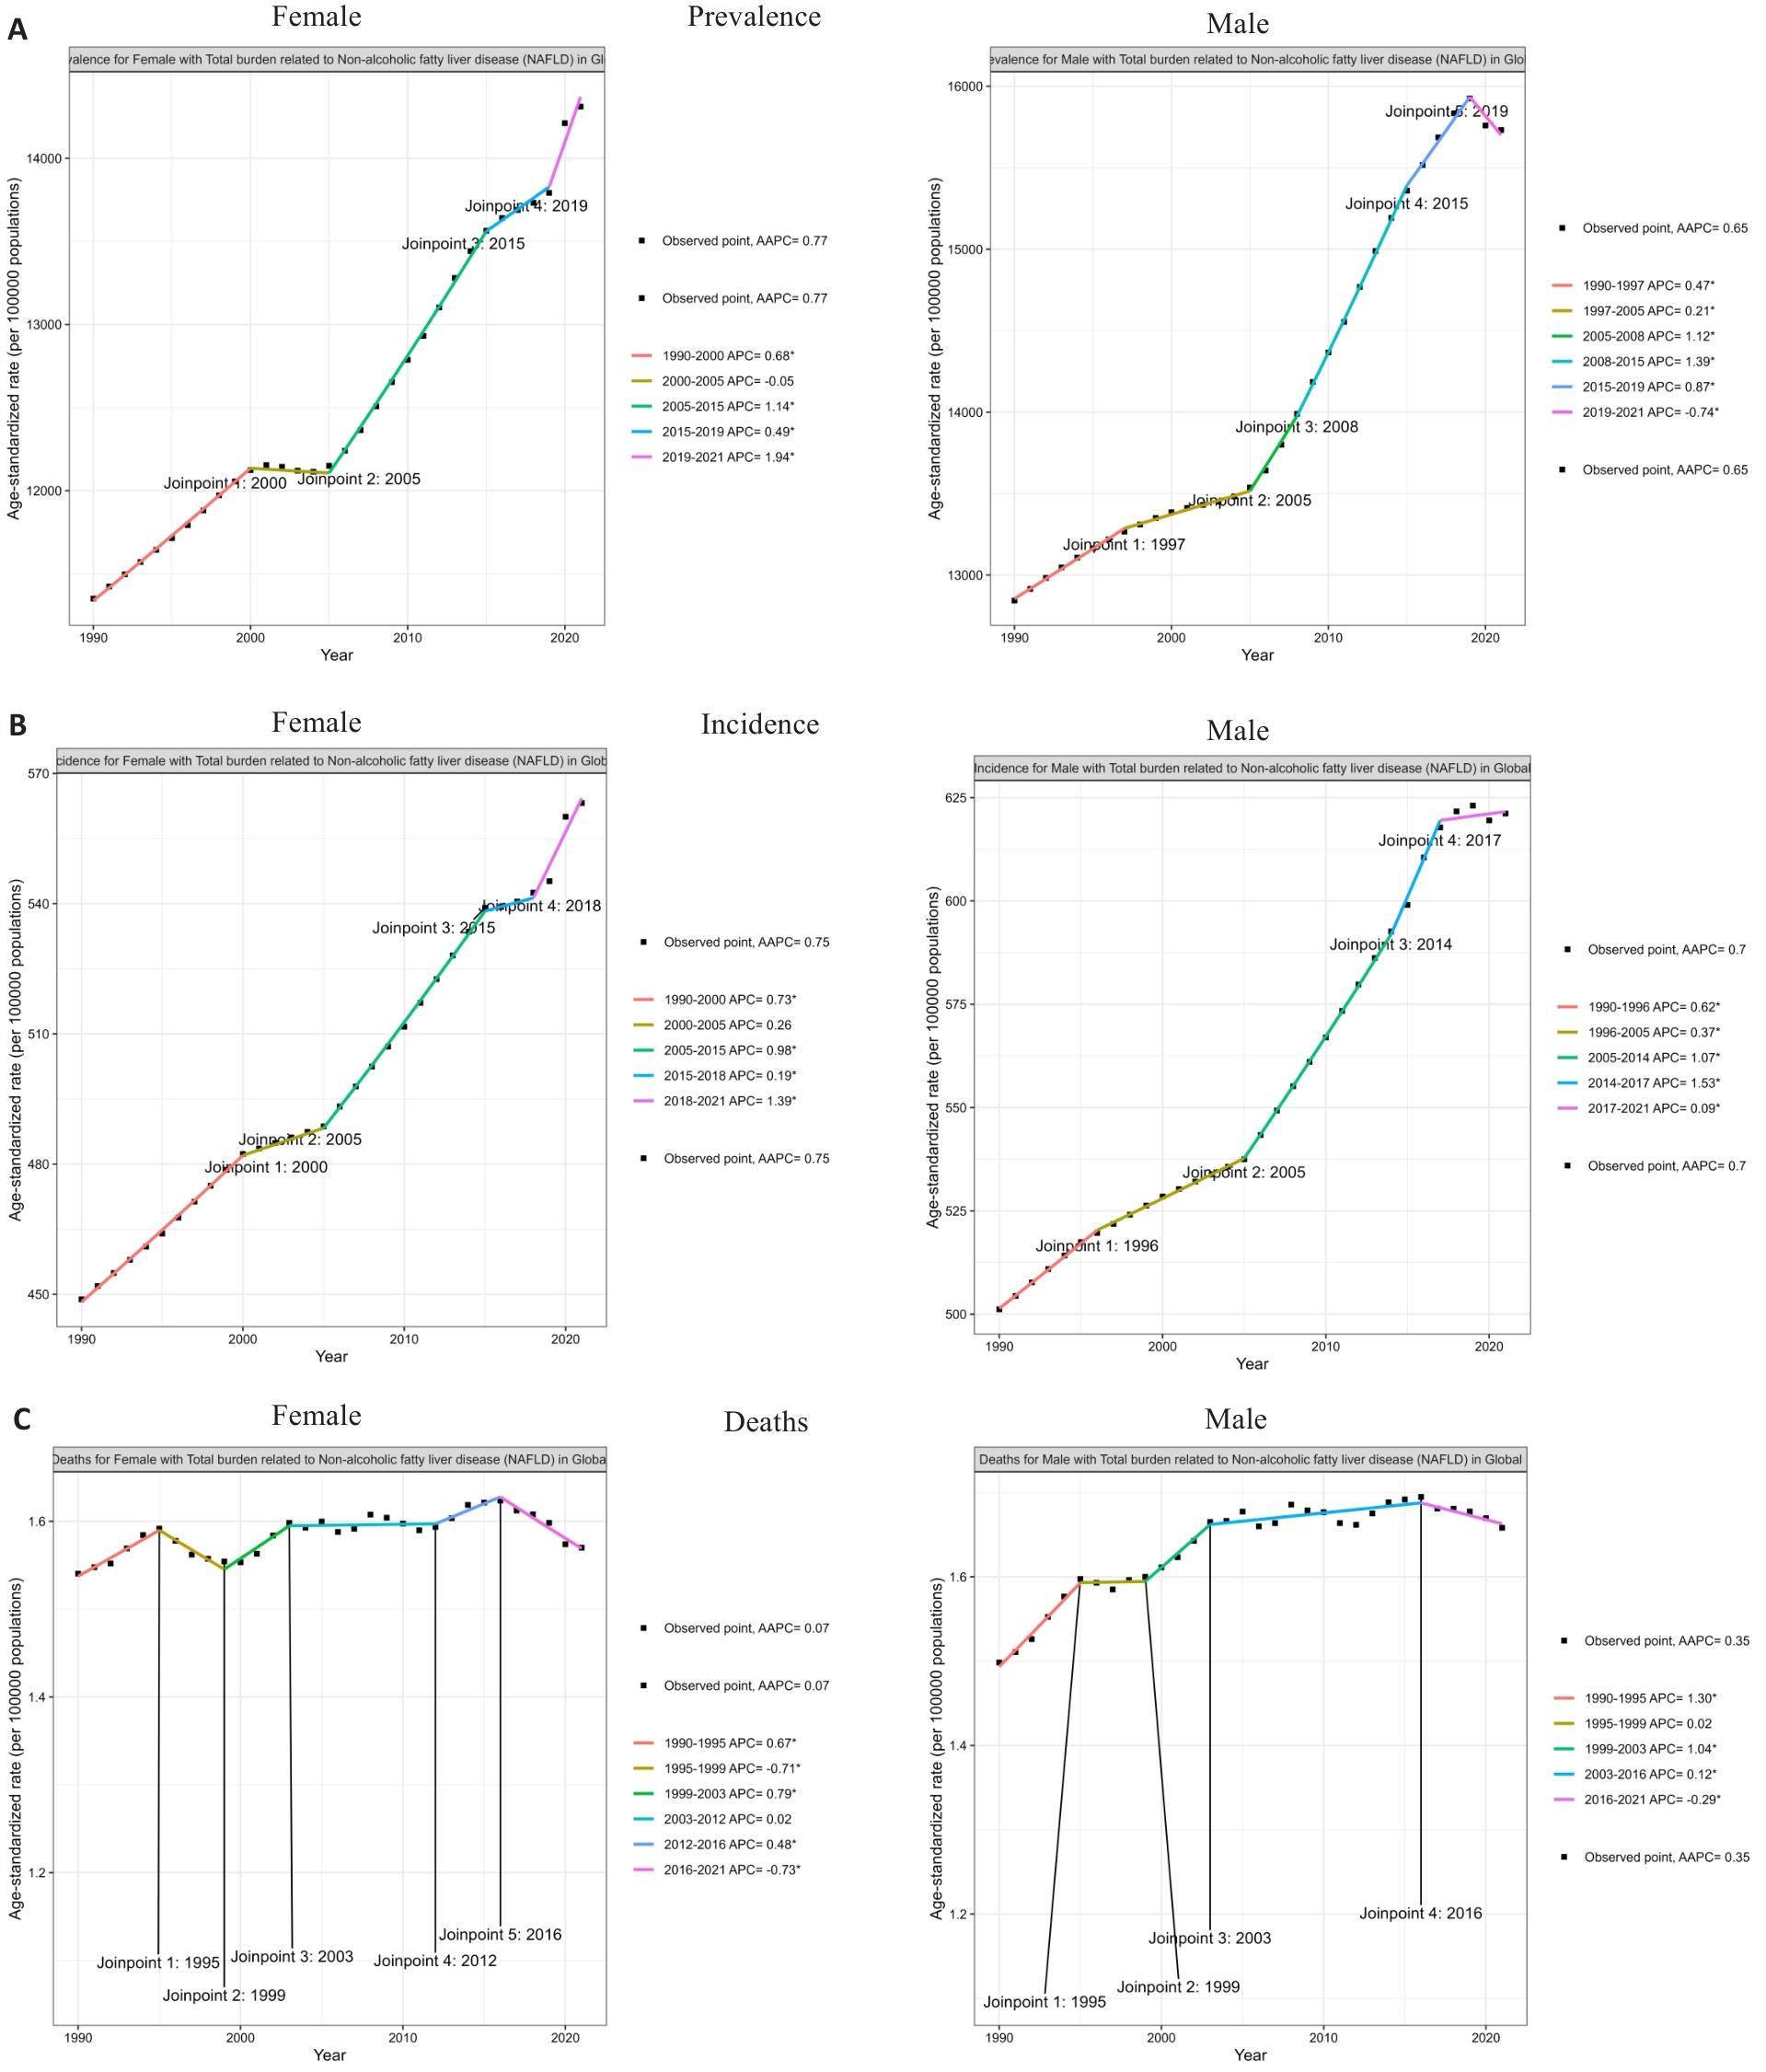
图2 全球NAFLD年龄标准化患病率、发病率和死亡率趋势(1990~2021)按性别分层
Fig.2 Global trends in age-standardized prevalence (A), incidence (B), and mortality rates (C) of NAFLD (1990-2021) stratified by sex.
| Location | DALYs | Deaths | Incidence | Prevalence | YLDs | YLLs | ||||||
|---|---|---|---|---|---|---|---|---|---|---|---|---|
| Female | Male | Female | Male | Female | Male | Female | Male | Female | Male | Female | Male | |
| Global | 0.05 (0.02 to 0.08) | 0.34 (0.31 to 0.37) | 0.07 (0.04 to 0.1) | 0.35 (0.31 to 0.38) | 0.75 (0.73 to 0.76) | 0.7 (0.69 to 0.71) | 0.77 (0.75 to 0.79) | 0.65 (0.64 to 0.66) | 0.46 (0.45 to 0.46) | 0.72 (0.7 to 0.73) | 0.04 (0.01 to 0.07) | 0.34 (0.31 to 0.37) |
| High SDI | 0.1 (0.06 to 0.13) | -0.07 (-0.11 to -0.04) | 0.13 (0.09 to 0.16) | 0.09 (0.06 to 0.12) | 0.95 (0.94 to 0.96) | 0.82 (0.81 to 0.83) | 1.01 (1 to 1.03) | 0.92 (0.91 to 0.93) | 0.55 (0.53 to 0.57) | 0.56 (0.54 to 0.58) | 0.09 (0.05 to 0.12) | -0.08 (-0.12 to -0.04) |
| High-middle SDI | 0.09 (0 to 0.2) | 0.06 (-0.01 to 0.15) | -0.11 (-0.22 to -0.01) | -0.12 (-0.18 to -0.05) | 0.88 (0.84 to 0.92) | 0.72 (0.69 to 0.74) | 0.88 (0.85 to 0.92) | 0.64 (0.61 to 0.67) | 0.38 (0.35 to 0.41) | 0.41 (0.39 to 0.44) | 0.08 (0 to 0.2) | 0.06 (-0.02 to 0.15) |
| Middle SDI | -0.09 (-0.13 to -0.04) | 0.6 (0.56 to 0.63) | 0.01 (-0.03 to 0.05) | 0.62 (0.58 to 0.68) | 0.63 (0.61 to 0.66) | 0.7 (0.69 to 0.72) | 0.61 (0.59 to 0.64) | 0.57 (0.54 to 0.58) | 0.68 (0.66 to 0.69) | 1.04 (1.03 to 1.05) | -0.09 (-0.14 to -0.05) | 0.59 (0.56 to 0.63) |
Low- middle SDI | 0.08 (0.04 to 0.1) | 0.8 (0.78 to 0.83) | -0.08 (-0.12 to -0.06) | 0.87 (0.83 to 0.9) | 0.54 (0.54 to 0.55) | 0.62 (0.61 to 0.62) | 0.42 (0.41 to 0.42) | 0.54 (0.53 to 0.55) | 1.04 (1.01 to 1.06) | 1.49 (1.47 to 1.5) | 0.07 (0.04 to 0.09) | 0.8 (0.77 to 0.82) |
| Low-SDI | -0.32 (-0.33 to -0.3) | -0.36 (-0.37 to -0.34) | -0.25 (-0.27 to -0.22) | -0.31 (-0.34 to -0.29) | 0.43 (0.43 to 0.43) | 0.46 (0.45 to 0.46) | 0.35 (0.34 to 0.35) | 0.39 (0.38 to 0.39) | 0.15 (0.13 to 0.16) | 0.14 (0.13 to 0.16) | -0.32 (-0.34 to -0.3) | -0.36 (-0.38 to -0.34) |
表1 按性别和SDI分层的NAFLD相关负担指标AAPC(1990~2021)
Tab.1 Average annual percentage change (AAPC) of NAFLD-related burden indicators by sex and SDI (1990-2021)
| Location | DALYs | Deaths | Incidence | Prevalence | YLDs | YLLs | ||||||
|---|---|---|---|---|---|---|---|---|---|---|---|---|
| Female | Male | Female | Male | Female | Male | Female | Male | Female | Male | Female | Male | |
| Global | 0.05 (0.02 to 0.08) | 0.34 (0.31 to 0.37) | 0.07 (0.04 to 0.1) | 0.35 (0.31 to 0.38) | 0.75 (0.73 to 0.76) | 0.7 (0.69 to 0.71) | 0.77 (0.75 to 0.79) | 0.65 (0.64 to 0.66) | 0.46 (0.45 to 0.46) | 0.72 (0.7 to 0.73) | 0.04 (0.01 to 0.07) | 0.34 (0.31 to 0.37) |
| High SDI | 0.1 (0.06 to 0.13) | -0.07 (-0.11 to -0.04) | 0.13 (0.09 to 0.16) | 0.09 (0.06 to 0.12) | 0.95 (0.94 to 0.96) | 0.82 (0.81 to 0.83) | 1.01 (1 to 1.03) | 0.92 (0.91 to 0.93) | 0.55 (0.53 to 0.57) | 0.56 (0.54 to 0.58) | 0.09 (0.05 to 0.12) | -0.08 (-0.12 to -0.04) |
| High-middle SDI | 0.09 (0 to 0.2) | 0.06 (-0.01 to 0.15) | -0.11 (-0.22 to -0.01) | -0.12 (-0.18 to -0.05) | 0.88 (0.84 to 0.92) | 0.72 (0.69 to 0.74) | 0.88 (0.85 to 0.92) | 0.64 (0.61 to 0.67) | 0.38 (0.35 to 0.41) | 0.41 (0.39 to 0.44) | 0.08 (0 to 0.2) | 0.06 (-0.02 to 0.15) |
| Middle SDI | -0.09 (-0.13 to -0.04) | 0.6 (0.56 to 0.63) | 0.01 (-0.03 to 0.05) | 0.62 (0.58 to 0.68) | 0.63 (0.61 to 0.66) | 0.7 (0.69 to 0.72) | 0.61 (0.59 to 0.64) | 0.57 (0.54 to 0.58) | 0.68 (0.66 to 0.69) | 1.04 (1.03 to 1.05) | -0.09 (-0.14 to -0.05) | 0.59 (0.56 to 0.63) |
Low- middle SDI | 0.08 (0.04 to 0.1) | 0.8 (0.78 to 0.83) | -0.08 (-0.12 to -0.06) | 0.87 (0.83 to 0.9) | 0.54 (0.54 to 0.55) | 0.62 (0.61 to 0.62) | 0.42 (0.41 to 0.42) | 0.54 (0.53 to 0.55) | 1.04 (1.01 to 1.06) | 1.49 (1.47 to 1.5) | 0.07 (0.04 to 0.09) | 0.8 (0.77 to 0.82) |
| Low-SDI | -0.32 (-0.33 to -0.3) | -0.36 (-0.37 to -0.34) | -0.25 (-0.27 to -0.22) | -0.31 (-0.34 to -0.29) | 0.43 (0.43 to 0.43) | 0.46 (0.45 to 0.46) | 0.35 (0.34 to 0.35) | 0.39 (0.38 to 0.39) | 0.15 (0.13 to 0.16) | 0.14 (0.13 to 0.16) | -0.32 (-0.34 to -0.3) | -0.36 (-0.38 to -0.34) |
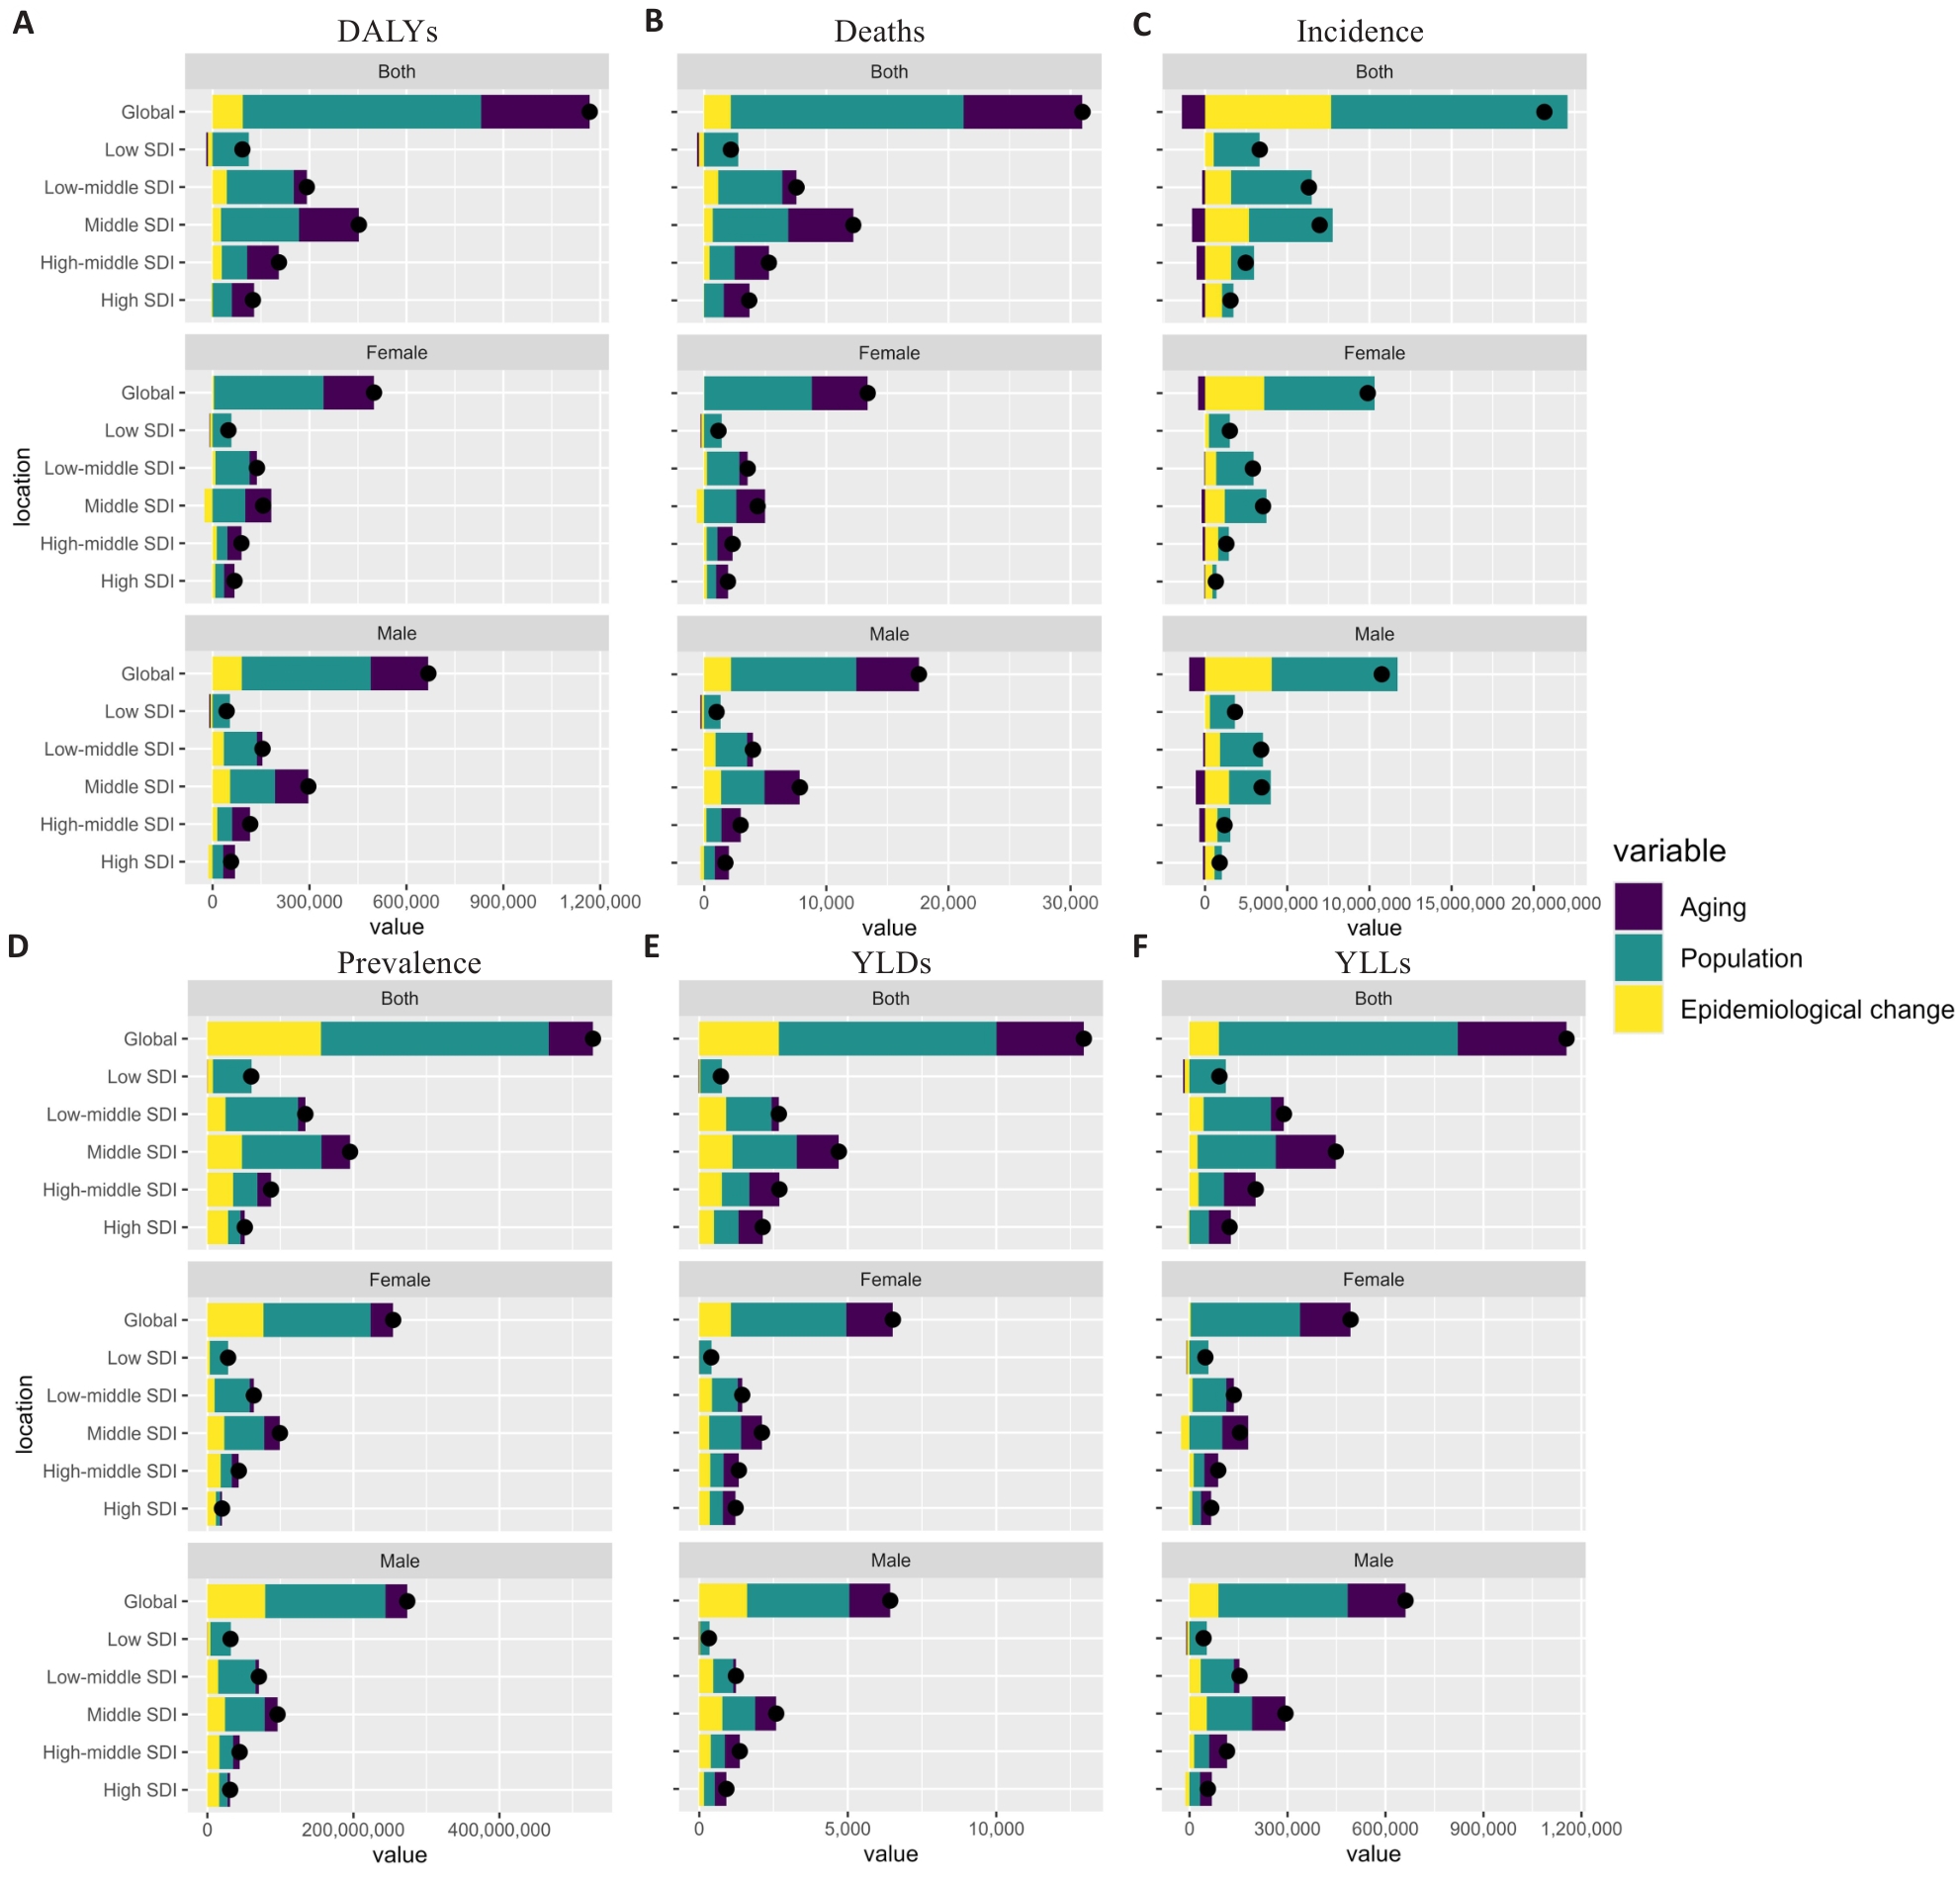
图3 按SDI分层的NAFLD负担驱动因素分解
Fig.3 Decomposition of NAFLD burden drivers stratified by SDI. A: DALYs. B: Deaths. C: Incident cases. D: Prevalent cases. E: YLDs. F: YLLs.
| Location | Aging | Population | Epidemiological change | |||
|---|---|---|---|---|---|---|
| Female | Male | Female | Male | Female | Male | |
| Global | 14419.67 (36.2%) | 13433.21 (34.48%) | 24454.98 (61.39%) | 21239.63 (54.52%) | 958.31 (2.41%) | 4286.05 (11%) |
| High SDI | 3662.74 (47.31%) | 3535.45 (52.37%) | 3289.18 (42.48%) | 2890.79 (42.82%) | 790.68 (10.21%) | 324.23 (4.8%) |
| High-middle SDI | 3965.7 (60.49%) | 3928.67 (62.65%) | 3143.9 (47.95%) | 2996.16 (47.78%) | -553.23 (-8.44%) | -654.46 (-10.44%) |
| Middle SDI | 7052.4 (49.81%) | 6559.51 (40.23%) | 7146.98 (50.48%) | 7015.22 (43.03%) | -40.46 (-0.29%) | 2730.11 (16.74%) |
| Low-middle SDI | 2452.8 (28.15%) | 1214.64 (15.51%) | 6260.62 (71.86%) | 4682.7 (59.78%) | -1.24 (-0.01%) | 1936.13 (24.72%) |
| Low SDI | -42.7 (-1.62%) | -193.15 (-10.97%) | 3031.76 (115.34%) | 2274.03 (129.2%) | -360.44 (-13.71%) | -320.85 (-18.23%) |
表2 按SDI和性别分层的NAFLD归因死亡数驱动因素分解
Tab.2 Decomposition of NAFLD-attributable deaths by SDI and sex
| Location | Aging | Population | Epidemiological change | |||
|---|---|---|---|---|---|---|
| Female | Male | Female | Male | Female | Male | |
| Global | 14419.67 (36.2%) | 13433.21 (34.48%) | 24454.98 (61.39%) | 21239.63 (54.52%) | 958.31 (2.41%) | 4286.05 (11%) |
| High SDI | 3662.74 (47.31%) | 3535.45 (52.37%) | 3289.18 (42.48%) | 2890.79 (42.82%) | 790.68 (10.21%) | 324.23 (4.8%) |
| High-middle SDI | 3965.7 (60.49%) | 3928.67 (62.65%) | 3143.9 (47.95%) | 2996.16 (47.78%) | -553.23 (-8.44%) | -654.46 (-10.44%) |
| Middle SDI | 7052.4 (49.81%) | 6559.51 (40.23%) | 7146.98 (50.48%) | 7015.22 (43.03%) | -40.46 (-0.29%) | 2730.11 (16.74%) |
| Low-middle SDI | 2452.8 (28.15%) | 1214.64 (15.51%) | 6260.62 (71.86%) | 4682.7 (59.78%) | -1.24 (-0.01%) | 1936.13 (24.72%) |
| Low SDI | -42.7 (-1.62%) | -193.15 (-10.97%) | 3031.76 (115.34%) | 2274.03 (129.2%) | -360.44 (-13.71%) | -320.85 (-18.23%) |
| Location | Aging | Population | Epidemiological change | |||
|---|---|---|---|---|---|---|
| Female | Male | Female | Male | Female | Male | |
| Global | 44483771.87 (16.58%) | 44269747.11 (14.95%) | 205531485.28 (76.6%) | 218539970.47 (73.8%) | 97676566.68 (36.4%) | 92934328.25 (31.38%) |
| High SDI | 5184817.85 (14.13%) | 6663980.9 (13.43%) | 13923637.39 (37.95%) | 21393081.71 (43.12%) | 15520327.55 (42.3%) | 19927730.42 (40.17%) |
| High-middle SDI | 14607816.21 (22.8%) | 13232909.37 (19.71%) | 27866316.58 (43.5%) | 29817746.28 (44.42%) | 24563543.43 (38.34%) | 19671925.7 (29.3%) |
| Middle SDI | 30028010.02 (31.74%) | 24644902.37 (25.09%) | 77231967 (81.64%) | 72694788.04 (74.01%) | 28171016.9 (29.78%) | 28023053.32 (28.53%) |
| Low-middle SDI | 7638124.99 (14.18%) | 6025521.11 (10.11%) | 58970988.08 (109.49%) | 61405554.89 (103.06%) | 11723202.04 (21.77%) | 16684909.61 (28%) |
| Low SDI | -118112.99 (-0.63%) | -640813.47 (-3.01%) | 28417047.9 (151.17%) | 31321397.28 (147.11%) | 3724985.49 (19.82%) | 4642147.02 (21.8%) |
表3 按SDI和性别分层的NAFLD患病病例数驱动因素分解
Tab.3 Decomposition of NAFLD prevalent cases by SDI and sex
| Location | Aging | Population | Epidemiological change | |||
|---|---|---|---|---|---|---|
| Female | Male | Female | Male | Female | Male | |
| Global | 44483771.87 (16.58%) | 44269747.11 (14.95%) | 205531485.28 (76.6%) | 218539970.47 (73.8%) | 97676566.68 (36.4%) | 92934328.25 (31.38%) |
| High SDI | 5184817.85 (14.13%) | 6663980.9 (13.43%) | 13923637.39 (37.95%) | 21393081.71 (43.12%) | 15520327.55 (42.3%) | 19927730.42 (40.17%) |
| High-middle SDI | 14607816.21 (22.8%) | 13232909.37 (19.71%) | 27866316.58 (43.5%) | 29817746.28 (44.42%) | 24563543.43 (38.34%) | 19671925.7 (29.3%) |
| Middle SDI | 30028010.02 (31.74%) | 24644902.37 (25.09%) | 77231967 (81.64%) | 72694788.04 (74.01%) | 28171016.9 (29.78%) | 28023053.32 (28.53%) |
| Low-middle SDI | 7638124.99 (14.18%) | 6025521.11 (10.11%) | 58970988.08 (109.49%) | 61405554.89 (103.06%) | 11723202.04 (21.77%) | 16684909.61 (28%) |
| Low SDI | -118112.99 (-0.63%) | -640813.47 (-3.01%) | 28417047.9 (151.17%) | 31321397.28 (147.11%) | 3724985.49 (19.82%) | 4642147.02 (21.8%) |
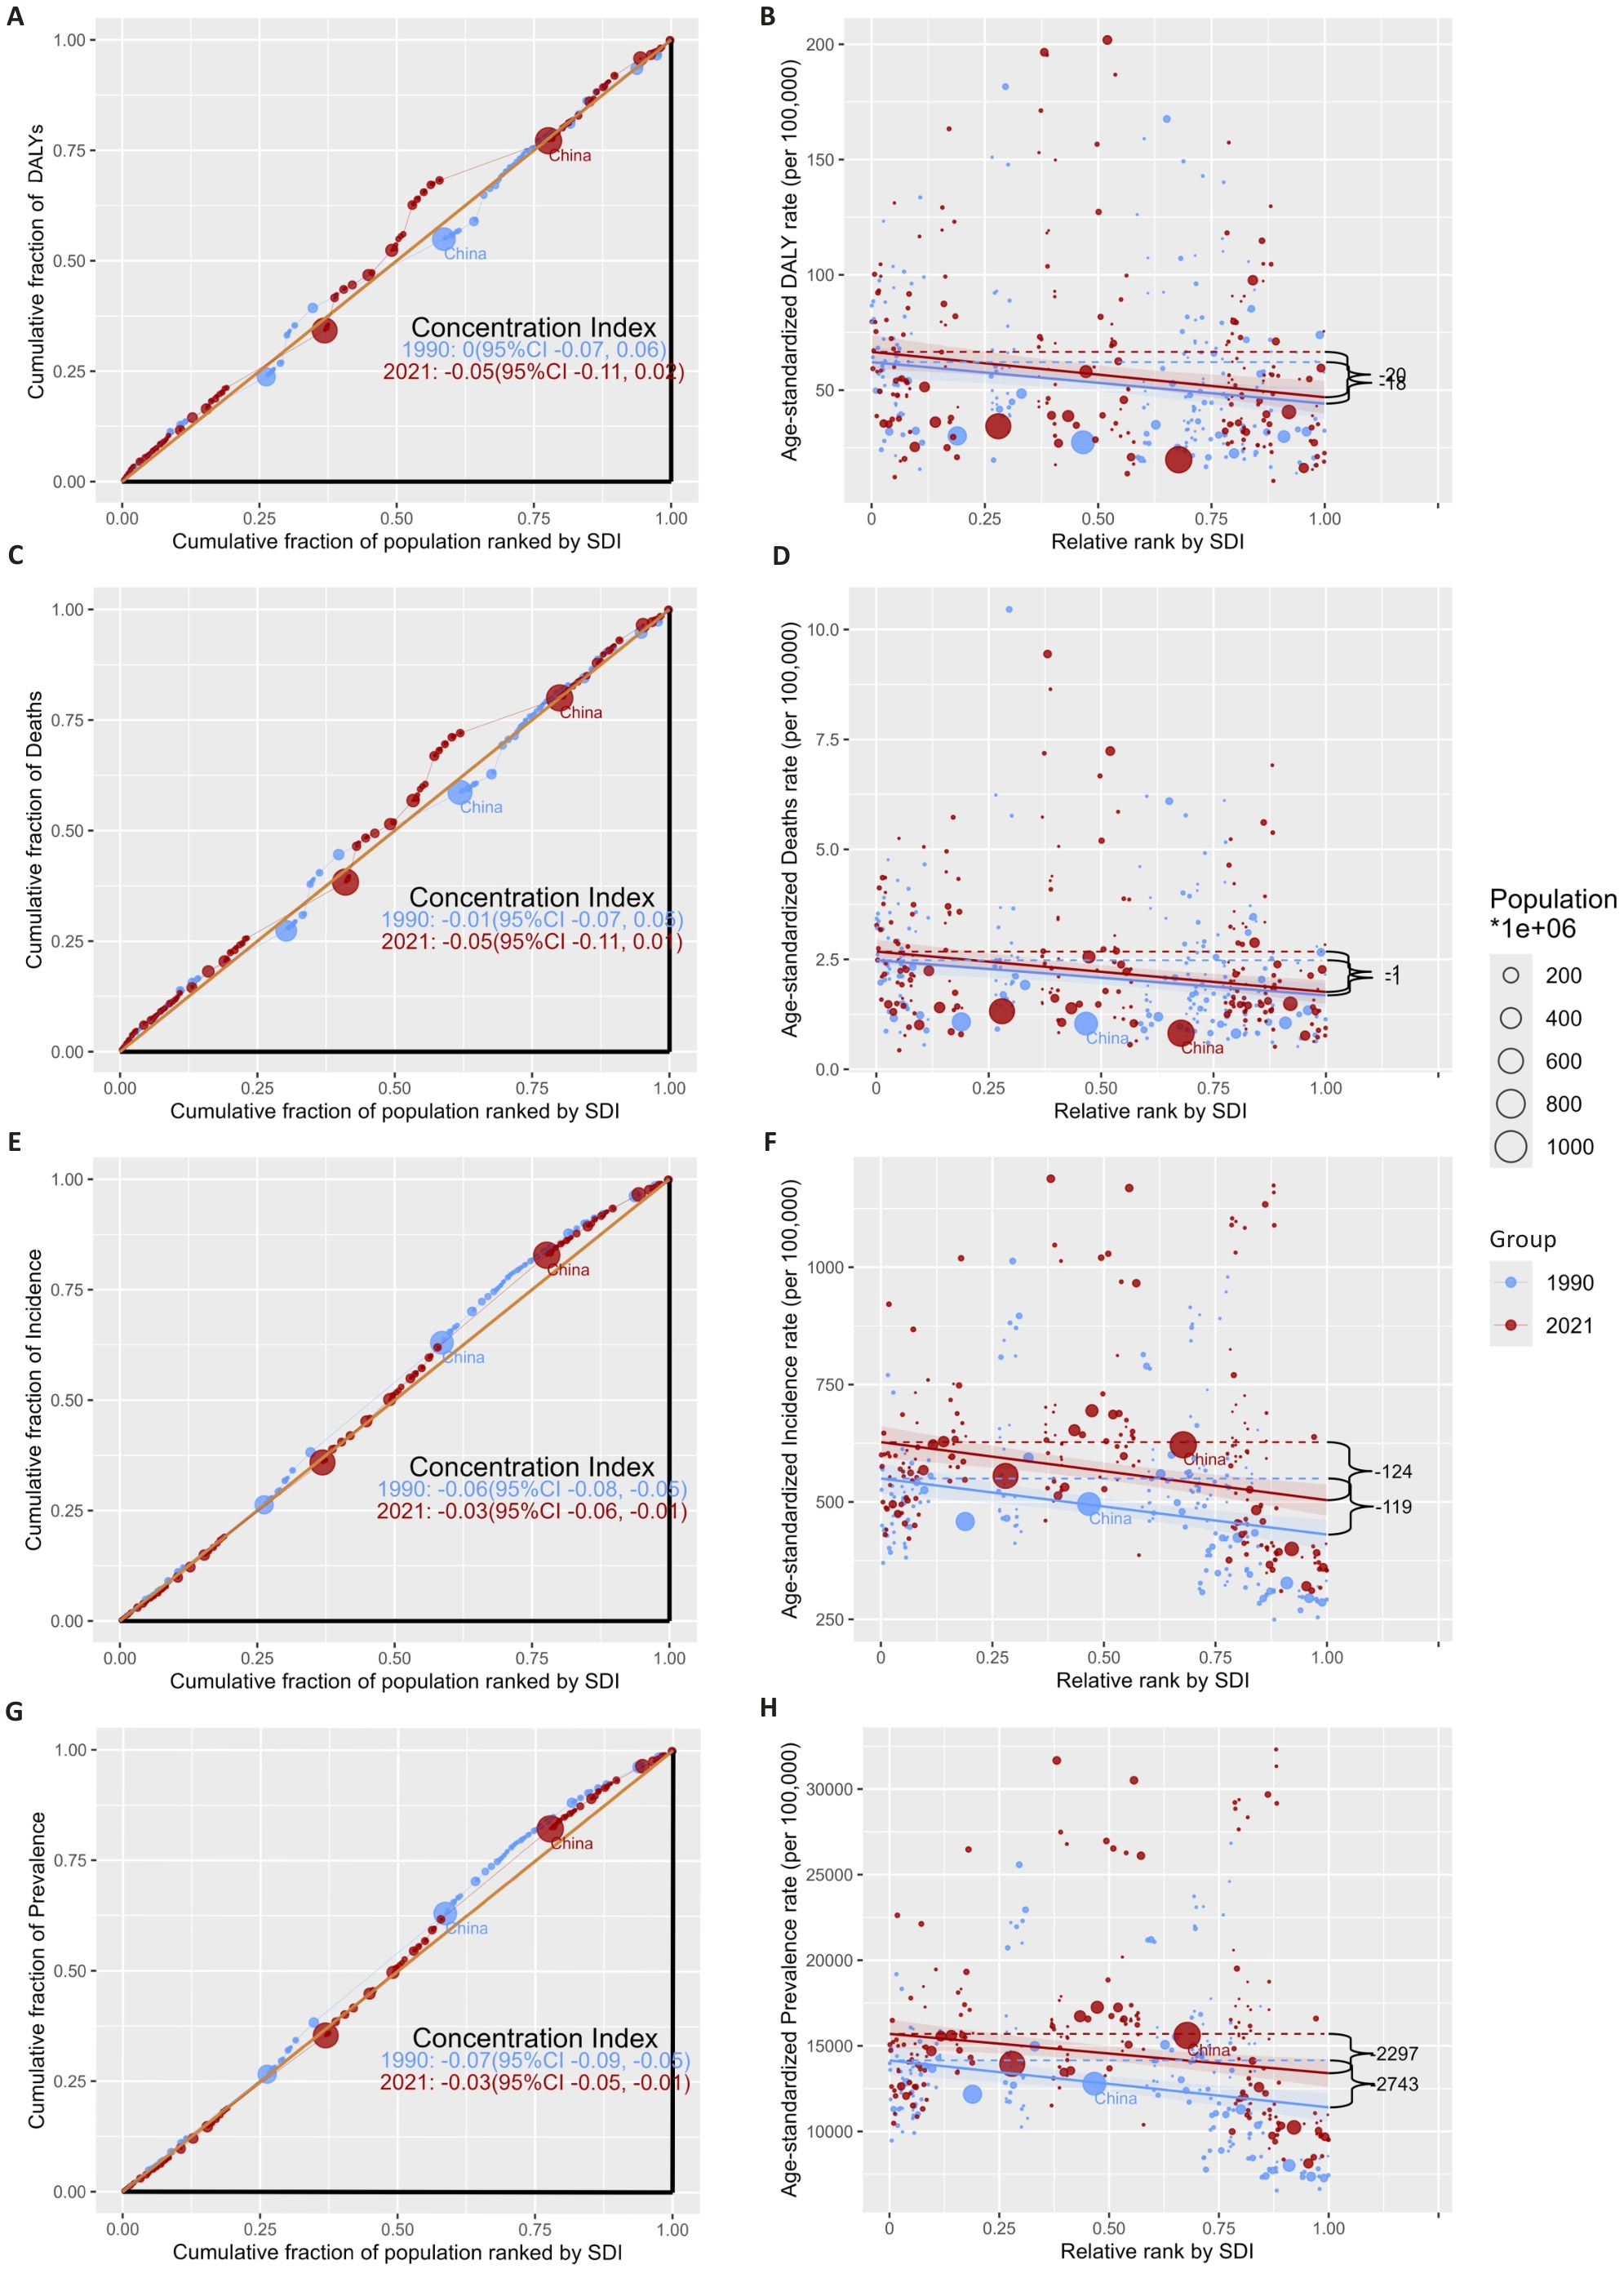
图4 NAFLD负担的社会经济不平等分析(1990年与2021年)
Fig.4 Socioeconomic inequality analysis of NAFLD burden (1990 and 2021). A: Lorenz curve for DALYs. B: Scatter plot of DALYs rate against SDI rank. C: Lorenz curve for deaths. D: Scatter plot of death rate against SDI rank. E: Lorenz curve for incidence. F: Scatter plot of incidence rate against SDI rank. G: Lorenz curve for prevalence. H: Scatter plot of prevalence rate against SDI rank.
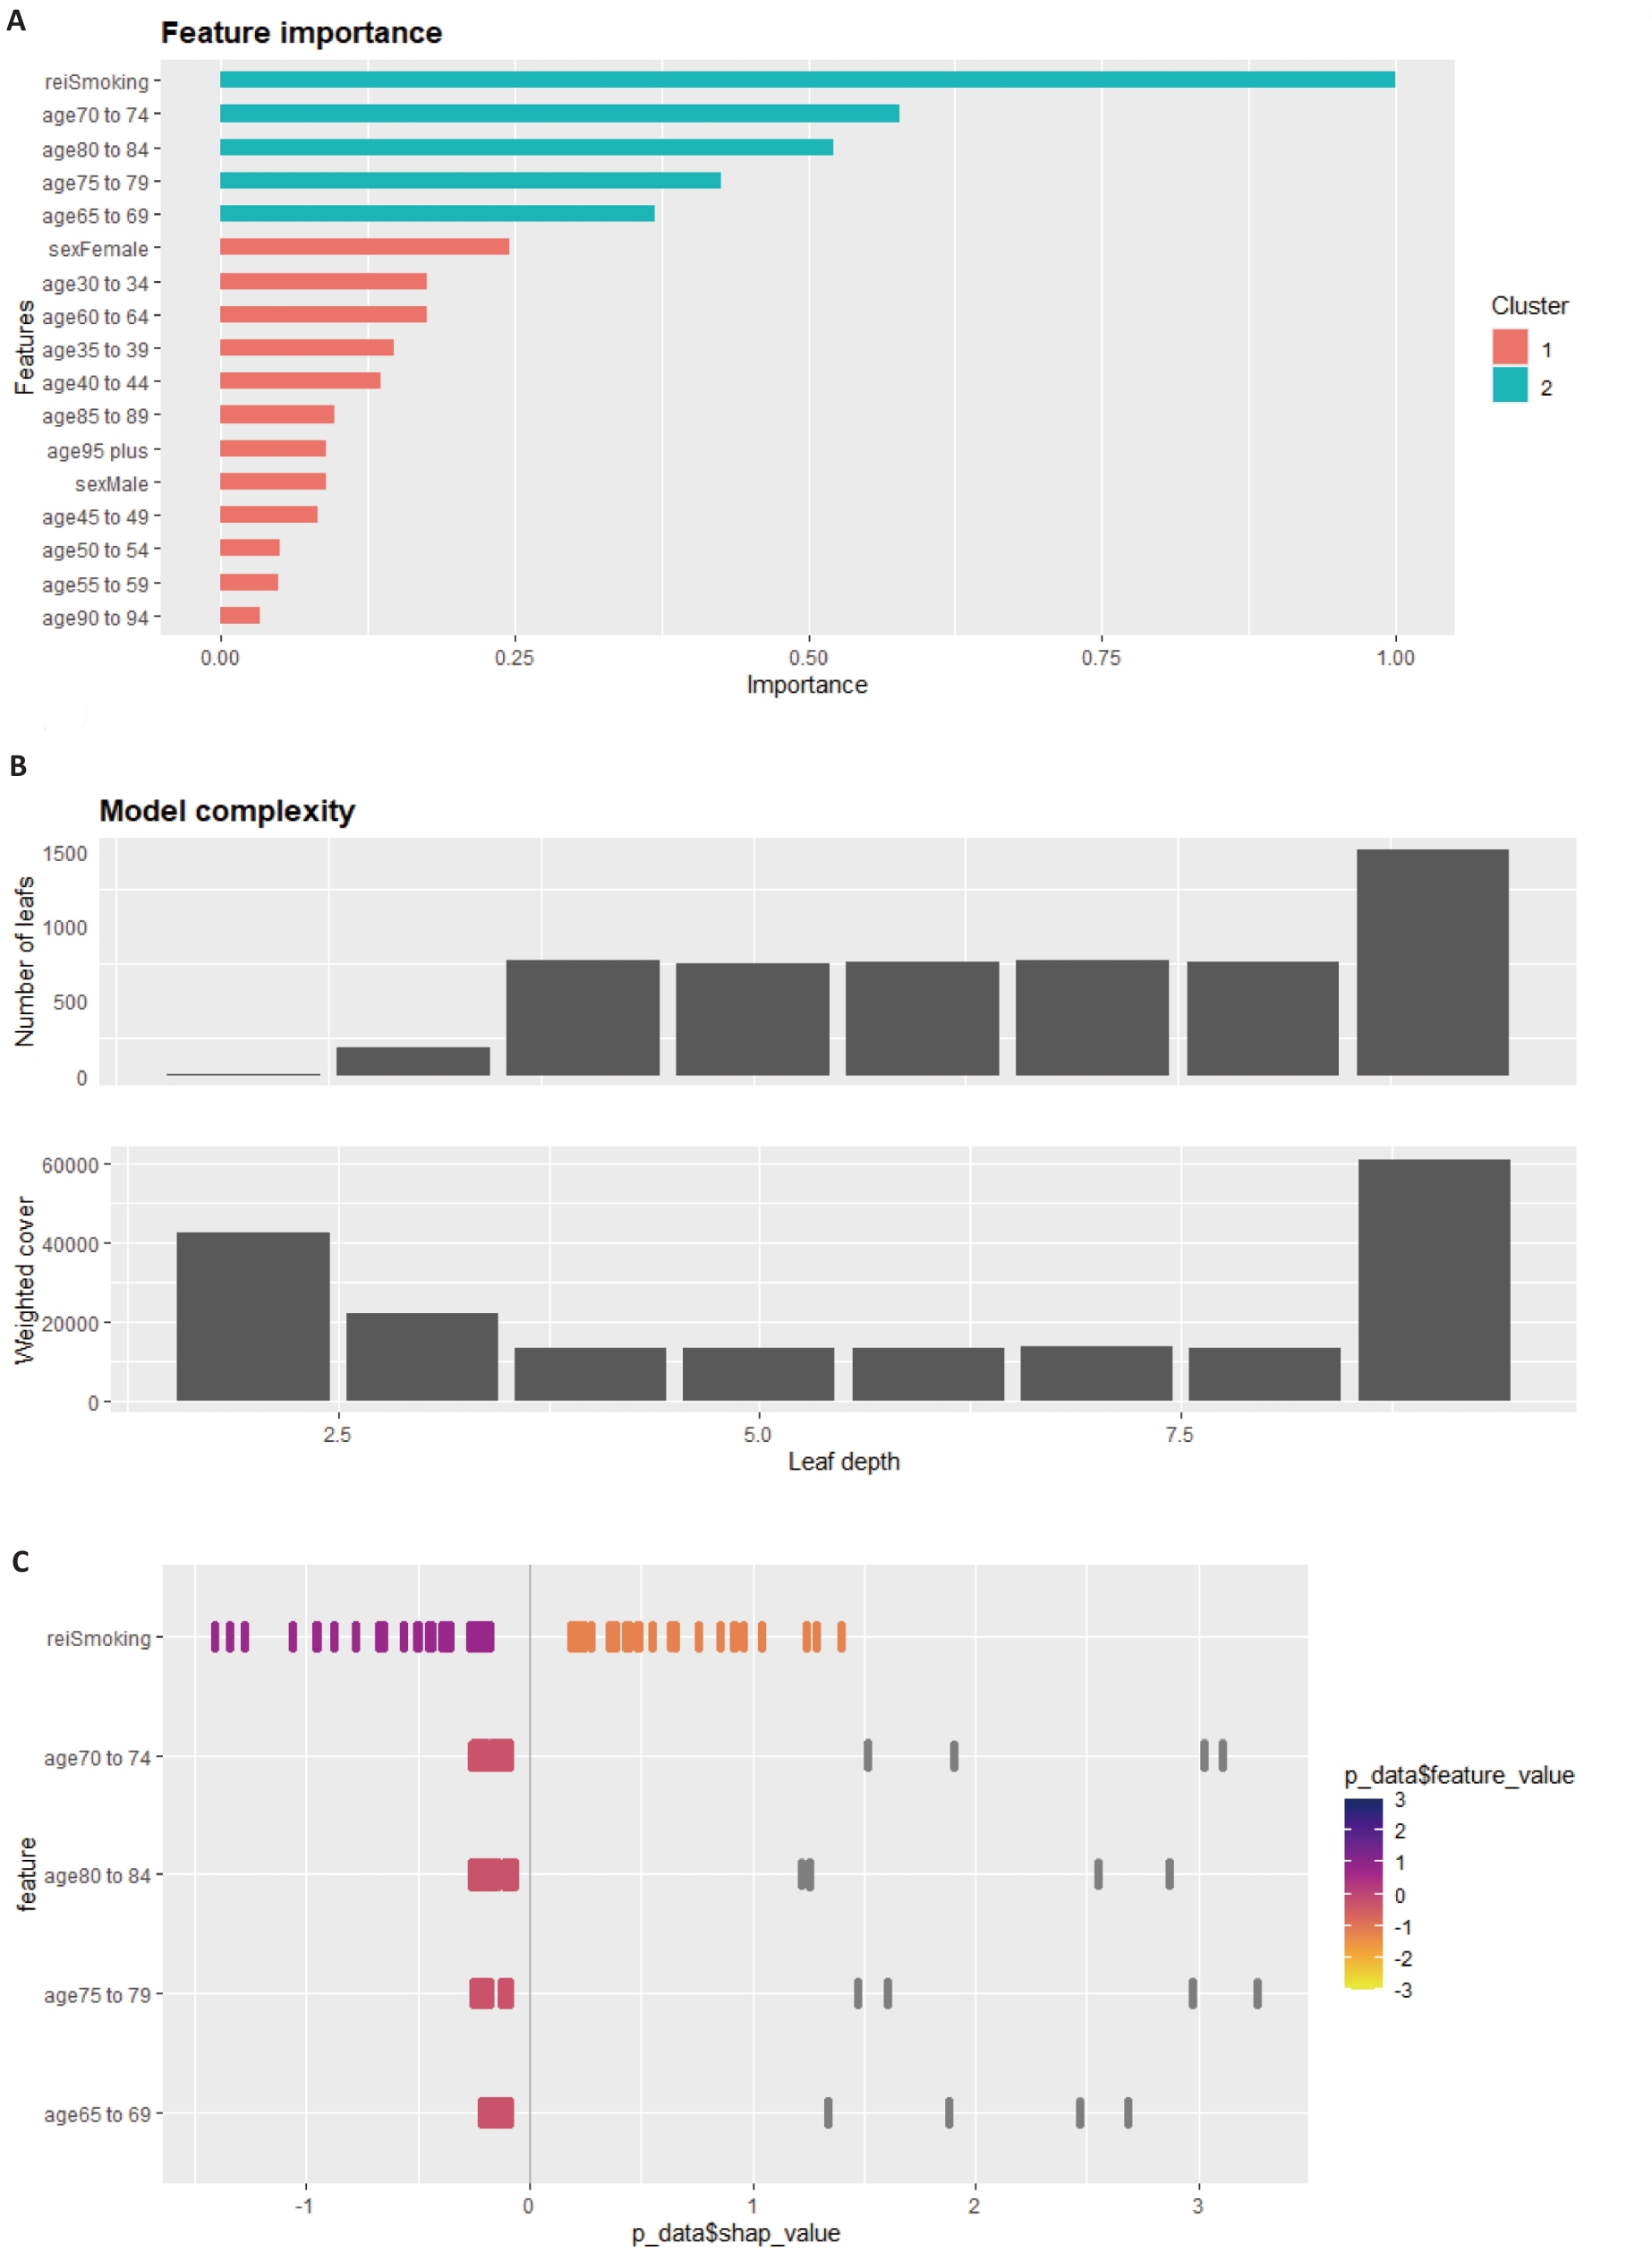
图5 基于XGBoost-SHAP的NAFLD死亡风险预测模型特征解析
Fig.5 Feature interpretation of the XGBoost-SHAP model for predicting NAFLD mortality risk: feature importance, model diagnostics, and ternary decomposition. A: Feature importance; B: Model diagnostics; C: Ternary decomposition of importance metrics.
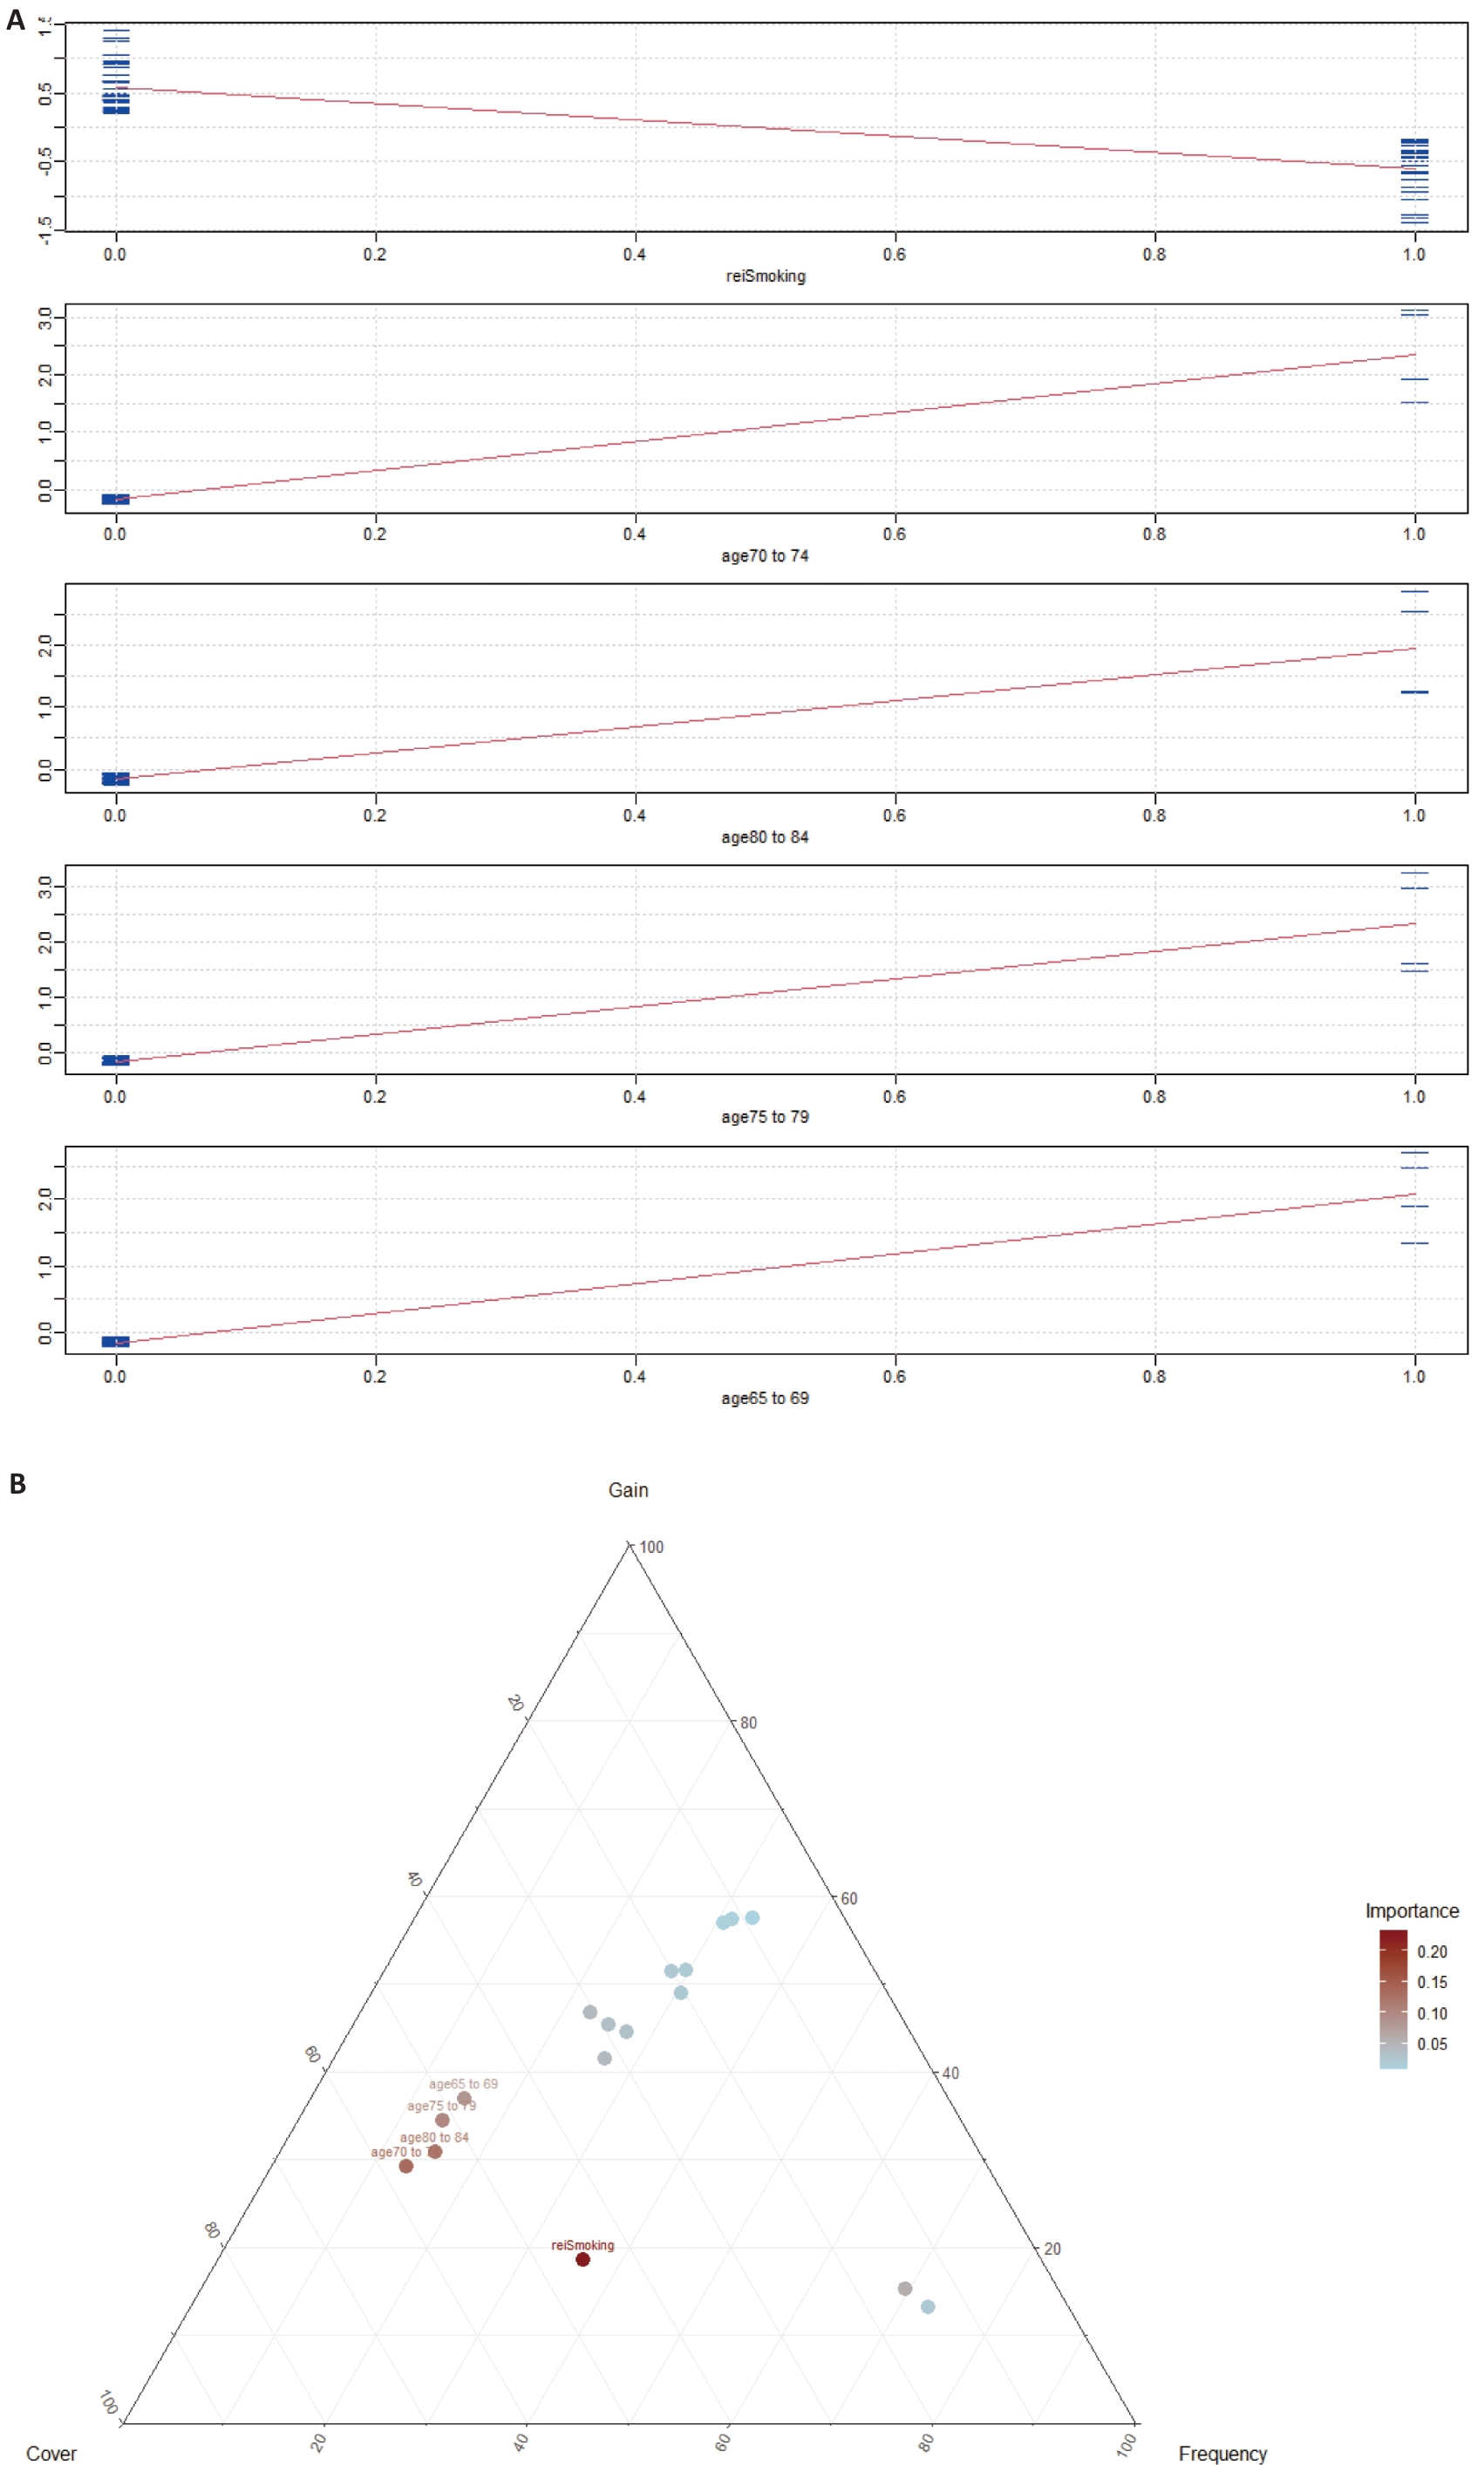
图6 基于XGBoost-SHAP的NAFLD死亡风险预测模型特征解析:SHAP摘要图与依赖图
Fig.6 Feature interpretation of the XGBoost-SHAP model for predicting NAFLD mortality risk: SHAP summary plot (A) and dependence plot (B).
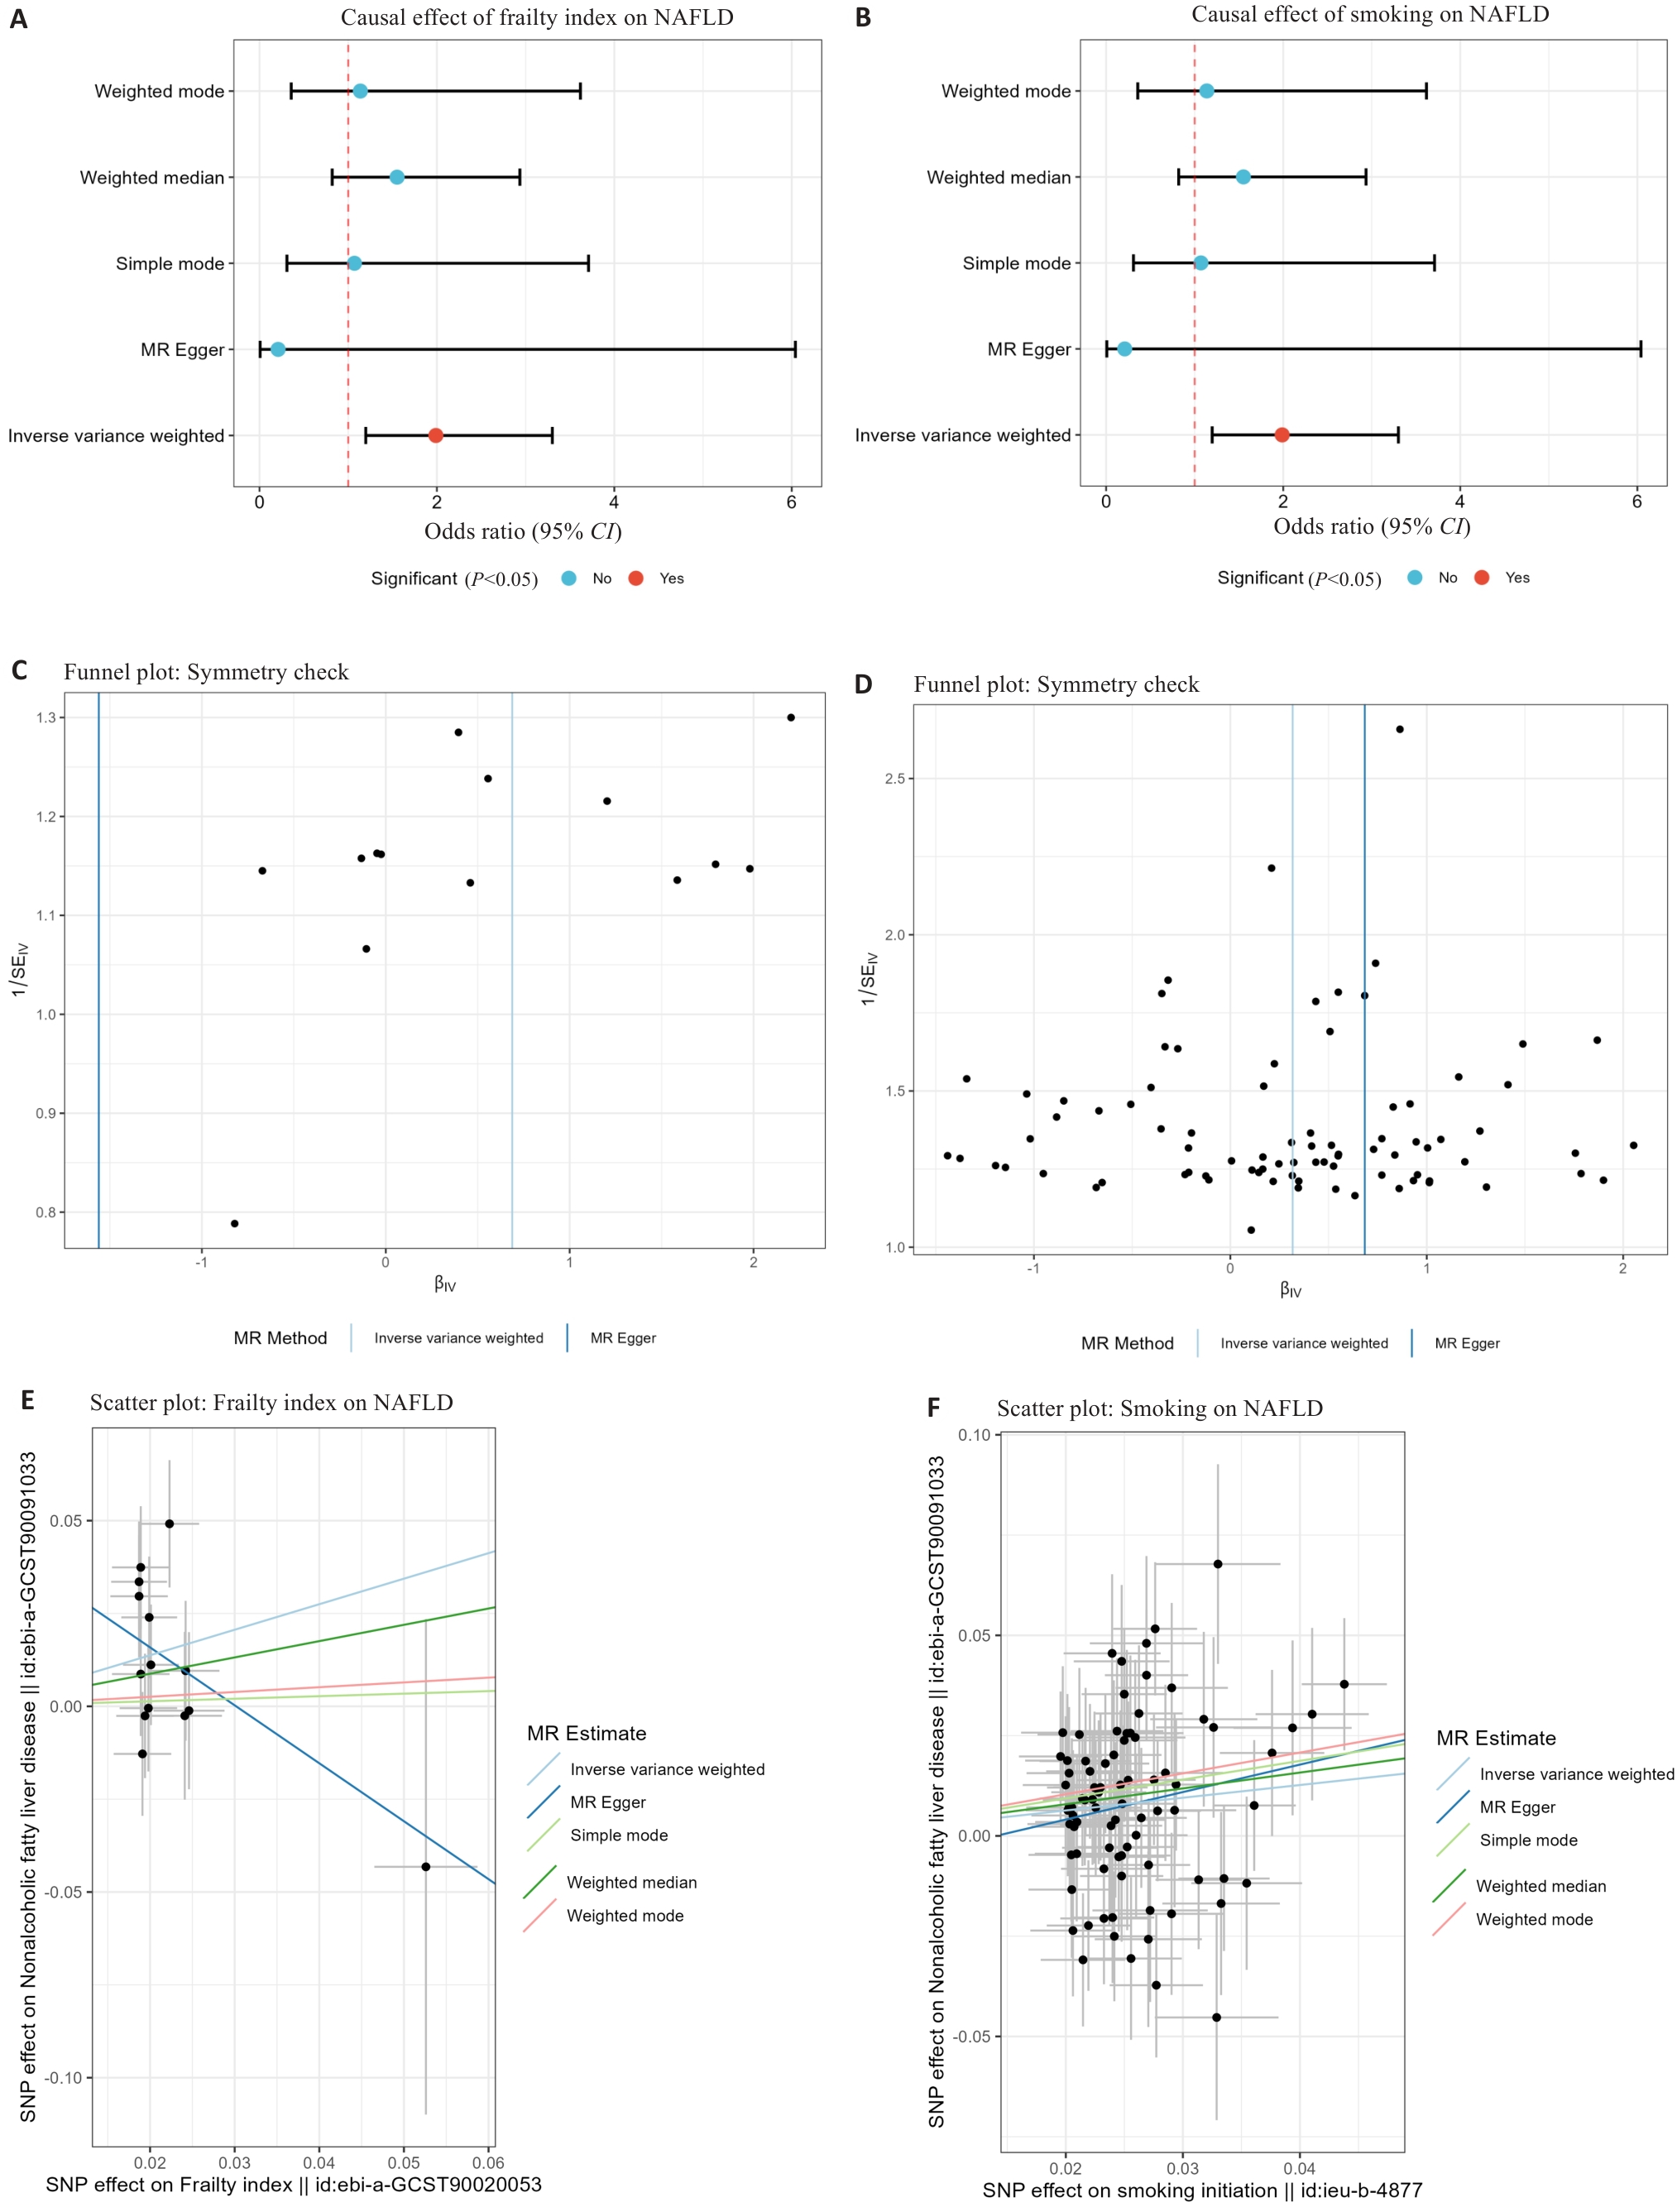
图7 基于孟德尔随机化的衰老(衰弱指数)与吸烟对NAFLD风险的因果效应分析
Fig.7 Mendelian randomization analysis of the causal effects of aging (frailty index) and smoking on NAFLD risk. A: Forest plot for frailty index. B: Forest plot for smoking initiation. C: Funnel plot for frailty index. D: Funnel plot for smoking initiation.E: Scatter plot for frailty index. F: Scatter plot for smoking initiation.
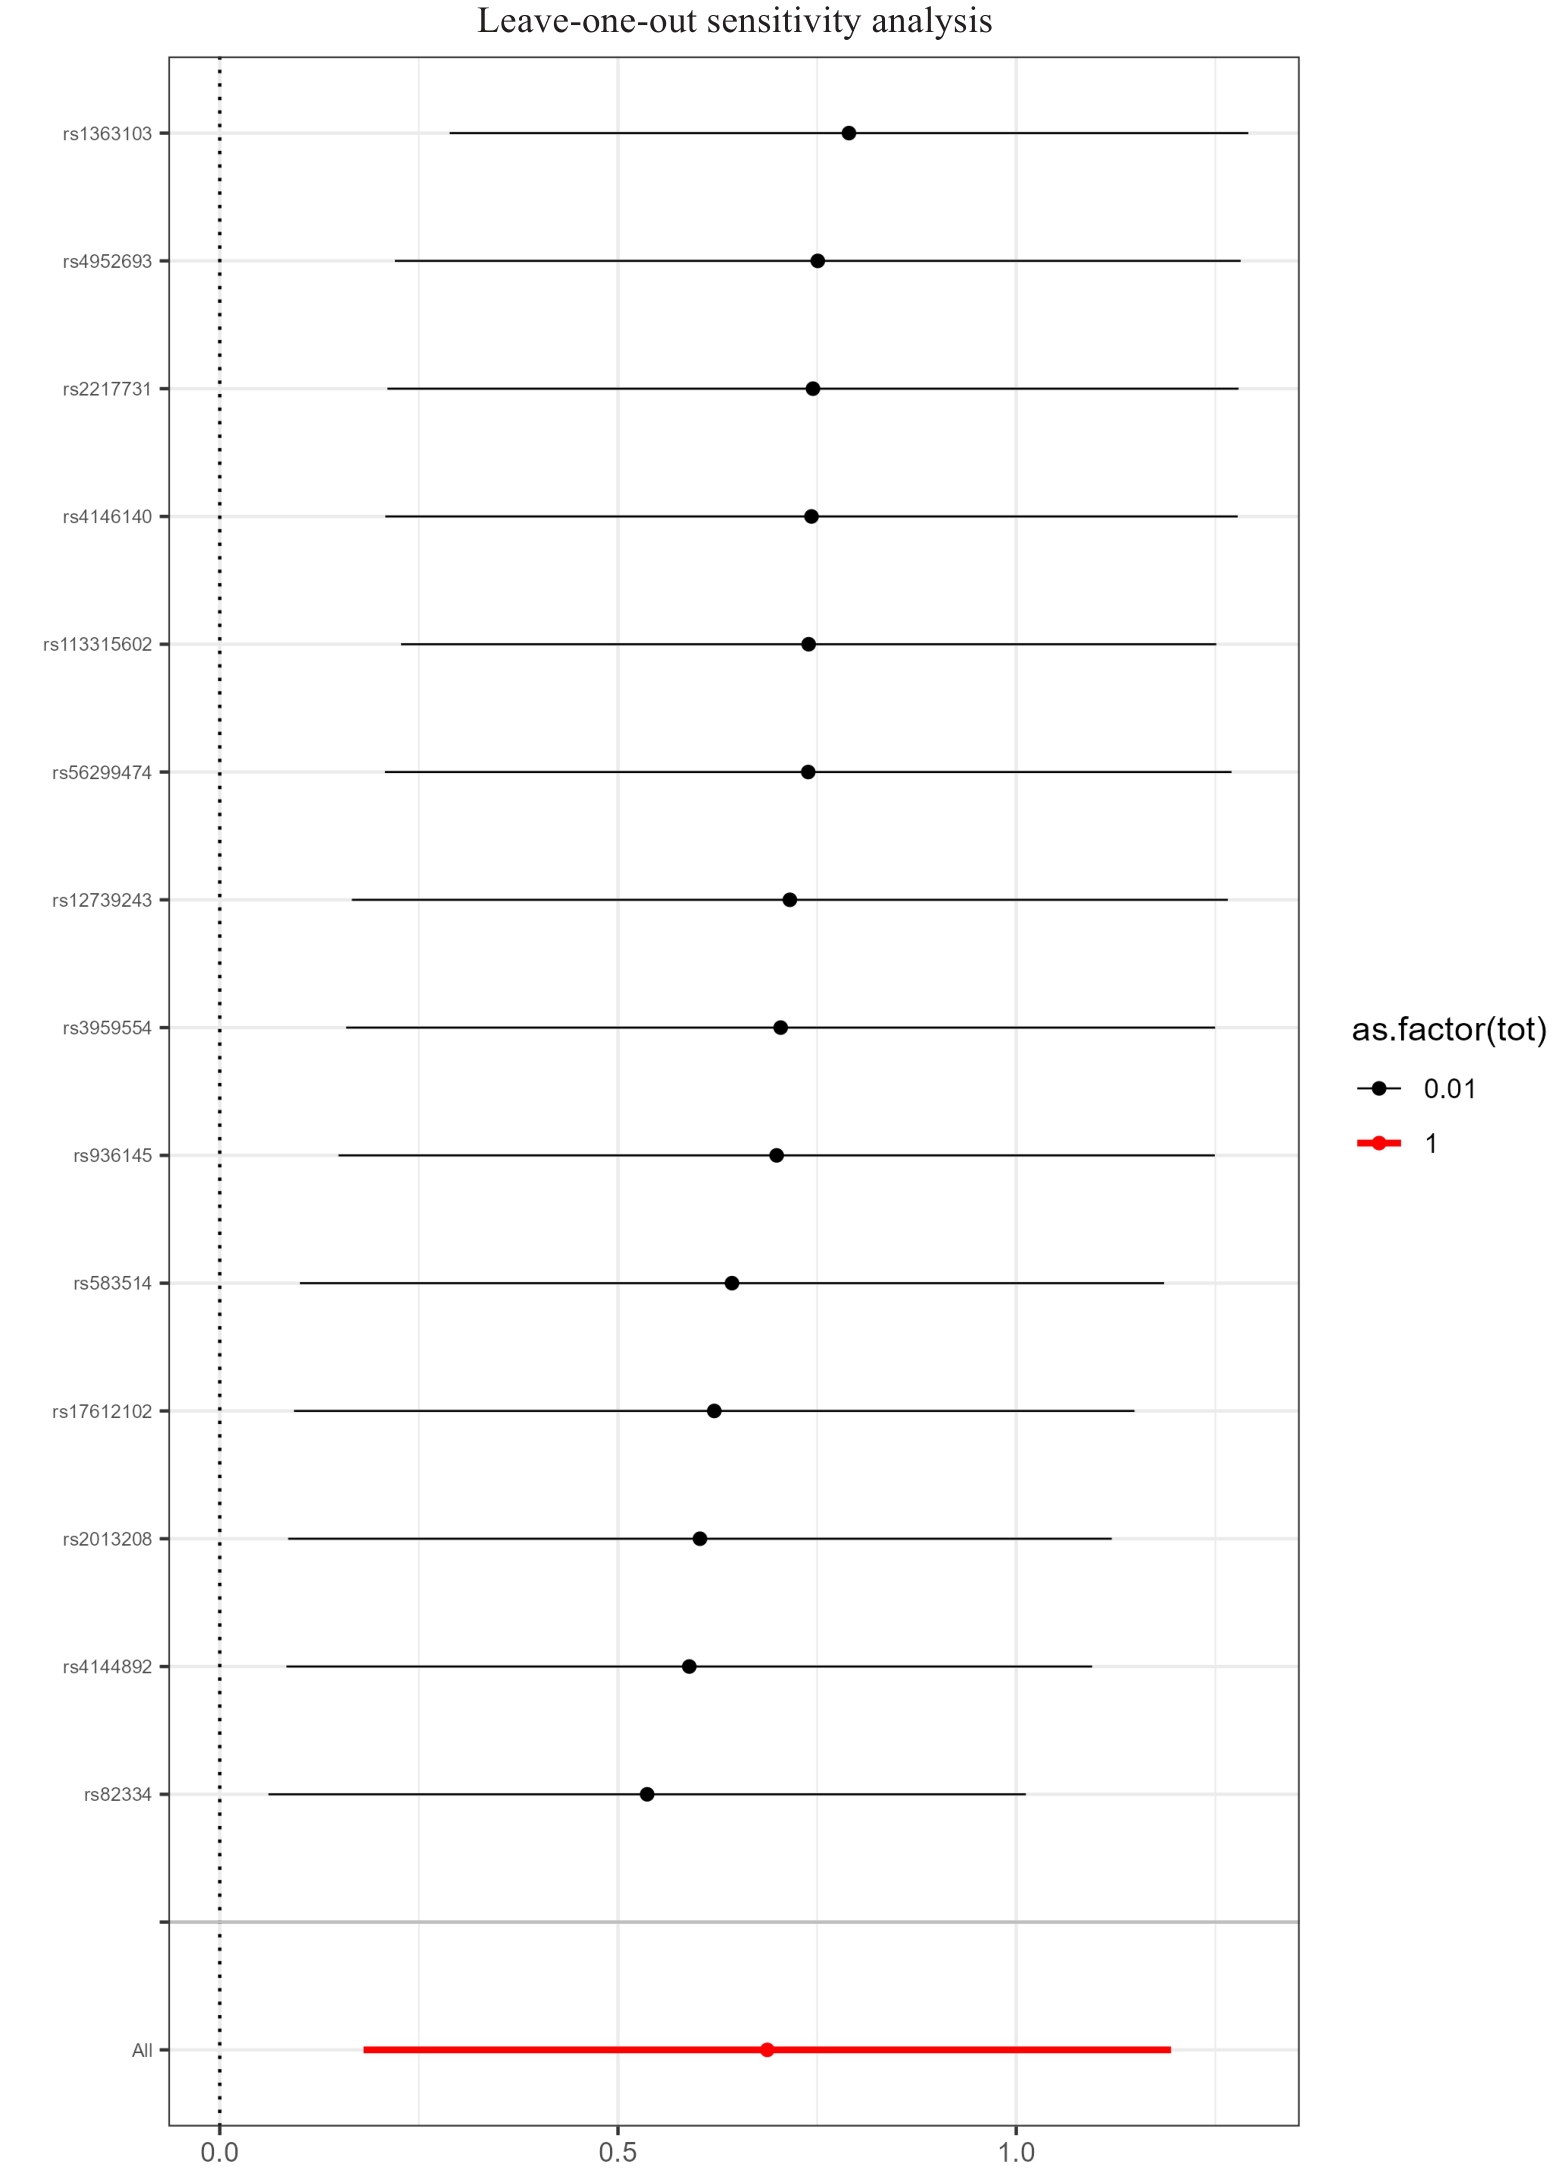
图8 孟德尔随机化留一法敏感性分析: 衰弱指数
Fig.8 Leave-one-out sensitivity analysis of Mendelian randomization: Frailty index.
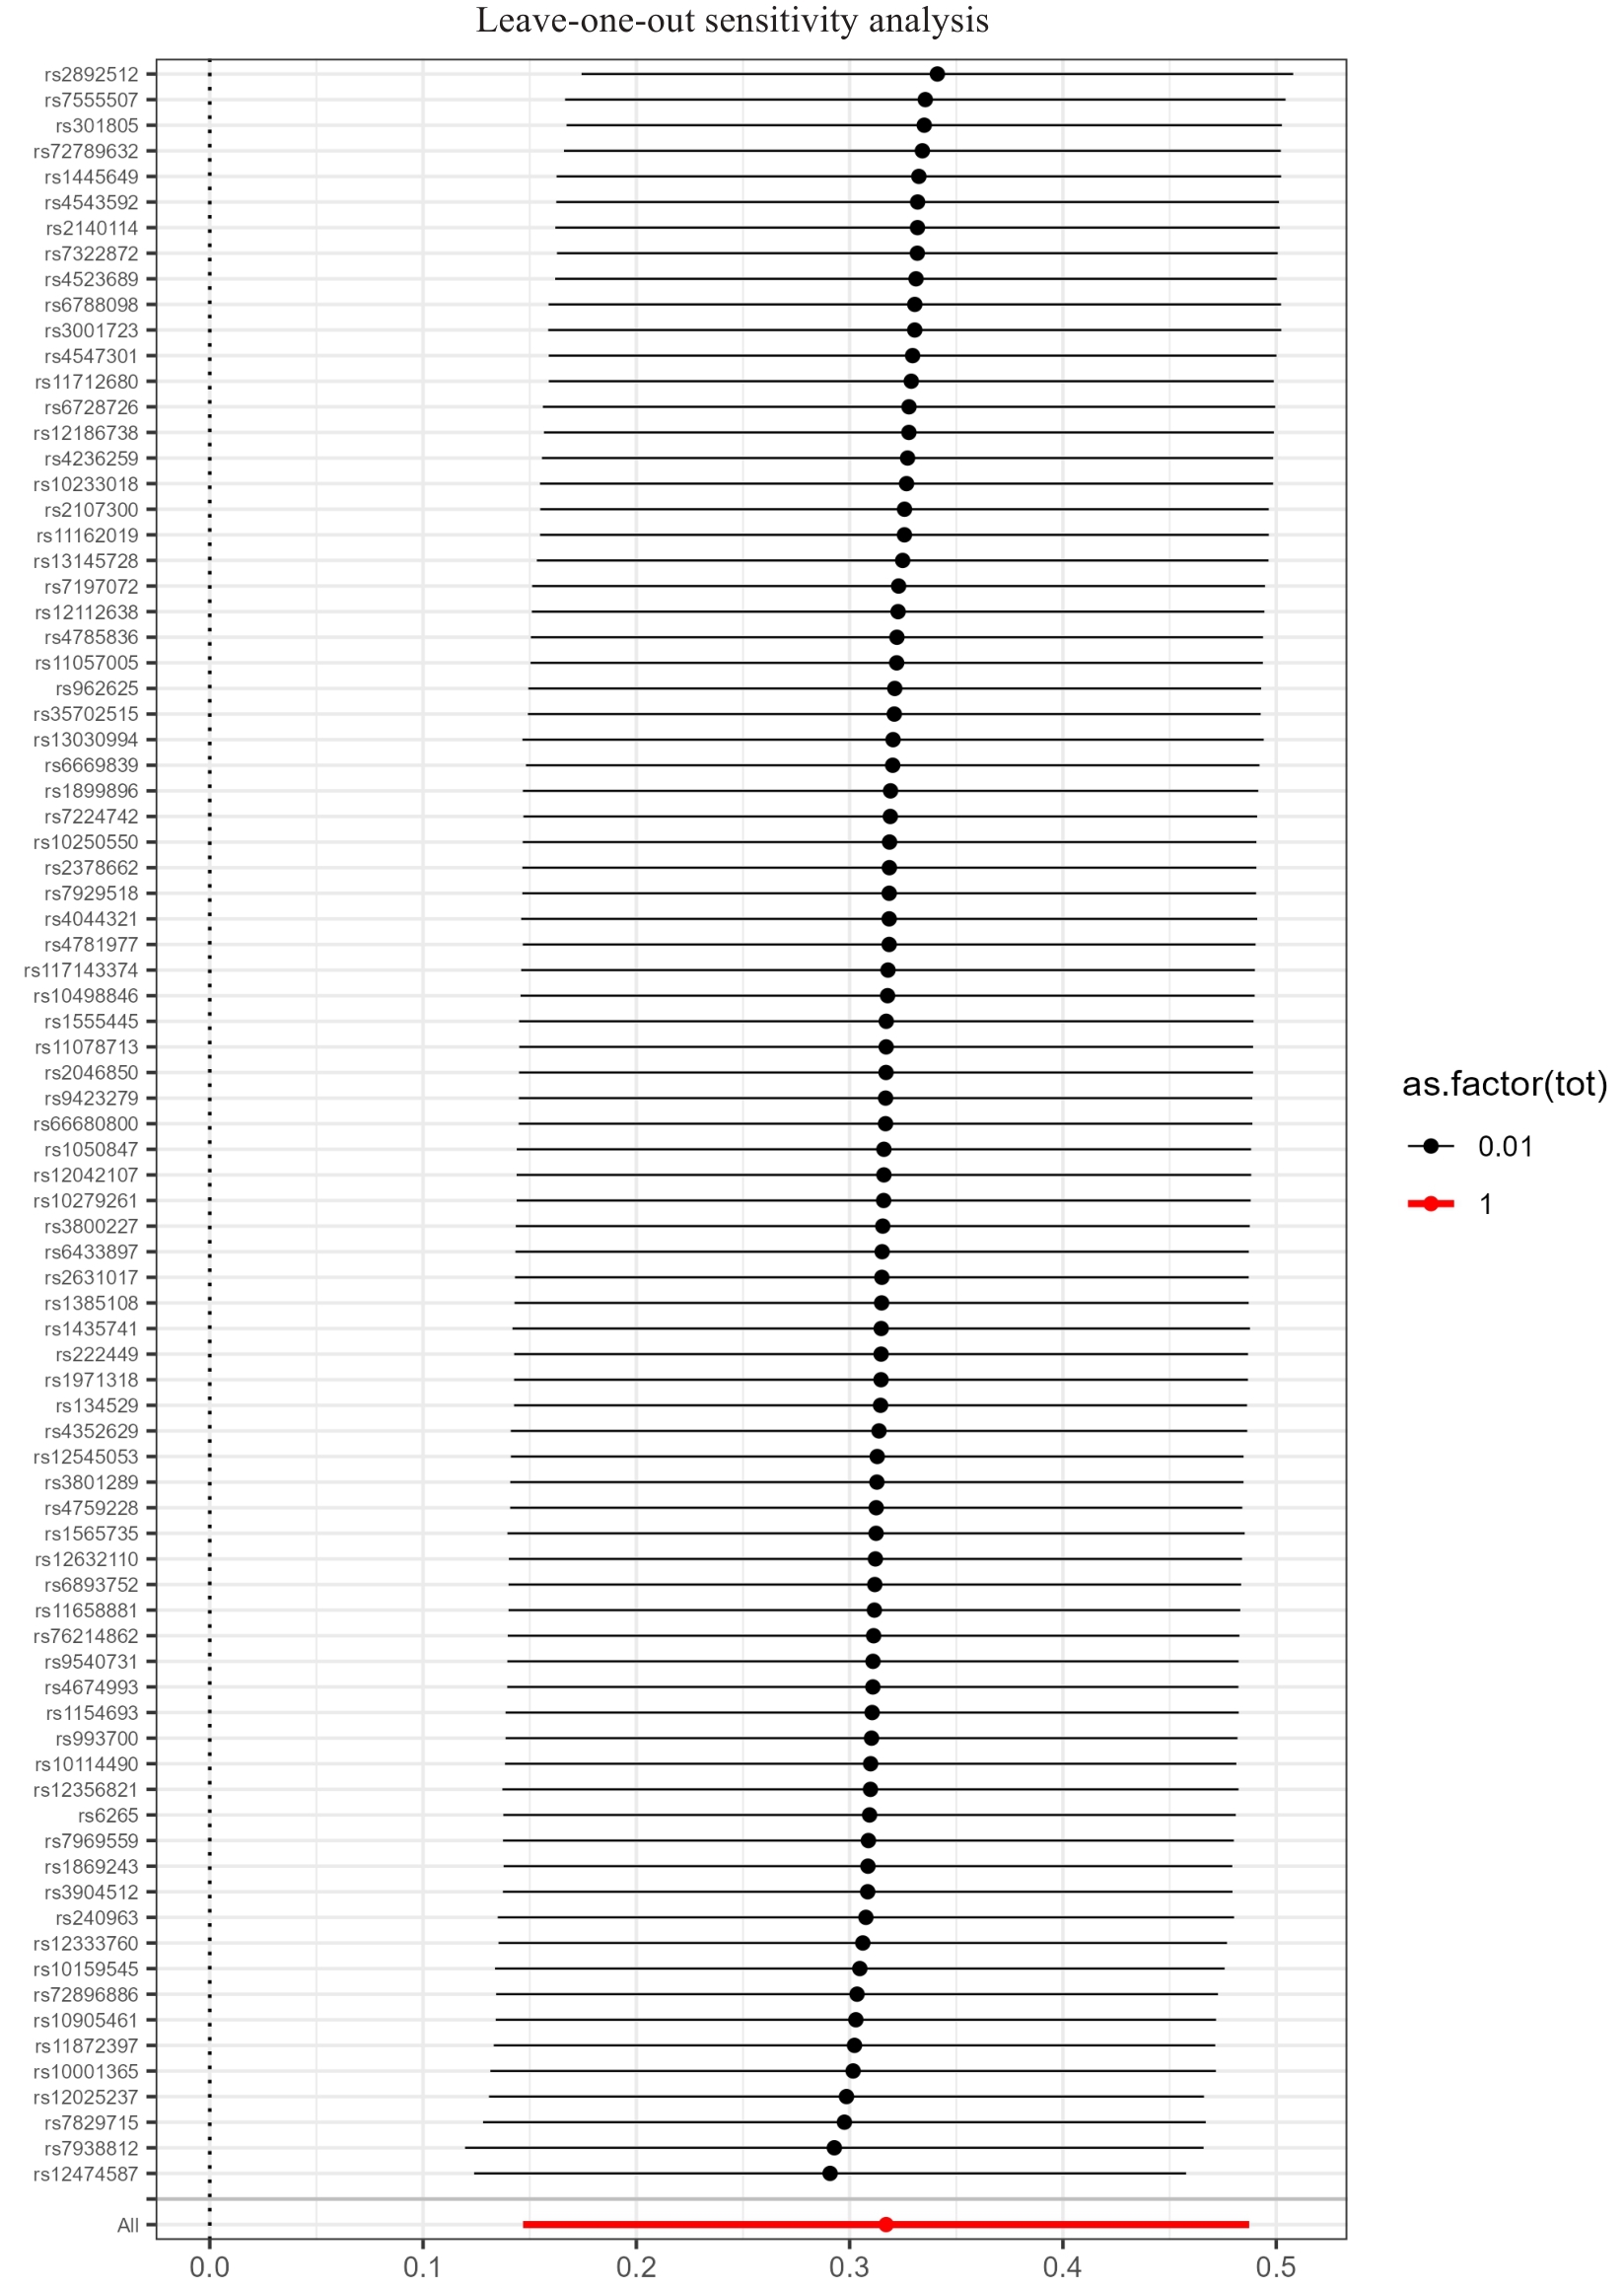
图9 孟德尔随机化留一法敏感性分析: 吸烟起始
Fig.9 Leave-one-out sensitivity analysis of Mendelian randomization: smoking initiation.
| [1] | Younossi ZM, Koenig AB, Abdelatif D, et al. Global epidemiology of nonalcoholic fatty liver disease-Meta-analytic assessment of prevalence, incidence, and outcomes[J]. Hepatology, 2016, 64(1): 73-84. doi:10.1002/hep.28431 |
| [2] | Rinella ME, Lazarus JV, Ratziu V, et al. A multisociety Delphi consensus statement on new fatty liver disease nomenclature[J]. Hepatology, 2023, 78(6): 1966-86. doi:10.1097/HEP.0000000000000696 |
| [3] | Paik JM, Golabi P, Younossi Y, et al. The growing burden of disability related to nonalcoholic fatty liver disease: data from the global burden of disease 2007-2017[J]. Hepatol Commun, 2020, 4(12): 1769-80. doi:10.1002/hep4.1599 |
| [4] | Lazarus JV, Mark HE, Anstee QM, et al. Advancing the global public health agenda for NAFLD: a consensus statement[J]. Nat Rev Gastroenterol Hepatol, 2022, 19(1): 60-78. |
| [5] | Deo RC. Machine learning in medicine[J]. Circulation, 2015, 132(20): 1920-30. doi:10.1161/circulationaha.115.001593 |
| [6] | Younossi ZM. Non-alcoholic fatty liver disease-A global public health perspective[J]. J Hepatol, 2019, 70(3): 531-44. doi:10.1016/j.jhep.2018.10.033 |
| [7] | Bertolotti M, Lonardo A, Mussi C, et al. Nonalcoholic fatty liver disease and aging: epidemiology to management[J]. World J Gastroenterol, 2014, 20(39): 14185-204. doi:10.3748/wjg.v20.i39.14185 |
| [8] | Liu Y, Dai M, Bi YF, et al. Active smoking, passive smoking, and risk of nonalcoholic fatty liver disease (NAFLD): a population-based study in China[J]. J Epidemiol, 2013, 23(2): 115-21. doi:10.2188/jea.je20120067 |
| [9] | GBD 2021 Diseases and Injuries Collaborators. Global incidence, prevalence, years lived with disability (YLDs), disability-adjusted life-years (DALYs), and healthy life expectancy (HALE) for 371 diseases and injuries in 204 countries and territories and 811 subnational locations, 1990-2021: a systematic analysis for the Global Burden of Disease Study 2021[J]. Lancet, 2024, 403(10440): 2133-61. |
| [10] | Kim HJ, Fay MP, Feuer EJ, et al. Permutation tests for joinpoint regression with applications to cancer rates[J]. Stat Med, 2000, 19(3): 335-51. doi:10.1002/(sici)1097-0258(20000215)19:3<335::aid-sim336>3.3.co;2-q |
| [11] | Das Gupta P. Standardization and decomposition of rates: a user's manual[M]. Washington, DC: US Bureau of the Census; 1993. |
| [12] | Wagstaff A, Paci P, van Doorslaer E. On the measurement of inequalities in health[J]. Soc Sci Med, 1991, 33(5): 545-57. doi:10.1016/0277-9536(91)90212-u |
| [13] | Chen TQ, Guestrin C. XGBoost: a scalable tree boosting system[C]//Proceedings of the 22nd ACM SIGKDD International Conference on Knowledge Discovery and Data Mining. San Francisco California USA. ACM, 2016: 785-794. doi:10.1145/2939672.2939785 |
| [14] | Lundberg SM, Lee SI. A unified approach to interpreting model predictions[C]//Neural Information Processing Systems., 2017 |
| [15] | Younossi ZM, Stepanova M, Younossi Y, et al. Epidemiology of chronic liver diseases in the USA in the past three decades[J]. Gut, 2020, 69(3): 564-8. doi:10.1136/gutjnl-2019-318813 |
| [16] | Powell EE, Wong VW, Rinella M. Non-alcoholic fatty liver disease[J]. Lancet, 2021, 397(10290): 2212-24. doi:10.1016/s0140-6736(20)32511-3 |
| [17] | Lonardo A, Nascimbeni F, Maurantonio M, et al. Nonalcoholic fatty liver disease: Evolving paradigms[J]. World J Gastroenterol, 2017, 23(36): 6571-92. doi:10.3748/wjg.v23.i36.6571 |
| [18] | Ballestri S, Nascimbeni F, Baldelli E, et al. NAFLD as a sexual dimorphic disease: role of gender and reproductive status in the development and progression of nonalcoholic fatty liver disease and inherent cardiovascular risk[J]. Adv Ther, 2017, 34(6): 1291-326. doi:10.1007/s12325-017-0556-1 |
| [19] | Estes C, Razavi H, Loomba R, et al. Modeling the epidemic of nonalcoholic fatty liver disease demonstrates an exponential increase in burden of disease[J]. Hepatology, 2018, 67(1): 123-33. doi:10.1002/hep.29466 |
| [20] | GBD 2019 Demographics Collaborators. Global age-sex-specific fertility, mortality, healthy life expectancy (HALE), and population estimates in 204 countries and territories, 1950-2019: a comprehensive demographic analysis for the Global Burden of Disease Study 2019[J]. Lancet, 2020, 396(10258): 1160-203. doi:10.1016/S0140-6736(20)30977-6 |
| [21] | Marmot M, Allen J, Bell R, et al. WHO European review of social determinants of health and the health divide[J]. Lancet, 2012, 380(9846): 1011-29. doi:10.1016/s0140-6736(12)61228-8 |
| [22] | Wong VW, Ekstedt M, Wong GL, et al. Changing epidemiology, global trends and implications for outcomes of NAFLD[J]. J Hepatol, 2023, 79(3): 842-52. doi:10.1016/j.jhep.2023.04.036 |
| [23] | Allen LN, Smith RW, Simmons-Jones F, et al. Addressing social determinants of noncommunicable diseases in primary care: a systematic review[J]. Bull World Health Organ, 2020, 98(11): 754-65B. doi:10.1093/eurpub/ckaa165.1131 |
| [24] | Singal AG, Li XL, Tiro J, et al. Racial, social, and clinical determinants of hepatocellular carcinoma surveillance[J]. Am J Med, 2015, 128(1): 90.e1-7. doi:10.1016/j.amjmed.2014.07.027 |
| [25] | Loomba R, Friedman SL, Shulman GI. Mechanisms and disease consequences of nonalcoholic fatty liver disease[J]. Cell, 2021, 184(10): 2537-64. doi:10.1016/j.cell.2021.04.015 |
| [26] | Obermeyer Z, Emanuel EJ. Predicting the future - big data, machine learning, and clinical medicine[J]. N Engl J Med, 2016, 375(13): 1216-9. doi:10.1056/NEJMp1606181 |
| [27] | Azzalini L, Ferrer E, Ramalho LN, et al. Cigarette smoking exacerbates nonalcoholic fatty liver disease in obese rats[J]. Hepatology, 2010, 51(5): 1567-76. doi:10.1002/hep.23516 |
| [28] | Polyzos SA, Kountouras J, Mantzoros CS. Obesity and nonalcoholic fatty liver disease: From pathophysiology to therapeutics[J]. Metabolism, 2019, 92: 82-97. doi:10.1016/j.metabol.2018.11.014 |
| [29] | Xu JT, Li YF, Feng ZX, et al. Cigarette smoke contributes to the progression of MASLD: from the molecular mechanisms to therapy[J]. Cells, 2025, 14(3): 221. doi:10.3390/cells14030221 |
| [30] | Dulai PS, Singh S, Patel J, et al. Increased risk of mortality by fibrosis stage in nonalcoholic fatty liver disease: Systematic review and meta-analysis[J]. Hepatology, 2017, 65(5): 1557-65. doi:10.1002/hep.29085 |
| [31] | Chalasani N, Younossi Z, Lavine JE, et al. The diagnosis and management of nonalcoholic fatty liver disease: Practice guidance from the American Association for the Study of Liver Diseases[J]. Hepatology, 2018, 67(1): 328-57. doi:10.1002/hep.29367 |
| [32] | Tapper EB, Lai M. Weight loss results in significant improvements in quality of life for patients with nonalcoholic fatty liver disease: a prospective cohort study[J]. Hepatology, 2016, 63(4): 1184-9. doi:10.1002/hep.28416 |
| [33] | Maier S, Wieland A, Cree-Green M, et al. Lean NAFLD: an underrecognized and challenging disorder in medicine[J]. Rev Endocr Metab Disord, 2021, 22(2): 351-66. doi:10.1007/s11154-020-09621-1 |
| [34] | Hagström H, Nasr P, Ekstedt M, et al. Cardiovascular risk factors in non-alcoholic fatty liver disease[J]. Liver Int, 2019, 39(1): 197-204. doi:10.1111/liv.13973 |
| [35] | Hastie T, Tibshirani R, Friedman J. The Elements of Statistical Learning[M]. New York, NY: Springer New York, 2009. doi:10.1007/978-0-387-84858-7 |
| [36] | GBD 2021 Demographics Collaborators. Global burden of 288 causes of death and life expectancy decomposition in 204 countries and territories and 811 subnational locations, 1990-2021: a systematic analysis for the Global Burden of Disease Study 2021[J]. Lancet, 2024, 403(10440): 2100-32. doi:10.1016/S0140-6736(24)00367-2 |
| [37] | Le MH, Yeo YH, Li XH, et al. 2019 global NAFLD prevalence: a systematic review and meta-analysis[J]. Clin Gastroenterol Hepatol, 2022, 20(12): 2809-17.e28. doi:10.1016/j.cgh.2021.12.002 |
| [38] | Rinella ME, Neuschwander-Tetri BA, Siddiqui MS, et al. AASLD Practice Guidance on the clinical assessment and management of nonalcoholic fatty liver disease[J]. Hepatology, 2023, 77(5): 1797-835. doi:10.1097/hep.0000000000000323 |
| [39] | Younossi ZM, Golabi P, Paik JM, et al. The global epidemiology of nonalcoholic fatty liver disease (NAFLD) and nonalcoholic steatohepatitis (NASH): a systematic review[J]. Hepatology, 2023, 77(4): 1335-47. doi:10.1097/hep.0000000000000004 |
| [40] | Angulo P, Kleiner DE, Dam-Larsen S, et al. Liver fibrosis, but No other histologic features, is associated with long-term outcomes of patients with nonalcoholic fatty liver disease[J]. Gastroenterology, 2015, 149(2): 389-97.e10. doi:10.1053/j.gastro.2015.04.043 |
| [41] | Kanwal F, Shubrook JH, Adams LA, et al. Clinical care pathway for the risk stratification and management of patients with nonalcoholic fatty liver disease[J]. Gastroenterology, 2021, 161(5): 1657-69. doi:10.1053/j.gastro.2021.07.049 |
| [42] | Romero-Gómez M, Zelber-Sagi S, Trenell M. Treatment of NAFLD with diet, physical activity and exercise[J]. J Hepatol, 2017, 67(4): 829-46. doi:10.1016/j.jhep.2017.05.016 |
| [43] | European Association for the Study of the Liver, European Association for the Study of Diabetes, European Association for the Study of Obesity. EASL-EASD-EASO Clinical Practice Guidelines for the management of non-alcoholic fatty liver disease[J]. Diabetologia, 2016, 59(6): 1121-40. doi:10.1007/s00125-016-3902-y |
| [44] | Hardy T, Oakley F, Anstee QM, et al. Nonalcoholic fatty liver disease: pathogenesis and disease spectrum[J]. Annu Rev Pathol, 2016, 11: 451-96. doi:10.1146/annurev-pathol-012615-044224 |
| [45] | Sanyal AJ. Past, present and future perspectives in nonalcoholic fatty liver disease[J]. Nat Rev Gastroenterol Hepatol, 2019, 16(6): 377-86. doi:10.1038/s41575-019-0144-8 |
| [1] | 陶红成, 梁富凯, 黄文波, 范思奇, 曾平. 酒精暴露与股骨头坏死的潜在关联:基于机器学习构建诊断模型[J]. 南方医科大学学报, 2026, 46(3): 559-569. |
| [2] | 向科霖, 章晓云, 黎征鹏, 徐志为, 刘素杰, 柴源. 胞葬相关基因UCP2、EGLN3、IL1B对骨关节炎的诊断价值及中药治疗预测:基于生物信息学及机器学习[J]. 南方医科大学学报, 2026, 46(3): 693-706. |
| [3] | 陈梅妹, 黄睿娜, 杨朝阳. 血浆代谢物介导炎症蛋白对阿尔茨海默病的因果效应:一项孟德尔随机化分析研究[J]. 南方医科大学学报, 2026, 46(2): 278-285. |
| [4] | 陈君尧, 陈泽宇, 林钊杰, 方梦浩, 沈超英, 许琦, 张晓怡, 卢鲁. 饮茶对胃肠道疾病风险的双重作用:基于可解释机器学习与大语言模型的联合预测辅助模型[J]. 南方医科大学学报, 2026, 46(2): 353-361. |
| [5] | 崔运能, 冯敏清, 姚亮凤, 严杰文, 李闻瀚, 黄燕平. 基于欠采样的影像组学机器学习模型术前预测子宫肌瘤高强度聚焦超声消融效果[J]. 南方医科大学学报, 2026, 46(1): 141-149. |
| [6] | 骆碧云, 易欣, 蔡怡静, 张世卿, 王鹏, 李彤, 翁建霖, 周平正. 清心牛黄丸通过改善脂质代谢紊乱缓解小鼠非酒精性脂肪性肝病[J]. 南方医科大学学报, 2025, 45(9): 1840-1849. |
| [7] | 黄启智, 谢戴鹏, 姚霖彤, 李洽轩, 吴少伟, 周海榆. 肿瘤微环境特异性CT影像组学标签预测非小细胞肺癌免疫治疗疗效[J]. 南方医科大学学报, 2025, 45(9): 1903-1918. |
| [8] | 姜君, 封硕, 孙银贵, 安燕. 经尿道前列腺钬激光剜除术后低体温风险预测模型:基于逻辑回归、决策树和支持向量机[J]. 南方医科大学学报, 2025, 45(9): 2019-2025. |
| [9] | 陈梅妹, 王洋, 雷黄伟, 张斐, 黄睿娜, 杨朝阳. 基于多种机器学习算法和语音情绪特征的阈下抑郁辨识模型构建[J]. 南方医科大学学报, 2025, 45(4): 711-717. |
| [10] | 李文婕, 洪耀南, 黄蕊, 李煜宸, 张莹, 张蕴, 吴迪炯. 自身免疫性疾病是再生障碍性贫血的危险因素:一项孟德尔随机化分析[J]. 南方医科大学学报, 2025, 45(4): 871-879. |
| [11] | 高俊杰, 叶开, 吴竞. 槲皮素通过调控TP53基因抑制肾透明细胞癌的增殖和迁移[J]. 南方医科大学学报, 2025, 45(2): 313-321. |
| [12] | 尚读, 李雯, 崔立华, 陈明. 护肝汤通过激活AMPK/m-TOR信号通路减少脂质合成减轻大鼠非酒精性脂肪性肝病[J]. 南方医科大学学报, 2025, 45(12): 2667-2678. |
| [13] | 喻珍妮, 高竟哲, 孙惠, 冯芹, 那效旗, 张宁, 沈昆双, 王媛媛, 王喜军. 肠道菌群、T细胞在结直肠癌发病中的因果关联:孟德尔随机化分析[J]. 南方医科大学学报, 2025, 45(12): 2756-2766. |
| [14] | 潘兴旭, 张秉祺, 张智华, 曹秋实. 戈登杆菌属丰度降低与肾结石风险增加相关:一项孟德尔随机化分析与动物实验研究[J]. 南方医科大学学报, 2025, 45(11): 2405-2415. |
| [15] | 马会华, 闫奎坡, 刘刚, 徐亚洲, 张磊, 李一卓. 1990~2021年心房颤动/扑动流行病学及其危险因素分析:基于2021年中国全球疾病负担研究与孟德尔随机化研究的系统分析[J]. 南方医科大学学报, 2025, 45(10): 2182-2190. |
| 阅读次数 | ||||||
|
全文 |
|
|||||
|
摘要 |
|
|||||