南方医科大学学报 ›› 2024, Vol. 44 ›› Issue (9): 1738-1751.doi: 10.12122/j.issn.1673-4254.2024.09.14
方威扬1,2( ), 肖慧1, 王爽2, 林晓明2(), 陈超敏1()
收稿日期:2024-06-06
出版日期:2024-09-20
发布日期:2024-09-30
通讯作者:
林晓明,陈超敏
E-mail:506486730@qq.com;xiaominglin@gidichina.org;15773839131@163.com
作者简介:方威扬,在读硕士研究生,E-mail: 506486730@qq.com
基金资助:
Weiyang FANG1,2(), Hui XIAO1, Shuang WANG2, Xiaoming LIN2(), Chaomin CHEN1()
Received:2024-06-06
Online:2024-09-20
Published:2024-09-30
Contact:
Xiaoming LIN, Chaomin CHEN
E-mail:506486730@qq.com;xiaominglin@gidichina.org;15773839131@163.com
摘要:
目的 探索并建立深度学习模型,验证MRI影像深度学习特征结合临床显著性特征在术前预测肝细胞癌(HCC)的细胞角蛋白19(CK19)状态上的可行性。 方法 收集116例已证实CK19状态的HCC患者数据进行回顾性实验。基于增强MRI影像的肝胆期(HBP)和扩散加权成像(DWI)序列,以及统计学分析筛选的与CK19状态显著相关的临床参数特征,建立了单序列多尺度特征融合模型(MSFF-IResnet)和多尺度多模态特征融合模型(MMFF-IResnet)。通过模型间的分类性能对比评估,突出深度学习模型对于术前预测HCC的CK19状态的有效性。 结果 多变量分析显示,升高的NLR值(P=0.029)和不完整的肿瘤包膜(P=0.028)是CK19表达的独立预测因子。多尺度特征融合和多模态特征融合方法改进后的深度学习模型均取得了优于传统机器学习模型和基线模型的分类结果,且最终的MMFF-IResnet表现出最佳的分类性能,其AUC为84.2%、准确度为80.6%,敏感度为80.1%,特异度为81.2%。 结论 本研究建立的基于MRI影像和临床参数的多尺度和多模态特征融合模型成功预测了HCC的CK19状态,验证了深度学习方法结合MRI影像和临床参数在术前预测CK19状态上的可行性。
方威扬, 肖慧, 王爽, 林晓明, 陈超敏. 基于MRI影像和临床参数特征融合的深度学习模型预测术前肝细胞癌的细胞角蛋白19状态[J]. 南方医科大学学报, 2024, 44(9): 1738-1751.
Weiyang FANG, Hui XIAO, Shuang WANG, Xiaoming LIN, Chaomin CHEN. A deep learning model based on magnetic resonance imaging and clinical feature fusion for predicting preoperative cytokeratin 19 status in hepatocellular carcinoma[J]. Journal of Southern Medical University, 2024, 44(9): 1738-1751.
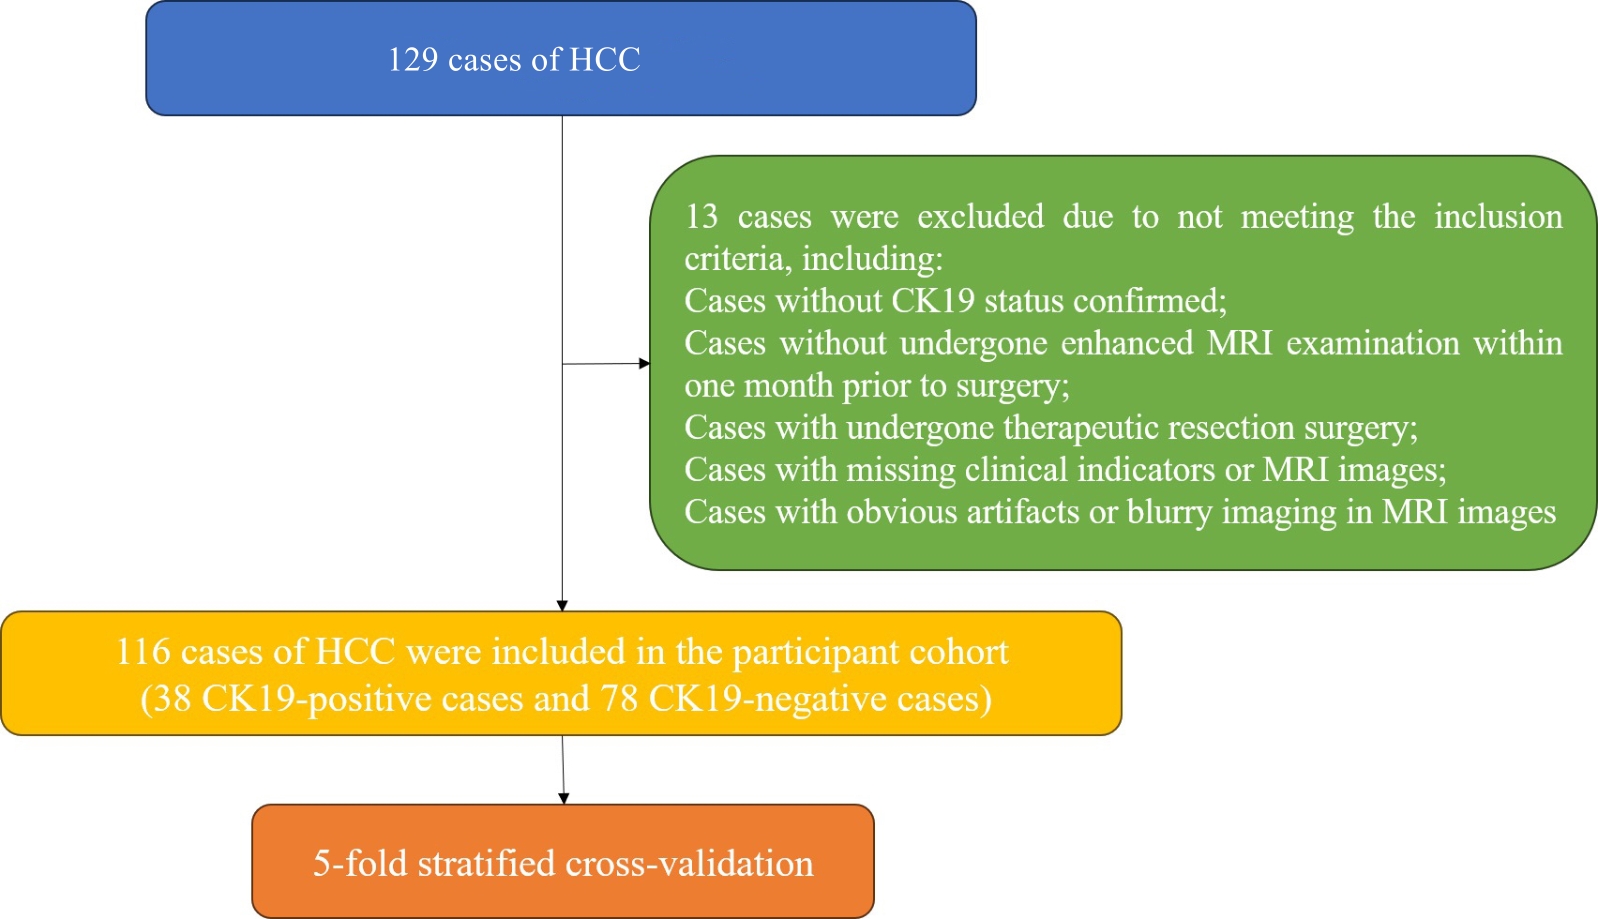
图1 病例排除和纳入情况
Fig.1 Exclusion and inclusion of the cases.
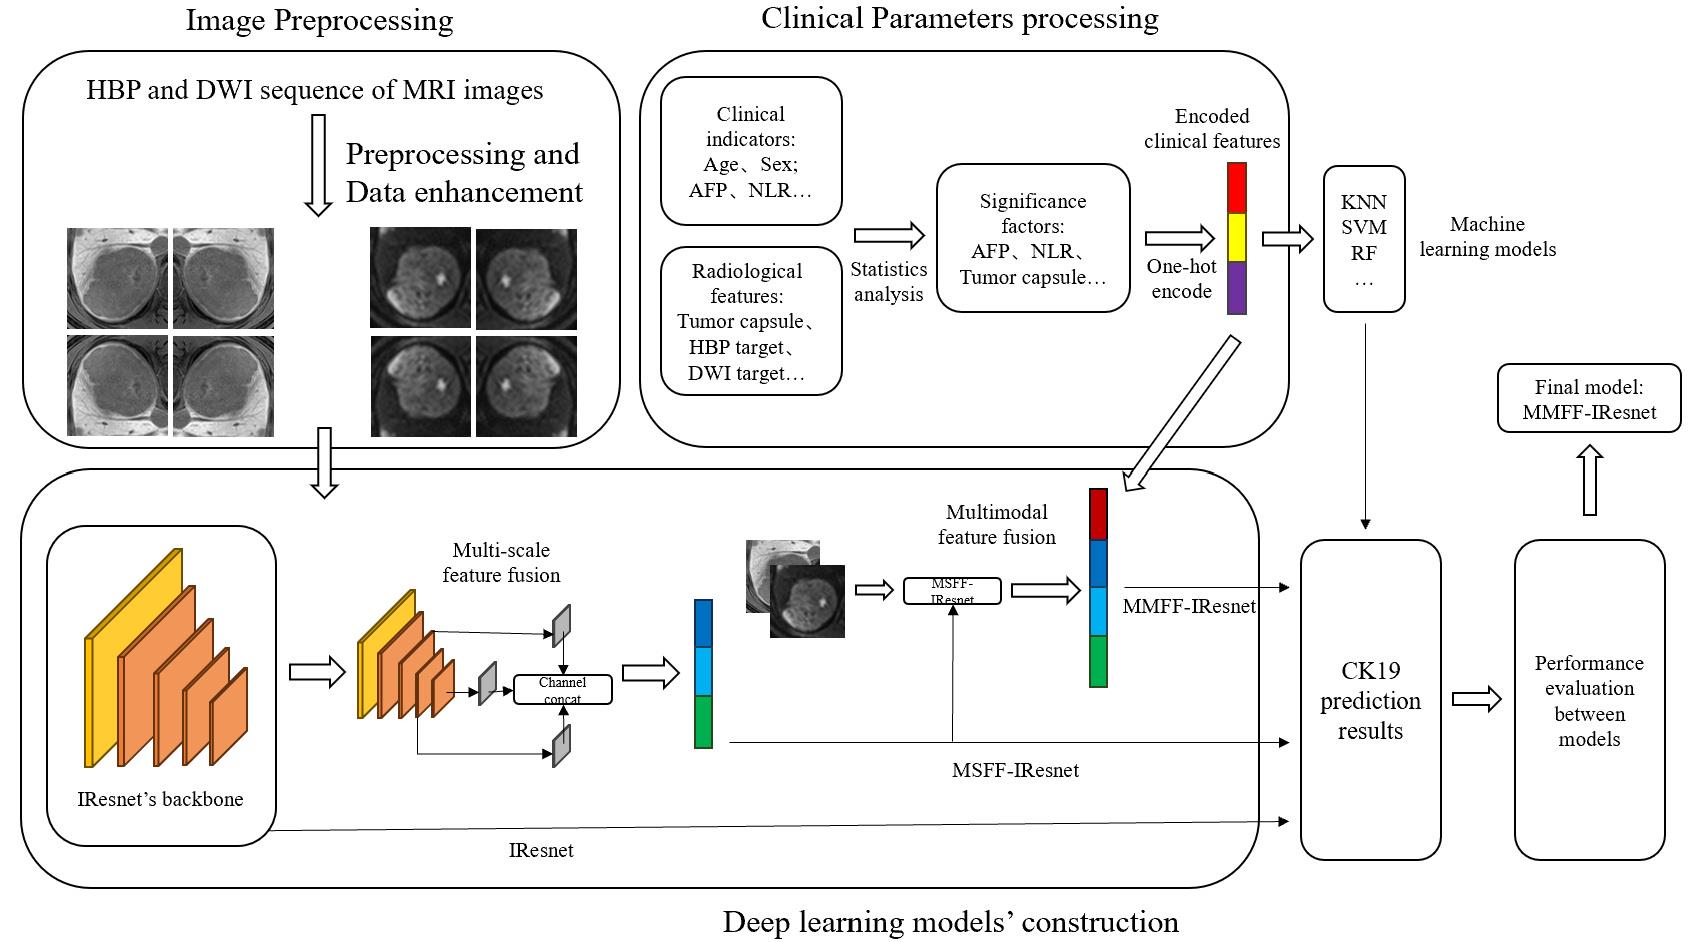
图2 技术框架
Fig.2 Technical framework of the multi-scale and multi-modality feature fusion model. IResnet: The baseline model. MSFF-IResnet: The multi-scale feature fusion model based on IResnet and multi-scale feature fusion methods. MMFF-IResnet: The multi-scale and multi-modality feature fusion model based on MSFF-IResnet and multi-modality data.
| Item | CK19- cases | CK19+ cases | Number before augmentation | Number after augmentation |
|---|---|---|---|---|
| HBP sequence | ||||
| Training group | 62 | 30 | 740 | 3000 |
| Validation group | 16 | 8 | 190 | 190 |
| DWI sequence | ||||
| Training group | 62 | 30 | 710 | 3000 |
| Validation group | 16 | 8 | 180 | 180 |
表1 数据增强前后的MRI样本数量信息
Tab.1 Number of MRI samples before and after data augmentation
| Item | CK19- cases | CK19+ cases | Number before augmentation | Number after augmentation |
|---|---|---|---|---|
| HBP sequence | ||||
| Training group | 62 | 30 | 740 | 3000 |
| Validation group | 16 | 8 | 190 | 190 |
| DWI sequence | ||||
| Training group | 62 | 30 | 710 | 3000 |
| Validation group | 16 | 8 | 180 | 180 |
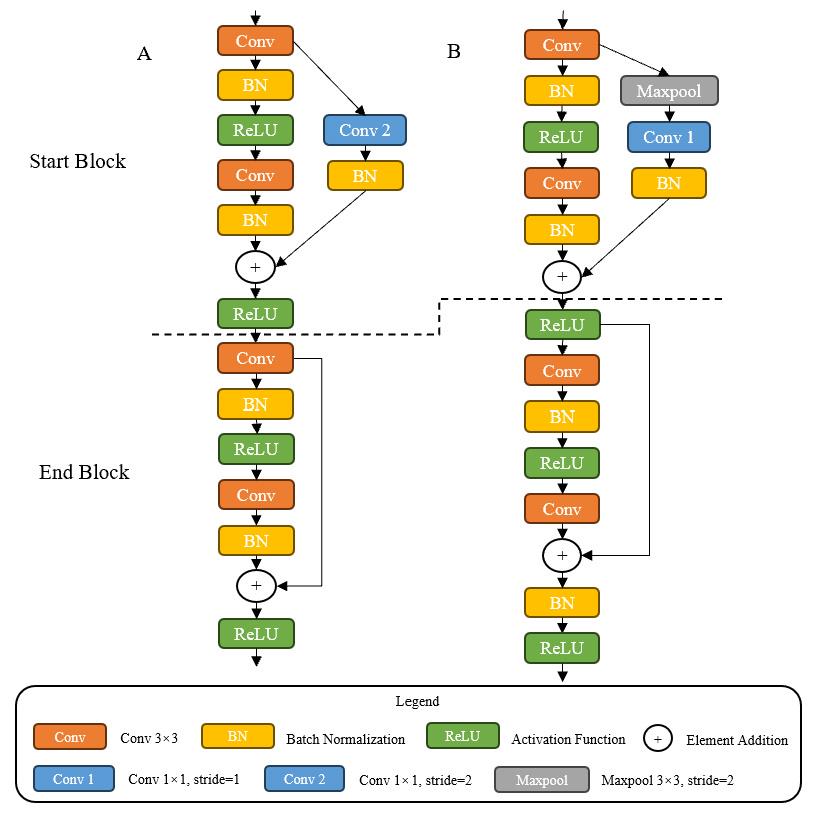
图3 残差块对比
Fig.3 Comparison of residual blocks. A: Residual blocks of Resnet. B: Residual blocks of IResnet18. Start Block is the first block and End Block the last block in residual blocks.
| Input | Operator | Stride | Output |
|---|---|---|---|
| 1×224×224 | Conv2d 7×7 | 2 | 32×112×112 |
| 32×112×112 | Maxpool2d 2×2 | 32×56×56 | |
| 32×56×56 | Ires Stage1 (Ires block ×2) | 1 | 32×56×56 |
| 32×56×56 | Ires Stage2 (Ires block ×2) | 2 | 64×28×28 |
| 64×28×28 | Ires Stage3 (Ires block ×2) | 2 | 128×14×14 |
| 128×14×14 | Ires Stage4 (Ires block ×2) | 2 | 256×7×7 |
| 256×7×7 | GAP 1×1 | 256 | |
| 256 | FC | 2 |
表2 IResnet18的网络架构
Tab.2 Network architecture of IResnet18
| Input | Operator | Stride | Output |
|---|---|---|---|
| 1×224×224 | Conv2d 7×7 | 2 | 32×112×112 |
| 32×112×112 | Maxpool2d 2×2 | 32×56×56 | |
| 32×56×56 | Ires Stage1 (Ires block ×2) | 1 | 32×56×56 |
| 32×56×56 | Ires Stage2 (Ires block ×2) | 2 | 64×28×28 |
| 64×28×28 | Ires Stage3 (Ires block ×2) | 2 | 128×14×14 |
| 128×14×14 | Ires Stage4 (Ires block ×2) | 2 | 256×7×7 |
| 256×7×7 | GAP 1×1 | 256 | |
| 256 | FC | 2 |
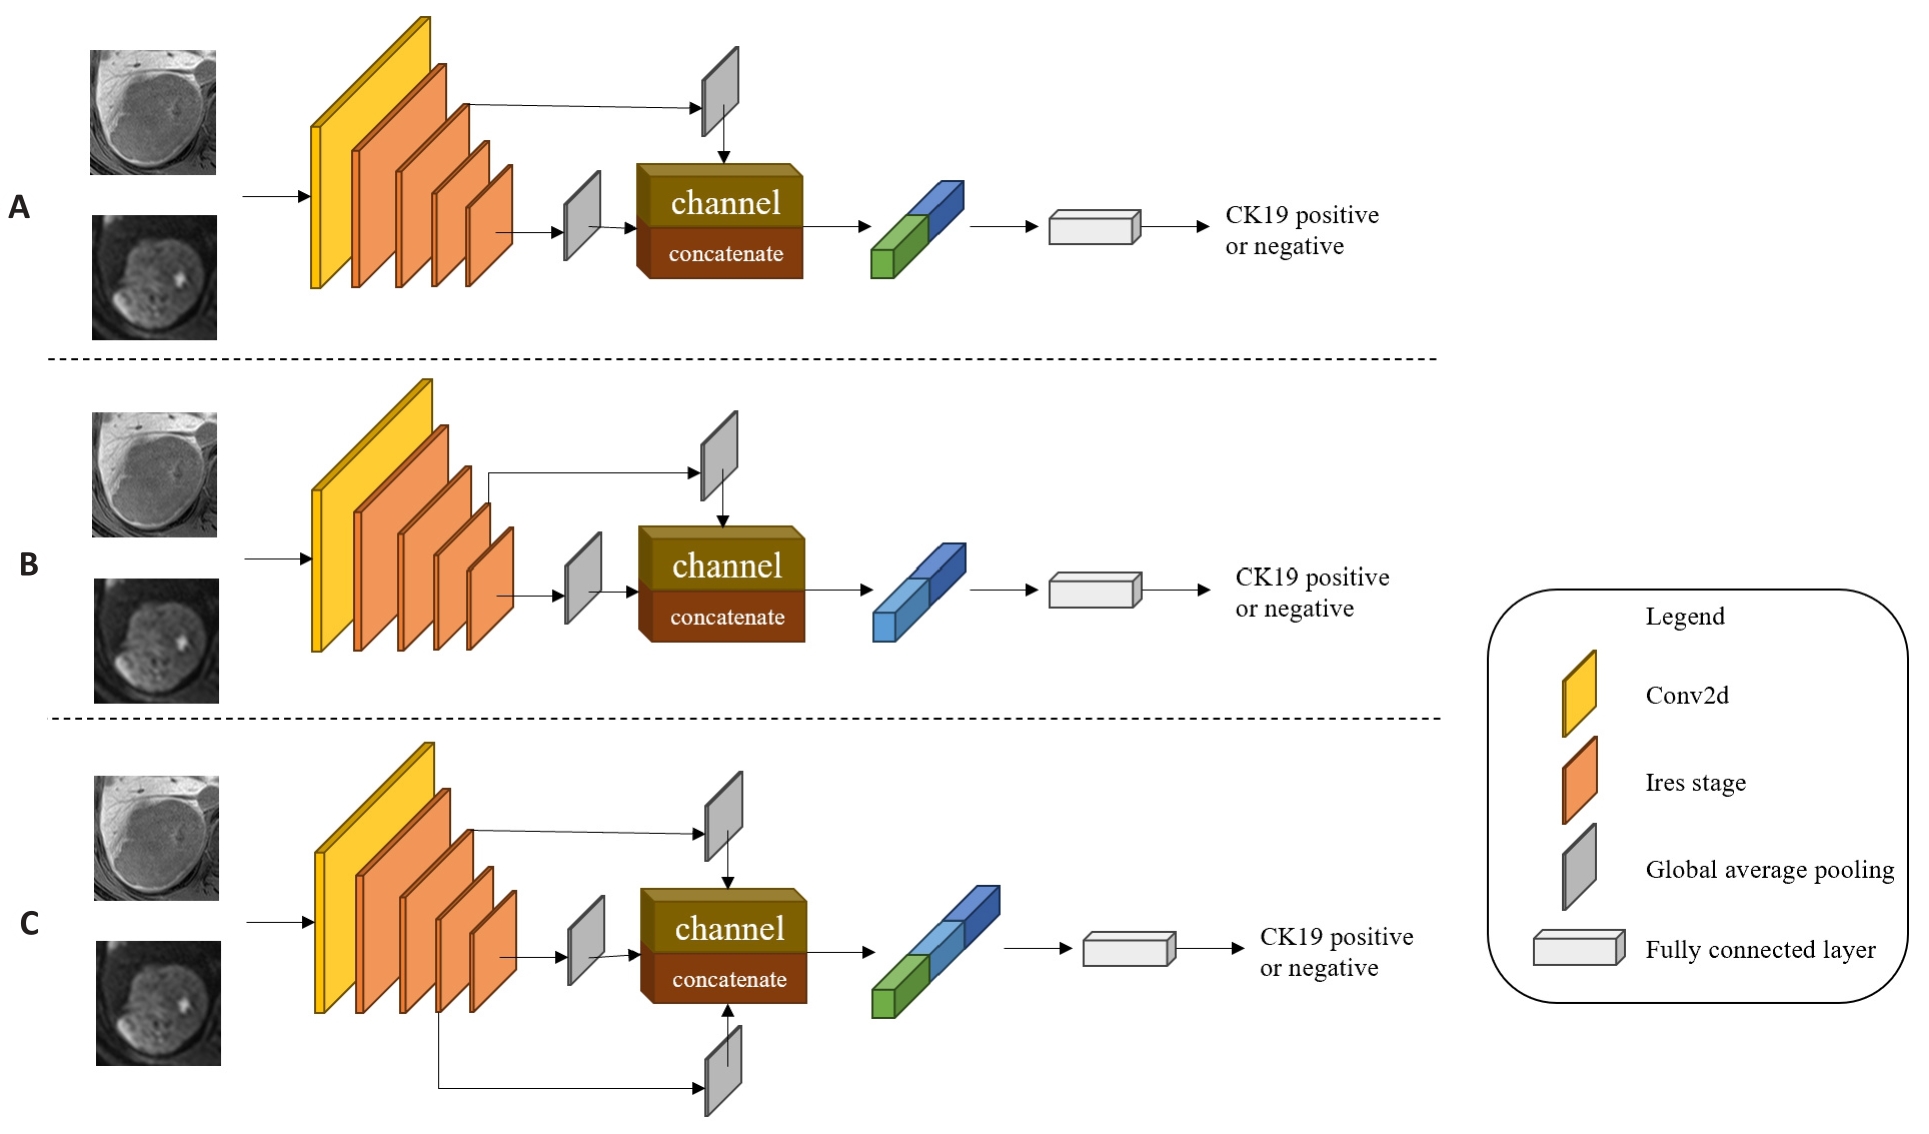
图4 多尺度特征融合模型
Fig.4 Multi-scale feature fusion models. A: MSFF-IResnet-a, which concatenates the second Ires Stage's shallow level feature map with the fourth Ires Stage's deep level feature map by channel dimension in IResnet18. B: MSFF-IResnet-b, which concatenates the third Ires Stage's middle level feature map with the fourth Ires Stage's deep level feature map by channel dimension in IResnet18. C: MSFF-IResnet-c, which concatenates the second Ires Stage's shallow level feature map and the third Ires Stage's middle level feature map with the fourth Ires Stage's deep level feature map by channel dimension in IResnet18.
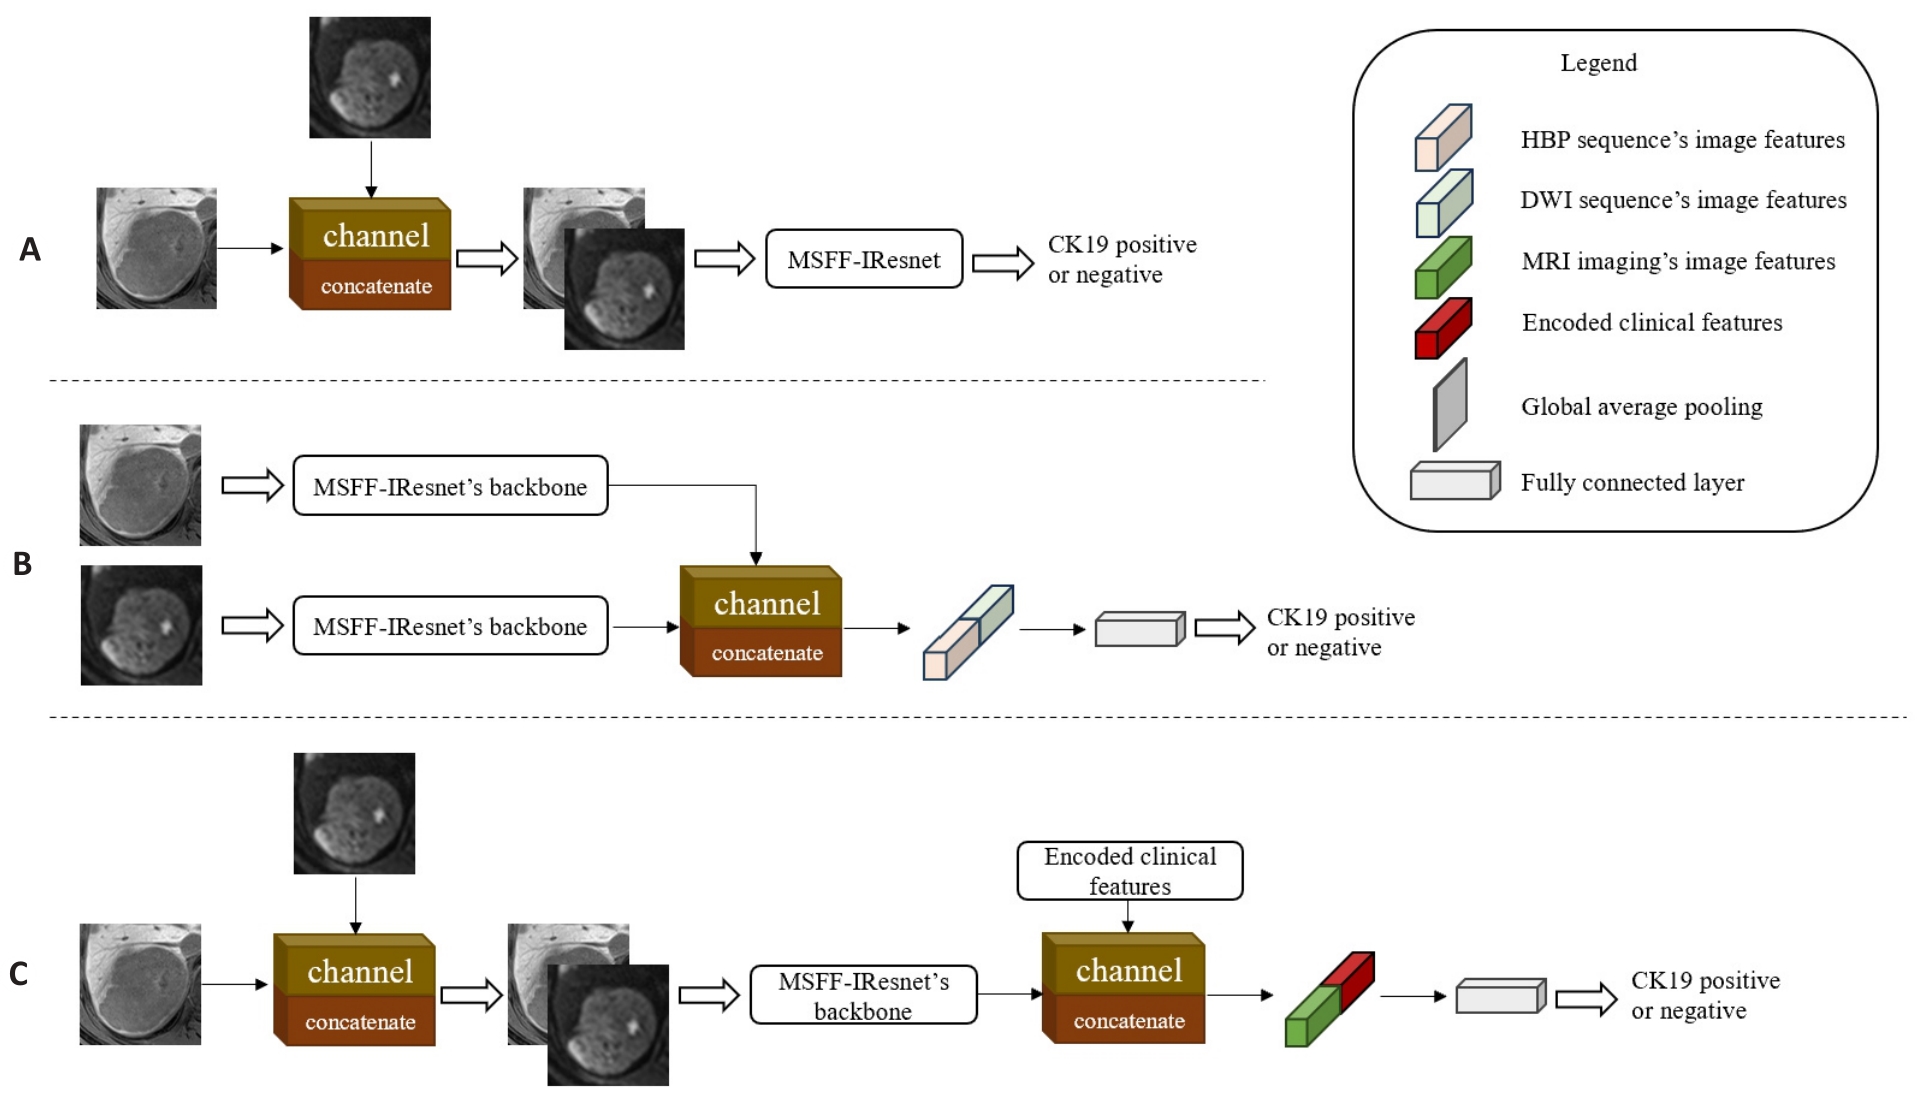
图5 不同阶段的多尺度多模态特征融合模型
Fig.5 Multi-scale and multi-modality feature fusion models at different stages. A: MMFF-IResnet-a, which fuses two sequences' images by channel dimension in the input stage of MSFF-IResnet. B: MMFF-IResnet-b with fusion of two sequences' feature maps by channel dimension in the feature extraction stage of two independent MSFF-IResnet. C: MMFF-IResnet-c, which concatenates the encoded clinical features by channel dimension in the feature extraction stage of MMFF-IResnet-a.
| Machine learning Model | Parameters |
|---|---|
| KNN | n_neighbors=15, weights=distance |
| SVM | kernel=poly, C=2 |
| LR | class_weight=balanced, random_state=20 |
| DTC | Criterion=entropy, max_depth=6, random_state=20 |
| RF | n_estimators=6, criterion=entropy, random_state=20, class_weight=balanced |
表3 机器学习模型及具体参数设置
Tab.3 Machine learning models and specific parameter settings
| Machine learning Model | Parameters |
|---|---|
| KNN | n_neighbors=15, weights=distance |
| SVM | kernel=poly, C=2 |
| LR | class_weight=balanced, random_state=20 |
| DTC | Criterion=entropy, max_depth=6, random_state=20 |
| RF | n_estimators=6, criterion=entropy, random_state=20, class_weight=balanced |
| Parameters | Value |
|---|---|
| Batch size | 128 |
| Learning rate | 0.01 |
| Weight decay | 1e-4、1e-5 |
| Warm up epoch | 5 |
| Total epoch | 100 |
| Early stopping patience | 10 |
表4 深度学习的具体参数设置
Tab.4 Special parameter settings of the deep learning models
| Parameters | Value |
|---|---|
| Batch size | 128 |
| Learning rate | 0.01 |
| Weight decay | 1e-4、1e-5 |
| Warm up epoch | 5 |
| Total epoch | 100 |
| Early stopping patience | 10 |
| Characteristics | Clinical Data of HCC Patients (n=116) | Qualitative or quantitative analysis | |
|---|---|---|---|
| CK19- (n=78, 67.2%) | CK19+ (n=38, 32.8%) | P | |
| Age (year, Mean±SD) | 57.7±12.4 | 59.4±11.1 | 0.451 |
| Gender | 0.485 | ||
| Male | 68 (87.2%) | 35 (92.1%) | |
| Female | 10 (12.8%) | 3 (7.9%) | |
| Hepatitis | 0.815 | ||
| Absent | 7 (9.0%) | 3 (7.9%) | |
| Present | 71 (91.0%) | 35 (92.1%) | |
| AFP (ng/mL) | 0.017* | ||
| ≤20 | 45 (57.7%) | 11 (28.9%) | |
| 20<, ≤400 | 25 (32.1%) | 14 (36.8%) | |
| >400 | 8 (10.3%) | 13 (34.2%) | |
| ALT[U/L, Median (Min, Max)] | 34.0 (9.0, 113.0) | 37.0 (15.0, 129.0) | 0.276 |
| AST [U/L, Median (Min, Max)] | 37.0 (15.0, 139.0) | 37.0 (18.0, 205.0) | 0.537 |
| GGT [U/L, Median (Min, Max)] | 52.5 (14.0, 1055.0) | 72.0 (13.0, 1013.0) | 0.648 |
| LY [109/L, Median (Min, Max)] | 1.54 (0.42, 3.95) | 1.36 (0.42, 2.35) | 0.521 |
| NLR [Median (Min, Max)] | 1.78 (0.48, 12.13) | 2.58 (1.14, 8.17) | 0.004* |
| ALB [g/L, Median (Min, Max)] | 41.2 (24.9, 74.3) | 41.7 (26.0, 49.9) | 0.239 |
| Tbil [μmol/L, Median (Min, Max)] | 14.37 (4.46, 35.12) | 15.29 (5.16, 93.30) | 0.466 |
| MVI | 0.099 | ||
| Negative | 60 (76.9%) | 23 (60.5%) | |
| Positive | 18 (23.1%) | 15 (39.5%) | |
| Tumor size[mm, Median (Min, Max)] | 3.50 (1.20, 11.70) | 3.80 (1.58, 14.79) | 0.553 |
| Tumor capsule | 0.016* | ||
| None | 13 (16.7%) | 0 (0%) | |
| Absent | 22 (28.1%) | 21 (55.3%) | |
| Present | 43 (55.1%) | 17 (44.7%) | |
| Tumor margin | 0.254 | ||
| Absent | 10 (12.8%) | 8 (21.1%) | |
| Present | 68 (87.2%) | 30 (78.9%) | |
| Cystic or necrosis portion or fat deposition | 0.776 | ||
| Absent | 49 (63.3%) | 23 (60.5%) | |
| Present | 29 (36.7%) | 15 (39.5%) | |
| Target sign of DWI | 0.844 | ||
| Absent | 47 (60.3%) | 24 (63.2%) | |
| Present | 31 (39.7%) | 14 (36.8%) | |
| Arterial rim enhancement | 0.097 | ||
| Absent | 67 (85.9%) | 27 (71.1%) | |
| Present | 11 (14.1%) | 11 (28.9%) | |
| Peritumoral eEnhancement | 0.538 | ||
| Absent | 57 (73.1%) | 25 (65.8%) | |
| Present | 21 (26.9%) | 13 (34.2%) | |
| Target sign of HBP | 0.278 | ||
| Absent | 45 (57.7%) | 17 (44.7%) | |
| Present | 33 (42.3%) | 21 (55.3%) | |
| Peritumoral hypo-intensity of HBP | 0.187 | ||
| Absent | 60 (76.9%) | 24 (63.2%) | |
| Present | 18 (23.1%) | 14 (36.8%) | |
| Satellite nodules | 0.155 | ||
| Absent | 72 (92.3%) | 38 (100.0%) | |
| Present | 6 (7.7%) | 0 (0%) | |
表5 CK19表达HCC患者的临床参数统计分析
Tab.5 Statistical analysis of clinical parameters of HCC patients with CK19 expression
| Characteristics | Clinical Data of HCC Patients (n=116) | Qualitative or quantitative analysis | |
|---|---|---|---|
| CK19- (n=78, 67.2%) | CK19+ (n=38, 32.8%) | P | |
| Age (year, Mean±SD) | 57.7±12.4 | 59.4±11.1 | 0.451 |
| Gender | 0.485 | ||
| Male | 68 (87.2%) | 35 (92.1%) | |
| Female | 10 (12.8%) | 3 (7.9%) | |
| Hepatitis | 0.815 | ||
| Absent | 7 (9.0%) | 3 (7.9%) | |
| Present | 71 (91.0%) | 35 (92.1%) | |
| AFP (ng/mL) | 0.017* | ||
| ≤20 | 45 (57.7%) | 11 (28.9%) | |
| 20<, ≤400 | 25 (32.1%) | 14 (36.8%) | |
| >400 | 8 (10.3%) | 13 (34.2%) | |
| ALT[U/L, Median (Min, Max)] | 34.0 (9.0, 113.0) | 37.0 (15.0, 129.0) | 0.276 |
| AST [U/L, Median (Min, Max)] | 37.0 (15.0, 139.0) | 37.0 (18.0, 205.0) | 0.537 |
| GGT [U/L, Median (Min, Max)] | 52.5 (14.0, 1055.0) | 72.0 (13.0, 1013.0) | 0.648 |
| LY [109/L, Median (Min, Max)] | 1.54 (0.42, 3.95) | 1.36 (0.42, 2.35) | 0.521 |
| NLR [Median (Min, Max)] | 1.78 (0.48, 12.13) | 2.58 (1.14, 8.17) | 0.004* |
| ALB [g/L, Median (Min, Max)] | 41.2 (24.9, 74.3) | 41.7 (26.0, 49.9) | 0.239 |
| Tbil [μmol/L, Median (Min, Max)] | 14.37 (4.46, 35.12) | 15.29 (5.16, 93.30) | 0.466 |
| MVI | 0.099 | ||
| Negative | 60 (76.9%) | 23 (60.5%) | |
| Positive | 18 (23.1%) | 15 (39.5%) | |
| Tumor size[mm, Median (Min, Max)] | 3.50 (1.20, 11.70) | 3.80 (1.58, 14.79) | 0.553 |
| Tumor capsule | 0.016* | ||
| None | 13 (16.7%) | 0 (0%) | |
| Absent | 22 (28.1%) | 21 (55.3%) | |
| Present | 43 (55.1%) | 17 (44.7%) | |
| Tumor margin | 0.254 | ||
| Absent | 10 (12.8%) | 8 (21.1%) | |
| Present | 68 (87.2%) | 30 (78.9%) | |
| Cystic or necrosis portion or fat deposition | 0.776 | ||
| Absent | 49 (63.3%) | 23 (60.5%) | |
| Present | 29 (36.7%) | 15 (39.5%) | |
| Target sign of DWI | 0.844 | ||
| Absent | 47 (60.3%) | 24 (63.2%) | |
| Present | 31 (39.7%) | 14 (36.8%) | |
| Arterial rim enhancement | 0.097 | ||
| Absent | 67 (85.9%) | 27 (71.1%) | |
| Present | 11 (14.1%) | 11 (28.9%) | |
| Peritumoral eEnhancement | 0.538 | ||
| Absent | 57 (73.1%) | 25 (65.8%) | |
| Present | 21 (26.9%) | 13 (34.2%) | |
| Target sign of HBP | 0.278 | ||
| Absent | 45 (57.7%) | 17 (44.7%) | |
| Present | 33 (42.3%) | 21 (55.3%) | |
| Peritumoral hypo-intensity of HBP | 0.187 | ||
| Absent | 60 (76.9%) | 24 (63.2%) | |
| Present | 18 (23.1%) | 14 (36.8%) | |
| Satellite nodules | 0.155 | ||
| Absent | 72 (92.3%) | 38 (100.0%) | |
| Present | 6 (7.7%) | 0 (0%) | |
| Characteristics | Univariate Analysis | Multivariate Analysis | ||||||
|---|---|---|---|---|---|---|---|---|
| OR | 95% CI | P | OR | 95% CI | P | |||
| Lower | Upper | Lower | Upper | |||||
| AFP (ng/mL) | ||||||||
| ≤20 | 0.024 | 0.189 | ||||||
| 20<, ≤400 | 1 | 1 | ||||||
| >400 | 6.000 | 1.650 | 21.824 | 0.007 | 0.121 | |||
| NLR | 1.259 | 0.977 | 1.622 | 0.075 | 1.417 | 1.036 | 1.938 | 0.029 |
| MVI | 0.493 | |||||||
| Negetive | 1 | 1 | ||||||
| Positive | 2.274 | 0.848 | 6.102 | 0.103 | ||||
| Tumor Capsule | 0.202 | 0.089 | ||||||
| None | ||||||||
| Absent | 2.422 | 0.918 | 6.387 | 0.074 | 3.250 | 1.136 | 9.301 | 0.028 |
| Present | 1 | 1 | ||||||
| Arterial rim enhancement | 0.229 | |||||||
| Absent | 1 | 1 | ||||||
| Present | 2.526 | 0.829 | 7.702 | 0.103 | ||||
表6 单变量和多变量逻辑回归分析结果
Tab.6 Results of univariate and multivariate logistic regression analysis
| Characteristics | Univariate Analysis | Multivariate Analysis | ||||||
|---|---|---|---|---|---|---|---|---|
| OR | 95% CI | P | OR | 95% CI | P | |||
| Lower | Upper | Lower | Upper | |||||
| AFP (ng/mL) | ||||||||
| ≤20 | 0.024 | 0.189 | ||||||
| 20<, ≤400 | 1 | 1 | ||||||
| >400 | 6.000 | 1.650 | 21.824 | 0.007 | 0.121 | |||
| NLR | 1.259 | 0.977 | 1.622 | 0.075 | 1.417 | 1.036 | 1.938 | 0.029 |
| MVI | 0.493 | |||||||
| Negetive | 1 | 1 | ||||||
| Positive | 2.274 | 0.848 | 6.102 | 0.103 | ||||
| Tumor Capsule | 0.202 | 0.089 | ||||||
| None | ||||||||
| Absent | 2.422 | 0.918 | 6.387 | 0.074 | 3.250 | 1.136 | 9.301 | 0.028 |
| Present | 1 | 1 | ||||||
| Arterial rim enhancement | 0.229 | |||||||
| Absent | 1 | 1 | ||||||
| Present | 2.526 | 0.829 | 7.702 | 0.103 | ||||
| Model | Accuracy | Precision | Sensitivity | Specificity | AUC |
|---|---|---|---|---|---|
| KNN | 0.810±0.084 | 0.850±0.200 | 0.567±0.152 | 0.932±0.097 | 0.747±0.084 |
| SVM | 0.810±0.084 | 0.810±0.185 | 0.607±0.179 | 0.914±0.091 | 0.759±0.098 |
| LR | 0.749±0.111 | 0.628±0.168 | 0.673±0.116 | 0.789±0.123 | 0.731±0.108 |
| DTC | 0.798±0.098 | 0.743±0.164 | 0.607±0.179 | 0.895±0.081 | 0.750±0.107 |
| RF | 0.762±0.109 | 0.669±0.201 | 0.633±0.099 | 0.824±0.120 | 0.728±0.103 |
表7 机器学习模型分类结果
Tab.7 Classification performance of the machine learning models
| Model | Accuracy | Precision | Sensitivity | Specificity | AUC |
|---|---|---|---|---|---|
| KNN | 0.810±0.084 | 0.850±0.200 | 0.567±0.152 | 0.932±0.097 | 0.747±0.084 |
| SVM | 0.810±0.084 | 0.810±0.185 | 0.607±0.179 | 0.914±0.091 | 0.759±0.098 |
| LR | 0.749±0.111 | 0.628±0.168 | 0.673±0.116 | 0.789±0.123 | 0.731±0.108 |
| DTC | 0.798±0.098 | 0.743±0.164 | 0.607±0.179 | 0.895±0.081 | 0.750±0.107 |
| RF | 0.762±0.109 | 0.669±0.201 | 0.633±0.099 | 0.824±0.120 | 0.728±0.103 |
| Item | Accuracy | Precision | Sensitivity | Specificity | AUC |
|---|---|---|---|---|---|
| HBP sequence | |||||
| IResnet | 0.651±0.098 | 0.526±0.141 | 0.700±0.177 | 0.627±0.203 | 0.718±0.080 |
| MSFF-IResnet-a | 0.707±0.089 | 0.549±0.086 | 0.846±0.054 | 0.639±0.153 | 0.780±0.068 |
| MSFF-IResnet-b | 0.738±0.038 | 0.611±0.078 | 0.620±0.180 | 0.795±0.102 | 0.738±0.077 |
| MSFF-IResnet-c | 0.782±0.068 | 0.643±0.079 | 0.673±0.066 | 0.785±0.084 | 0.819±0.083 |
| DWI sequence | |||||
| IResnet | 0.745±0.056 | 0.606±0.043 | 0.679±0.150 | 0.776±0.060 | 0.752±0.091 |
| MSFF-IResnet-a | 0.714±0.067 | 0.551±0.085 | 0.833±0.139 | 0.651±0.107 | 0.764±0.075 |
| MSFF-IResnet-b | 0.749±0.059 | 0.605±0.103 | 0.819±0.102 | 0.707±0.117 | 0.781±0.098 |
| MSFF-IResnet-c | 0.735±0.111 | 0.578±0.133 | 0.917±0.092 | 0.642±0.136 | 0.796±0.118 |
表8 多尺度特征融合方法的消融实验的分类结果
Tab.8 Classification results of the ablation experiment using multi-scale feature fusion methods
| Item | Accuracy | Precision | Sensitivity | Specificity | AUC |
|---|---|---|---|---|---|
| HBP sequence | |||||
| IResnet | 0.651±0.098 | 0.526±0.141 | 0.700±0.177 | 0.627±0.203 | 0.718±0.080 |
| MSFF-IResnet-a | 0.707±0.089 | 0.549±0.086 | 0.846±0.054 | 0.639±0.153 | 0.780±0.068 |
| MSFF-IResnet-b | 0.738±0.038 | 0.611±0.078 | 0.620±0.180 | 0.795±0.102 | 0.738±0.077 |
| MSFF-IResnet-c | 0.782±0.068 | 0.643±0.079 | 0.673±0.066 | 0.785±0.084 | 0.819±0.083 |
| DWI sequence | |||||
| IResnet | 0.745±0.056 | 0.606±0.043 | 0.679±0.150 | 0.776±0.060 | 0.752±0.091 |
| MSFF-IResnet-a | 0.714±0.067 | 0.551±0.085 | 0.833±0.139 | 0.651±0.107 | 0.764±0.075 |
| MSFF-IResnet-b | 0.749±0.059 | 0.605±0.103 | 0.819±0.102 | 0.707±0.117 | 0.781±0.098 |
| MSFF-IResnet-c | 0.735±0.111 | 0.578±0.133 | 0.917±0.092 | 0.642±0.136 | 0.796±0.118 |
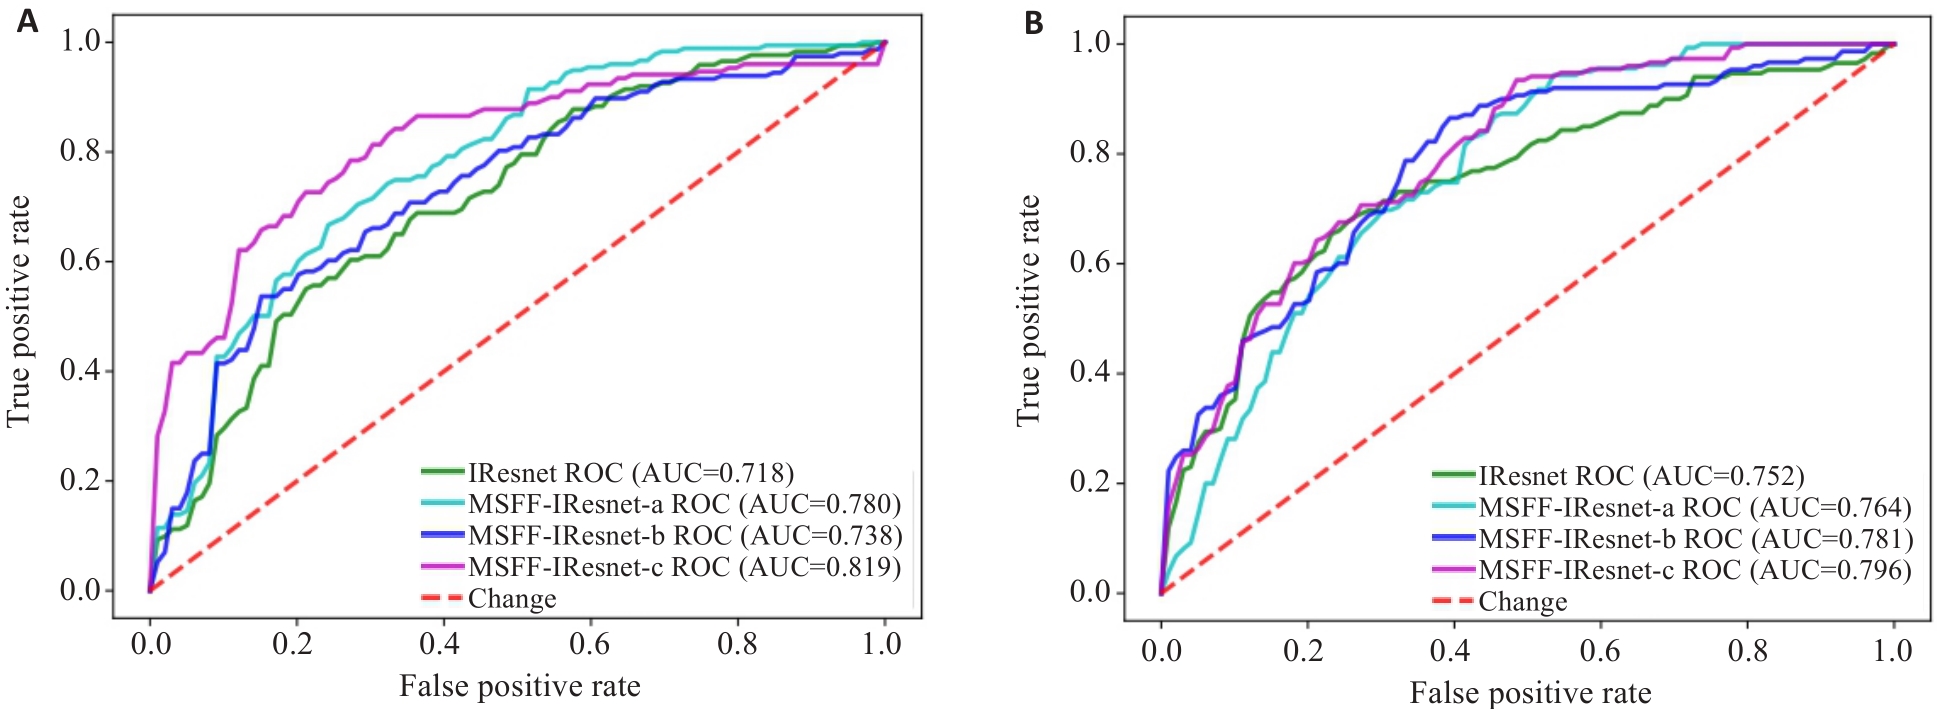
图6 多尺度特征融合方法的消融实验的ROC图
Fig.6 ROC charts of the ablation experiment for multi-scale feature fusion methods. A: ROC of models based on HBP sequence. B: ROC of models based on DWI sequence.
| Method | Accuracy | Precision | Sensitivity | Specificity | AUC |
|---|---|---|---|---|---|
| MSFF-IResnet | 0.782±0.068 | 0.643±0.079 | 0.673±0.066 | 0.785±0.084 | 0.819±0.083 |
| MMFF-IResnet-a | 0.796±0.085 | 0.702±0.182 | 0.773±0.118 | 0.804±0.136 | 0.829±0.122 |
| MMFF-IResnet-b | 0.790±0.061 | 0.648±0.097 | 0.778±0.173 | 0.787±0.079 | 0.823±0.089 |
| MMFF-IResnet-c | 0.806±0.080 | 0.708±0.148 | 0.801±0.128 | 0.812±0.131 | 0.842±0.100 |
表9 多模态特征融合方法的消融实验的分类结果
Tab.9 Classification results of the ablation experiment using multi-modality feature fusion methods
| Method | Accuracy | Precision | Sensitivity | Specificity | AUC |
|---|---|---|---|---|---|
| MSFF-IResnet | 0.782±0.068 | 0.643±0.079 | 0.673±0.066 | 0.785±0.084 | 0.819±0.083 |
| MMFF-IResnet-a | 0.796±0.085 | 0.702±0.182 | 0.773±0.118 | 0.804±0.136 | 0.829±0.122 |
| MMFF-IResnet-b | 0.790±0.061 | 0.648±0.097 | 0.778±0.173 | 0.787±0.079 | 0.823±0.089 |
| MMFF-IResnet-c | 0.806±0.080 | 0.708±0.148 | 0.801±0.128 | 0.812±0.131 | 0.842±0.100 |
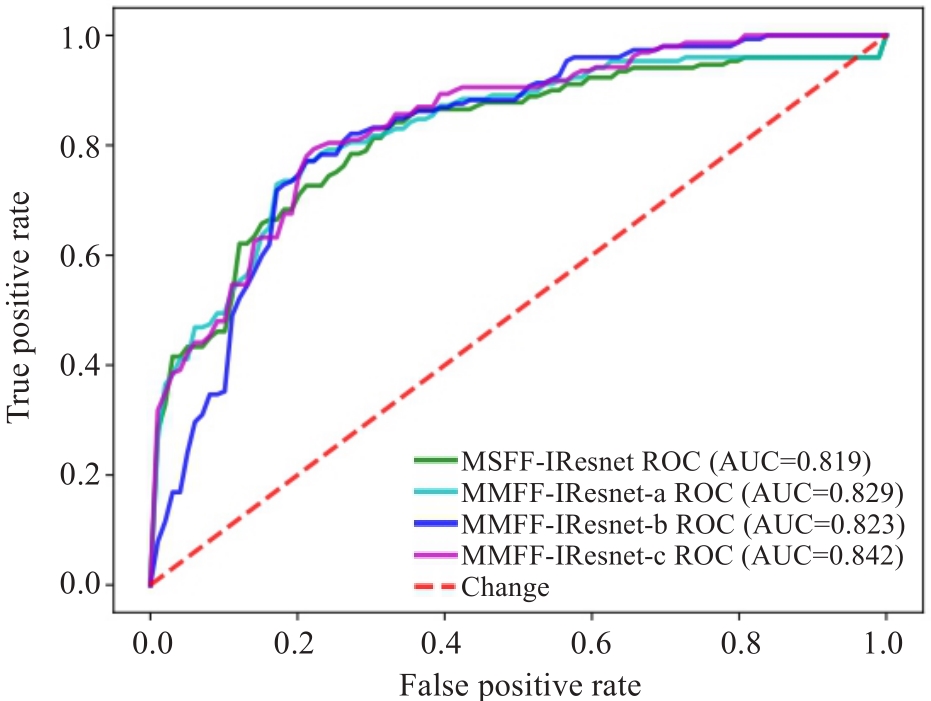
图7 多模态特征融合方法的消融实验的ROC图
Fig.7 ROC charts of the ablation experiment for multi-modality feature fusion methods.
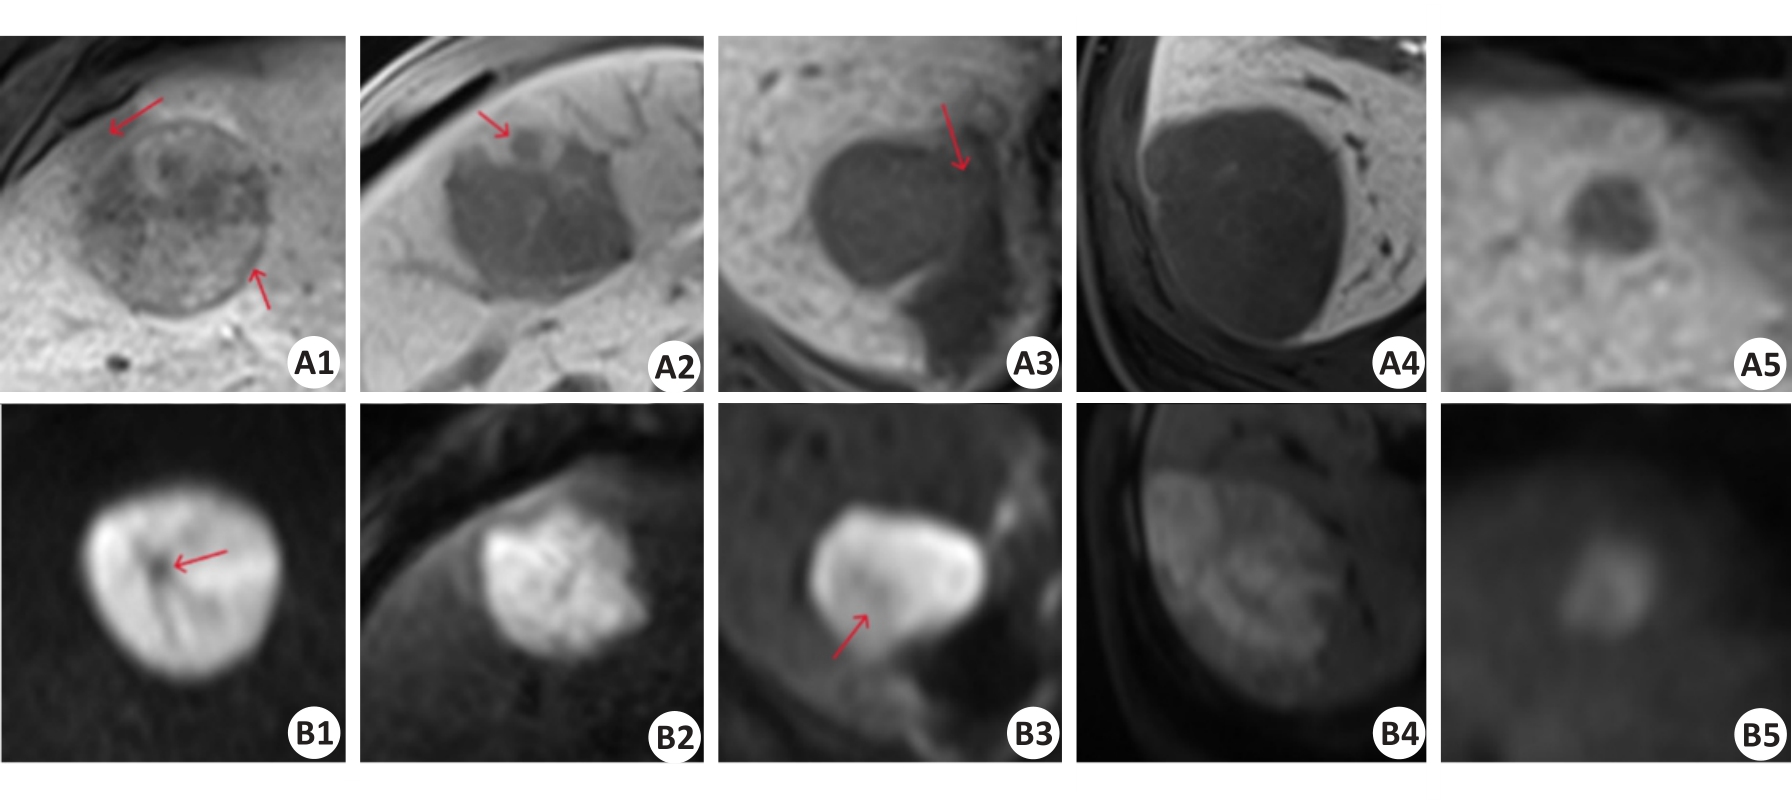
图8 HBP序列(A1-A5)及DWI序列(B1-B5)的正负样本影像对比
Fig.8 Comparison of positive and negative sample images of HBP sequence (A1-A5) and DWI sequence (B1-B5). A1-A2 and B1-B2: True CK19-positive cases predicted by the baseline model and multi-scale feature fusion models. A3 and B3: CK19-positive cases predicted as negative by the baseline model but corrected to be positive by multi-scale feature fusion models. A4-A5 and B4-B5: true CK19-negative cases predicted by the baseline model and multi-scale feature fusion models. The red arrows in A1, A2, A3, B1, and B3 sequentially represent the imaging features of peritumoral hypo-intensity, HBP target sign, irregular tumor margin, peritumoral hypo-intensity, fat deposition, and lower high signal tumor area.
| Research | Method | Year | Cases | Accuracy | Sensitivity | Specificity | AUC |
|---|---|---|---|---|---|---|---|
| Peng [ | Machine Learning | 2024 | 226 | 0.706 | - | - | 0.706 |
| Lu [ | Machine Learning | 2024 | 220 | 0.758 | 0.625 | 0.8 | 0.748 |
| Wang [ | Radiomics | 2024 | 137 | - | 0.724 | 0.759 | 0.75 |
| Zhang [ | Radiomics | 2023 | 311 | - | 0.769 | 0.818 | 0.795 |
| Hu [ | Radiomics | 2023 | 110 | 0.88 | 0.84 | 0.89 | 0.92 |
| Ours | Deep Learning | 2024 | 116 | 0.806 | 0.801 | 0.812 | 0.842 |
表10 与其他研究的对比实验
Tab.10 Comparison with the results of other research
| Research | Method | Year | Cases | Accuracy | Sensitivity | Specificity | AUC |
|---|---|---|---|---|---|---|---|
| Peng [ | Machine Learning | 2024 | 226 | 0.706 | - | - | 0.706 |
| Lu [ | Machine Learning | 2024 | 220 | 0.758 | 0.625 | 0.8 | 0.748 |
| Wang [ | Radiomics | 2024 | 137 | - | 0.724 | 0.759 | 0.75 |
| Zhang [ | Radiomics | 2023 | 311 | - | 0.769 | 0.818 | 0.795 |
| Hu [ | Radiomics | 2023 | 110 | 0.88 | 0.84 | 0.89 | 0.92 |
| Ours | Deep Learning | 2024 | 116 | 0.806 | 0.801 | 0.812 | 0.842 |
| 1 | Forner A, Reig M, Bruix J. Hepatocellular carcinoma[J]. Lancet, 2018, 391(10127): 1301-14. |
| 2 | Wu MS, Zhong JH, Chen K, et al. Association of CK19 expression with the efficacy of adjuvant transarterial chemoembolization after hepatic resection in hepatocellular carcinoma patients at high risk of recurrence[J]. J Clin Transl Res, 2022, 8(1): 71-9. |
| 3 | Zhuo JY, Lu D, Tan WY, et al. CK19-positive hepatocellular carcinoma is a characteristic subtype[J]. J Cancer, 2020, 11(17): 5069-77. |
| 4 | Guo YX, Chen JJ, Zhang YF, et al. Differentiating Cytokeratin 19 expression of hepatocellular carcinoma by using multi-b-value diffusion-weighted MR imaging with mono-exponential, stretched exponential, intravoxel incoherent motion, diffusion kurtosis imaging and fractional order calculus models[J]. Eur J Radiol, 2022, 150: 110237. |
| 5 | 肝癌新辅助治疗中国专家共识协作组, 中国研究型医院学会消化外科专业委员会, 中国抗癌协会肝癌专业委员会. 肝癌新辅助治疗中国专家共识(2023版)[J]. 中华外科杂志, 2023, 61(12): 1035-45. |
| 6 | Choi SY, Kim SH, Park CK, et al. Imaging features of gadoxetic acid-enhanced and diffusion-weighted MR imaging for identifying cytokeratin 19-positive hepatocellular carcinoma: a retrospective observational study[J]. Radiology, 2018, 286(3): 897-908. |
| 7 | Chen YY, Chen J, Zhang Y, et al. Preoperative prediction of cytokeratin 19 expression for hepatocellular carcinoma with deep learning radiomics based on gadoxetic acid-enhanced magnetic resonance imaging[J]. J Hepatocell Carcinoma, 2021, 8: 795-808. |
| 8 | Yoneda N, Sato Y, Kitao A, et al. Epidermal growth factor induces cytokeratin 19 expression accompanied by increased growth abilities in human hepatocellular carcinoma[J]. Lab Invest, 2011, 91(2): 262-72. |
| 9 | Yoon JK, Choi JY, Rhee H, et al. MRI features of histologic subtypes of hepatocellular carcinoma: correlation with histologic, genetic, and molecular biologic classification[J]. Eur Radiol, 2022, 32(8): 5119-33. |
| 10 | Hu XX, Wang WT, Yang L, et al. MR features based on LI-RADS identify cytokeratin 19 status of hepatocellular carcinomas[J]. Eur J Radiol, 2019, 113: 7-14. |
| 11 | Wang WT, Gu DS, Wei JW, et al. A radiomics-based biomarker for cytokeratin 19 status of hepatocellular carcinoma with gadoxetic acid-enhanced MRI[J]. Eur Radiol, 2020, 30(5): 3004-14. |
| 12 | Lu XY, Xi T, Lau WY, et al. Hepatocellular carcinoma expressing cholangiocyte phenotype is a novel subtype with highly aggressive behavior[J]. Ann Surg Oncol, 2011, 18(8): 2210-7. |
| 13 | Lee CW, Lin SE, Yu MC, et al. Does neutrophil to lymphocyte ratio have a role in identifying cytokeratin 19-expressing hepatocellular carcinoma?[J]. J Pers Med, 2021, 11(11): 1078. |
| 14 | Govaere O, Komuta M, Berkers J, et al. Keratin 19: a key role player in the invasion of human hepatocellular carcinomas[J]. Gut, 2014, 63(4): 674-85. |
| 15 | Sun DW, Zhang YY, Sun XD, et al. Prognostic value of cytokeratin 19 in hepatocellular carcinoma: a meta-analysis[J]. Clin Chim Acta, 2015, 448: 161-9. |
| 16 | Tsuchiya K, Komuta M, Yasui Y, et al. Expression of keratin 19 is related to high recurrence of hepatocellular carcinoma after radiofrequency ablation[J]. Oncology, 2011, 80(3/4): 278-88. |
| 17 | Qin SD, Zhang J, Qi YP, et al. Individual and joint influence of cytokeratin 19 and microvascular invasion on the prognosis of patients with hepatocellular carcinoma after hepatectomy[J]. World J Surg Oncol, 2022, 20(1): 209. |
| 18 | Yang F, Wan YD, Xu L, et al. MRI-radiomics prediction for cytokeratin 19-positive hepatocellular carcinoma: a multicenter study[J]. Front Oncol, 2021, 11: 672126. |
| 19 | Caviglia GP, Ciruolo M, Olivero A, et al. Prognostic role of serum cytokeratin-19 fragment (CYFRA 21-1) in patients with hepatocellular carcinoma[J]. Cancers, 2020, 12(10): 2776. |
| 20 | Zhao Y, Tan XL, Chen JM, et al. Preoperative prediction of cytokeratin-19 expression for hepatocellular carcinoma using T1 mapping on gadoxetic acid-enhanced MRI combined with diffusion-weighted imaging and clinical indicators[J]. Front Oncol, 2022, 12: 1068231. |
| 21 | 关星群, 刘子蔚, 郭保亮, 等. 钆塞酸二钠增强MRI结合T1mapping术前预测肝细胞癌CK19表达及列线图构建[J]. 中国CT和MRI杂志, 2023, 21(6): 103-6. |
| 22 | Lv J, Yin HY, Yu HJ, et al. The added value of 18F-FDG PET/MRI multimodal imaging in hepatocellular carcinoma for identifying cytokeratin 19 status[J]. Abdom Radiol, 2023, 48(7): 2331-9. |
| 23 | 鲁梦恬, 瞿 琦, 徐 磊, 等. 基于LI-RADS v2018及MRI特征对肝细胞癌CK19表达的风险预测及预后评估[J]. 磁共振成像, 2024, 15(3): 107-13, 121. |
| 24 | 彭超群, 杨 燕, 杨程羽, 等. 基于钆塞酸二钠增强MRI特征构建肝细胞癌CK19表达术前预测模型[J]. 中国医学计算机成像杂志, 2024, 30(2): 197-204. |
| 25 | Huang XL, Long LL, Wei JQ, et al. Radiomics for diagnosis of dual-phenotype hepatocellular carcinoma using Gd-EOB-DTPA-enhanced MRI and patient prognosis[J]. J Cancer Res Clin Oncol, 2019, 145(12): 2995-3003. |
| 26 | Hu XJ, Wang Q, Huang GB, et al. Gadoxetic acid-enhanced MRI-based radiomics signature: a potential imaging biomarker for identifying cytokeratin 19-positive hepatocellular carcinoma[J]. Comput Math Methods Med, 2023, 2023: 5424204. |
| 27 | Liu JQ, Wang J, Huang XL, et al. A radiomics model based on magnetic resonance imaging to predict cytokeratin 7/19 expression and liver fluke infection of hepatocellular carcinoma[J]. Sci Rep, 2023, 13(1): 17553. |
| 28 | Zhang LQ, Zhou HS, Zhang XQ, et al. A radiomics nomogram for predicting cytokeratin 19-positive hepatocellular carcinoma: a two-center study[J]. Front Oncol, 2023, 13: 1174069. |
| 29 | 王 倩, 黎金葵, 徐俊霞, 等. Gd-EOB-DTPA增强MRI预测CK19阳性肝细胞癌及其预后的临床价值[J]. 临床放射学杂志, 2024, 43(3): 388-93. |
| 30 | Shen L, Lin ZC, Huang QM. Relay backpropagation for effective learning of deep convolutional neural networks[M]//Lecture Notes in Computer Science. Cham: Springer International Publishing, 2016: 467-82. |
| 31 | Duta IC, Liu L, Zhu F, et al. Improved residual networks for image and video recognition[C]//2020 25th International Conference on Pattern Recognition (ICPR). Milan, Italy. IEEE, 2021: 9415-22. |
| 32 | Jeong HT, Kim MJ, Kim YE, et al. MRI features of hepatocellular carcinoma expressing progenitor cell markers[J]. Liver Int, 2012, 32(3): 430-40. |
| 33 | An C, Kim DW, Park YN, et al. Single hepatocellular carcinoma: preoperative MR imaging to predict early recurrence after curative resection[J]. Radiology, 2015, 276(2): 433-43. |
| 34 | Ma WJ, Wang HY, Teng LS. Correlation analysis of preoperative serum alpha-fetoprotein (AFP) level and prognosis of hepatocellular carcinoma (HCC) after hepatectomy[J]. World J Surg Oncol, 2013, 11: 212. |
| [1] | 郑子瑜, 杨夏颖, 吴圣杰, 张诗婕, 吕国荣, 柳培忠, 王珺, 何韶铮. 多特征融合的产时超声胎方位识别模型[J]. 南方医科大学学报, 2025, 45(7): 1563-1570. |
| [2] | 任煜瀛, 黄凌霄, 杜方, 姚新波. 基于改进RT-DETR的多尺度特征融合的高效轻量皮肤病理检测方法[J]. 南方医科大学学报, 2025, 45(2): 409-421. |
| [3] | 贺亚迪, 周炫汝, 金锦辉, 宋婷. 基于PE-CycleGAN网络的鼻咽癌自适应放疗CBCT-sCT生成研究[J]. 南方医科大学学报, 2025, 45(1): 179-186. |
| [4] | 欧嘉志, 詹长安, 杨丰. 一维卷积神经网络的自编码癫痫发作异常检测模型[J]. 南方医科大学学报, 2024, 44(9): 1796-1804. |
| [5] | 汪辰, 蒙铭强, 李明强, 王永波, 曾栋, 边兆英, 马建华. 基于双域Transformer耦合特征学习的CT截断数据重建模型[J]. 南方医科大学学报, 2024, 44(5): 950-959. |
| [6] | 龙楷兴, 翁丹仪, 耿 舰, 路艳蒙, 周志涛, 曹 蕾. 基于多模态多示例学习的免疫介导性肾小球疾病自动分类方法[J]. 南方医科大学学报, 2024, 44(3): 585-593. |
| [7] | 肖 慧, 方威扬, 林铭俊, 周振忠, 费洪文, 陈超敏. 基于两阶段分析的多尺度颈动脉斑块检测方法[J]. 南方医科大学学报, 2024, 44(2): 387-396. |
| [8] | 刘操林, 邹青清, 王梦虹, 杨芹枚, 宋丽文, 陆紫箫, 冯前进, 赵英华. 鉴别原发性骨肿瘤骨样和软骨样基质矿化:基于CT和临床特征的深度学习融合模型的多中心回顾性研究[J]. 南方医科大学学报, 2024, 44(12): 2412-2420. |
| [9] | 弥 佳, 周宇佳, 冯前进. 基于正交视角X线图像重建的3D/2D配准方法[J]. 南方医科大学学报, 2023, 43(9): 1636-1643. |
| [10] | 楚智钦, 屈耀铭, 钟 涛, 梁淑君, 温志波, 张 煜. 磁共振酰胺质子转移模态的胶质瘤IDH基因分型识别:基于深度学习的Dual-Aware框架[J]. 南方医科大学学报, 2023, 43(8): 1379-1387. |
| [11] | 于佳弘, 张昆鹏, 靳 爽, 苏 哲, 徐晓桐, 张 华. 弦图插值结合UNIT网络图像转换的CT金属伪影校正[J]. 南方医科大学学报, 2023, 43(7): 1214-1223. |
| [12] | 周 昊, 曾 栋, 边兆英, 马建华. 基于半监督网络的组织感知CT图像对比度的增强方法[J]. 南方医科大学学报, 2023, 43(6): 985-993. |
| [13] | 滕 琳, 王 斌, 冯前进. 头颈癌放疗计划剂量分布的预测方法:基于深度学习的算法[J]. 南方医科大学学报, 2023, 43(6): 1010-1016. |
| [14] | 吴雪扬, 张 煜, 张 华, 钟 涛. 基于注意力机制和多模态特征融合的猕猴脑磁共振图像全脑分割[J]. 南方医科大学学报, 2023, 43(12): 2118-2125. |
| [15] | 和法伟, 王永波, 陶 熙, 朱曼曼, 洪梓璇, 边兆英, 马建华. 基于噪声水平估计的低剂量螺旋CT投影数据恢复[J]. 南方医科大学学报, 2022, 42(6): 849-859. |
| 阅读次数 | ||||||
|
全文 |
|
|||||
|
摘要 |
|
|||||