南方医科大学学报 ›› 2025, Vol. 45 ›› Issue (12): 2616-2627.doi: 10.12122/j.issn.1673-4254.2025.12.09
• • 上一篇
原梦瑶1,2( ), 阮湘涵1,2, 李扬1, 张婷1, 郝春香1, 李皓1, 娄景盛1, 曹江北1, 刘艳红1, 米卫东1(), 张晓莹1()
收稿日期:2025-07-15
出版日期:2025-12-20
发布日期:2025-12-22
通讯作者:
米卫东,张晓莹
E-mail:yuanmengyaoup@126.com;wwdd1962@163.com;zxystudy@163.com
作者简介:原梦瑶,在读硕士研究生,E-mail: yuanmengyaoup@126.com
基金资助:
Mengyao YUAN1,2(), Xianghan RUAN1,2, Yang LI1, Ting ZHANG1, Chunxiang HAO1, Hao LI1, Jingsheng LOU1, Jiangbei CAO1, Yanhong LIU1, Weidong MI1(), Xiaoying ZHANG1()
Received:2025-07-15
Online:2025-12-20
Published:2025-12-22
Contact:
Weidong MI, Xiaoying ZHANG
E-mail:yuanmengyaoup@126.com;wwdd1962@163.com;zxystudy@163.com
摘要:
目的 探讨术前血清镁(sMg)水平与老年患者术后谵妄(POD)发生的关系,并评估全身炎症反应在该关联中的中介作用。 方法 本研究为单中心回顾性队列研究,纳入2014年1月~2021年12月在中国人民解放军总医院接受非心脏非神经外科手术的12,876例老年患者。所有患者术前30 d内完成血清镁和C反应蛋白(CRP)检测。POD诊断基于电子病历系统,采用结构化病历回顾法识别术后7 d内POD发生情况。采用Logistic回归模型及限制性立方样条(RCS)分析sMg水平与POD风险的关联,并进行亚组分析评估异质性。进一步构建结构方程模型(SEM)评估CRP在sMg与POD关系中的中介作用,调整年龄、性别、营养状态、肿瘤、糖尿病及肝肾功能等混杂因素。 结果 POD共发生685例,发生率为5.3%。术前sMg水平与POD风险呈显著非线性关系,最低风险对应sMg水平约0.90~0.94 mmol/L。与第四五分位组相比,最低五分位组患者POD风险显著升高(OR=1.81,95% CI:1.41~2.35),且该关联在多因素调整后依然稳健。中介效应分析显示,CRP解释了sMg与POD总关联的17.1%,其中癌症患者中介比例达24.1%,显著高于非癌症患者(11.9%)。敏感性分析及E值计算进一步支持结果的稳健性。亚组分析提示该非线性关联在癌症患者及≥75岁高龄人群中更显著(P=0.013)。 结论 术前低血镁状态与术后谵妄风险显著相关,呈非线性关系,且该关联部分通过全身炎症反应介导。血清镁作为常规可检测且具干预潜力的生物标志物,具有良好的临床应用前景,有望为围术期高风险患者的POD早期识别与干预提供重要依据。
原梦瑶, 阮湘涵, 李扬, 张婷, 郝春香, 李皓, 娄景盛, 曹江北, 刘艳红, 米卫东, 张晓莹. 术前血清镁水平与非心脏手术老年患者术后谵妄风险的关系:一项回顾性队列研究[J]. 南方医科大学学报, 2025, 45(12): 2616-2627.
Mengyao YUAN, Xianghan RUAN, Yang LI, Ting ZHANG, Chunxiang HAO, Hao LI, Jingsheng LOU, Jiangbei CAO, Yanhong LIU, Weidong MI, Xiaoying ZHANG. Preoperative serum magnesium as a biomarker for predicting delirium following non-cardiac surgery in elderly patients: a retrospective cohort study[J]. Journal of Southern Medical University, 2025, 45(12): 2616-2627.
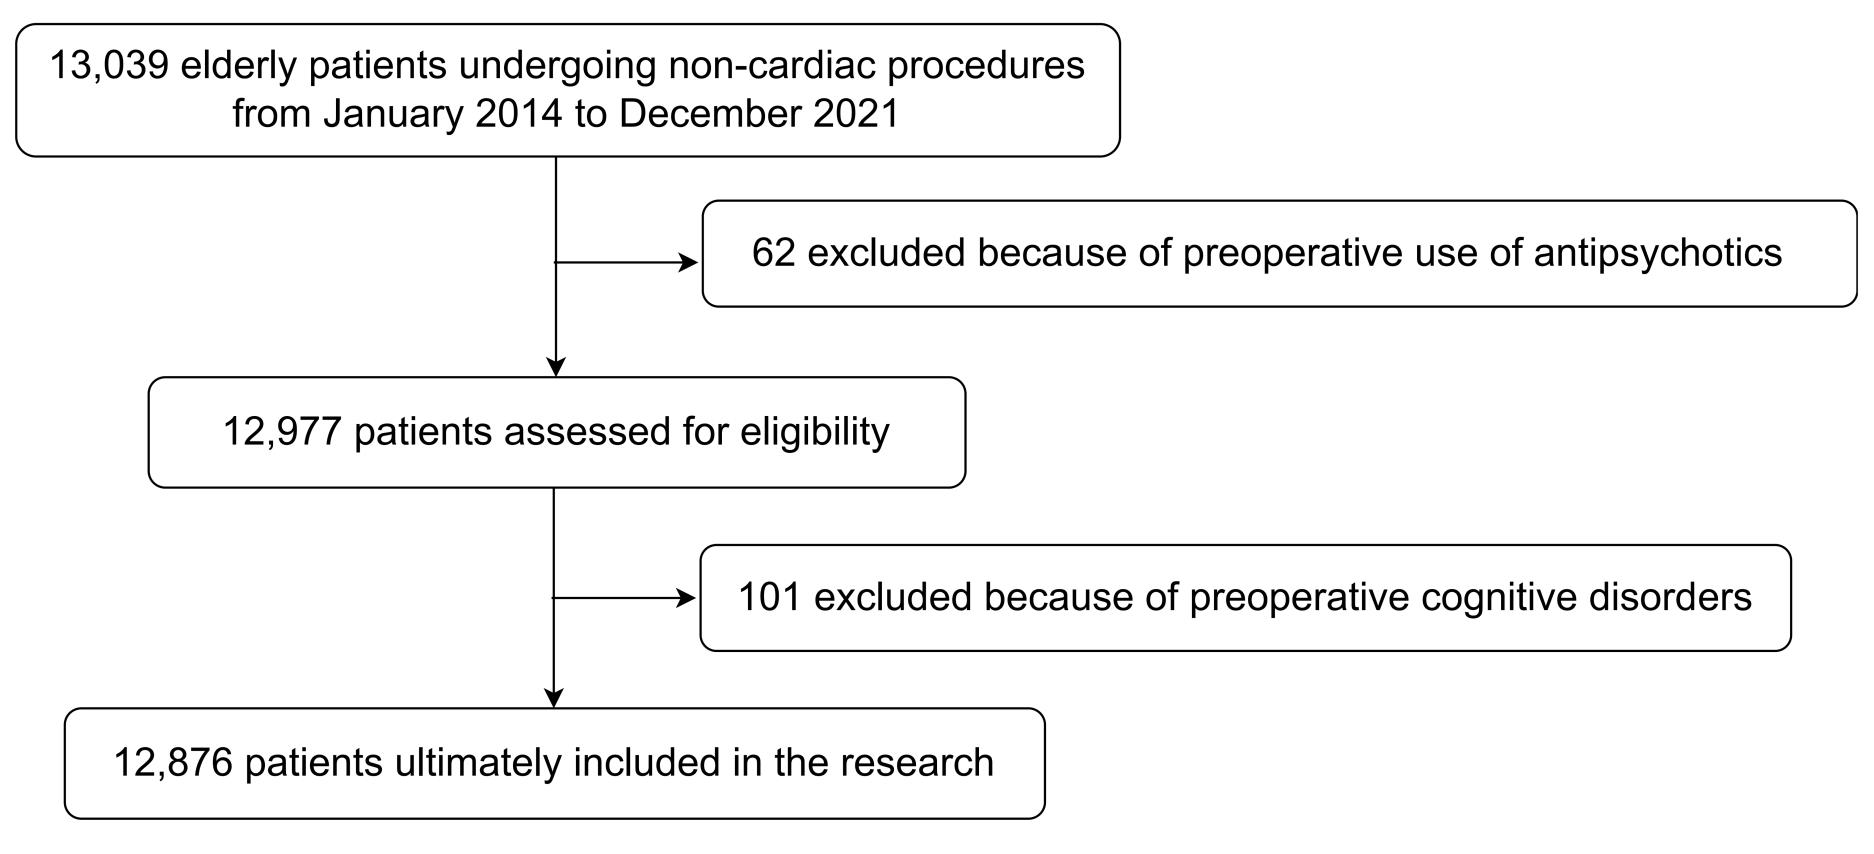
图1 研究人群筛选流程图
Fig.1 Flowchart of enrollment of patients with postoperative delirium in this study.
| Characteristics | Overall | Preoperative serum magnesium levels (mmol/L) | P | ||||
|---|---|---|---|---|---|---|---|
Quintile 1 (0.36-0.82) | Quintile 2 (0.82-0.87) | Quintile 3 (0.87-0.90) | Quintile 4 (0.90-0.94) | Quintile 5 (0.94-1.44) | |||
| Case (n) | 12 876 | 2322 | 2781 | 2278 | 2641 | 2854 | |
| sMg (mmol/L, Mean±SD) | 0.88±0.08 | 0.76±0.05 | 0.84±0.01 | 0.88±0.01 | 0.91±0.01 | 0.98±0.04 | <0.001 |
| Demographics | |||||||
| Age (year, median [IQR]) | 70 (67, 75) | 71 (67, 77) | 70 (67, 75) | 71 (67, 75) | 70 (67, 75) | 70 (67, 75) | <0.001 |
| Male | 6110 (47.5%) | 1125 (48.4%) | 1296 (46.6%) | 1092 (47.9%) | 1268 (48.0%) | 1329 (46.6%) | 0.529 |
| BMI (kg/m2, Mean±SD) | 24.6±3.9 | 24.2±4.1 | 24.8±4.0 | 24.8±3.9 | 24.7±3.8 | 24.5±3.8 | <0.001 |
| Comorbidities | |||||||
| Diabetes mellitus | 3373 (26.2%) | 855 (36.8%) | 786 (28.3%) | 553 (24.3%) | 584 (22.1%) | 595 (20.8%) | <0.001 |
| Cancer | 5158 (40.1%) | 901 (38.8%) | 1006 (36.2%) | 904 (39.7%) | 1101 (41.7%) | 1246 (43.7%) | <0.001 |
| Renal insufficiency | 309 (2.4%) | 69 (3.0%) | 64 (2.3%) | 41 (1.8%) | 50 (1.9%) | 85 (3.0%) | 0.008 |
| Liver cirrhosis | 389 (3.0%) | 80 (3.4%) | 93 (3.3%) | 61 (2.7%) | 73 (2.8%) | 82 (2.9%) | 0.387 |
| Laboratory measurements | |||||||
| CRP [mg/L (median, IQR)] | 0.43 (0.10, 1.59) | 0.77 (0.19, 3.00) | 0.42 (0.10, 1.59) | 0.37 (0.10, 1.24) | 0.37 (0.10, 1.18) | 0.42 (0.11, 1.40) | <0.001 |
| SCr (μmol/L, Mean±SD) | 75.35±42.48 | 73.41±35.74 | 72.05±27.39 | 73.89±32.44 | 74.35±33.44 | 82.33±66.83 | <0.001 |
| TBil (μmol/L, Mean±SD) | 20.77±41.85 | 24.88±48.79 | 20.81±43.62 | 18.81±35.98 | 19.17±36.62 | 20.45±42.65 | <0.001 |
| ALT (U/L, Mean±SD) | 25.99±50.93 | 31.59±93.86 | 25.15±45.43 | 24.49±32.40 | 24.49±27.41 | 24.82±31.02 | <0.001 |
| Albumin (g/L, Mean±SD) | 38.32±4.43 | 36.31±4.85 | 38.02±4.28 | 38.67±4.00 | 38.98±4.09 | 39.37±4.29 | <0.001 |
| sCa (mmol/L, Mean±SD) | 2.24±0.13 | 2.21±0.17 | 2.23±0.13 | 2.24±0.12 | 2.25±0.12 | 2.25±0.12 | <0.001 |
| Surgery-related factors | |||||||
| Emergency surgery | 1298 (5.9%) | 447 (11.2%) | 252 (5.2%) | 164 (4.3%) | 187 (4.1%) | 248 (5.1%) | <0.001 |
| Surgery specialty | <0.001 | ||||||
Otorhinolaryngology-head &neck, plastic,or abdominal wallsurgery | 1104 (8.6%) | 129 (5.6%) | 223 (8.0%) | 196 (8.6%) | 264 (10.0%) | 292 (10.2%) | |
| Obstetrics/gynecology | 80 (0.6%) | 21 (0.9%) | 21 (0.8%) | 11 (0.5%) | 12 (0.5%) | 15 (0.5%) | |
| Urology | 260 (2.0%) | 38 (1.6%) | 57 (2.0%) | 49 (2.2%) | 46 (1.7%) | 70 (2.5%) | |
| Hepatobiliary/pancreatic/ gastrointestinal | 4081 (31.7%) | 798 (34.4%) | 761 (27.4%) | 664 (29.1%) | 864 (32.7%) | 994 (34.8%) | |
| Vascular | 431 (3.3%) | 73 (3.1%) | 97 (3.5%) | 77 (3.4%) | 87 (3.3%) | 97 (3.4%) | |
| Orthopedic | 5940 (46.1%) | 1030 (44.4%) | 1417 (51.0%) | 1093 (48.0%) | 1193 (45.2%) | 1207 (42.3%) | |
| Endoscopic | 739 (5.7%) | 196 (8.4%) | 153 (5.5%) | 139 (6.1%) | 123 (4.7%) | 128 (4.5%) | |
| Thoracic | 241 (1.9%) | 37 (1.6%) | 52 (1.9%) | 49 (2.2%) | 52 (2.0%) | 51 (1.8%) | |
| Surgery duration (h, median [IQR]) | 2.08 (1.42, 3.17) | 2.04 (1.42, 3.08) | 2.05 (1.42, 3.08) | 2.08 (1.42, 3.17) | 2.08 (1.42, 3.25) | 2.17 (1.45, 3.25) | 0.445 |
| Outcome | |||||||
| POD | 685 (5.3%) | 218 (9.4%) | 146 (5.2%) | 111 (4.9%) | 99 (3.7%) | 111 (3.9%) | <0.001 |
表1 按术前血清镁水平五分位分组的基线特征
Tab.1 Baseline characteristics of the patients stratified by preoperative serum magnesium level quintiles
| Characteristics | Overall | Preoperative serum magnesium levels (mmol/L) | P | ||||
|---|---|---|---|---|---|---|---|
Quintile 1 (0.36-0.82) | Quintile 2 (0.82-0.87) | Quintile 3 (0.87-0.90) | Quintile 4 (0.90-0.94) | Quintile 5 (0.94-1.44) | |||
| Case (n) | 12 876 | 2322 | 2781 | 2278 | 2641 | 2854 | |
| sMg (mmol/L, Mean±SD) | 0.88±0.08 | 0.76±0.05 | 0.84±0.01 | 0.88±0.01 | 0.91±0.01 | 0.98±0.04 | <0.001 |
| Demographics | |||||||
| Age (year, median [IQR]) | 70 (67, 75) | 71 (67, 77) | 70 (67, 75) | 71 (67, 75) | 70 (67, 75) | 70 (67, 75) | <0.001 |
| Male | 6110 (47.5%) | 1125 (48.4%) | 1296 (46.6%) | 1092 (47.9%) | 1268 (48.0%) | 1329 (46.6%) | 0.529 |
| BMI (kg/m2, Mean±SD) | 24.6±3.9 | 24.2±4.1 | 24.8±4.0 | 24.8±3.9 | 24.7±3.8 | 24.5±3.8 | <0.001 |
| Comorbidities | |||||||
| Diabetes mellitus | 3373 (26.2%) | 855 (36.8%) | 786 (28.3%) | 553 (24.3%) | 584 (22.1%) | 595 (20.8%) | <0.001 |
| Cancer | 5158 (40.1%) | 901 (38.8%) | 1006 (36.2%) | 904 (39.7%) | 1101 (41.7%) | 1246 (43.7%) | <0.001 |
| Renal insufficiency | 309 (2.4%) | 69 (3.0%) | 64 (2.3%) | 41 (1.8%) | 50 (1.9%) | 85 (3.0%) | 0.008 |
| Liver cirrhosis | 389 (3.0%) | 80 (3.4%) | 93 (3.3%) | 61 (2.7%) | 73 (2.8%) | 82 (2.9%) | 0.387 |
| Laboratory measurements | |||||||
| CRP [mg/L (median, IQR)] | 0.43 (0.10, 1.59) | 0.77 (0.19, 3.00) | 0.42 (0.10, 1.59) | 0.37 (0.10, 1.24) | 0.37 (0.10, 1.18) | 0.42 (0.11, 1.40) | <0.001 |
| SCr (μmol/L, Mean±SD) | 75.35±42.48 | 73.41±35.74 | 72.05±27.39 | 73.89±32.44 | 74.35±33.44 | 82.33±66.83 | <0.001 |
| TBil (μmol/L, Mean±SD) | 20.77±41.85 | 24.88±48.79 | 20.81±43.62 | 18.81±35.98 | 19.17±36.62 | 20.45±42.65 | <0.001 |
| ALT (U/L, Mean±SD) | 25.99±50.93 | 31.59±93.86 | 25.15±45.43 | 24.49±32.40 | 24.49±27.41 | 24.82±31.02 | <0.001 |
| Albumin (g/L, Mean±SD) | 38.32±4.43 | 36.31±4.85 | 38.02±4.28 | 38.67±4.00 | 38.98±4.09 | 39.37±4.29 | <0.001 |
| sCa (mmol/L, Mean±SD) | 2.24±0.13 | 2.21±0.17 | 2.23±0.13 | 2.24±0.12 | 2.25±0.12 | 2.25±0.12 | <0.001 |
| Surgery-related factors | |||||||
| Emergency surgery | 1298 (5.9%) | 447 (11.2%) | 252 (5.2%) | 164 (4.3%) | 187 (4.1%) | 248 (5.1%) | <0.001 |
| Surgery specialty | <0.001 | ||||||
Otorhinolaryngology-head &neck, plastic,or abdominal wallsurgery | 1104 (8.6%) | 129 (5.6%) | 223 (8.0%) | 196 (8.6%) | 264 (10.0%) | 292 (10.2%) | |
| Obstetrics/gynecology | 80 (0.6%) | 21 (0.9%) | 21 (0.8%) | 11 (0.5%) | 12 (0.5%) | 15 (0.5%) | |
| Urology | 260 (2.0%) | 38 (1.6%) | 57 (2.0%) | 49 (2.2%) | 46 (1.7%) | 70 (2.5%) | |
| Hepatobiliary/pancreatic/ gastrointestinal | 4081 (31.7%) | 798 (34.4%) | 761 (27.4%) | 664 (29.1%) | 864 (32.7%) | 994 (34.8%) | |
| Vascular | 431 (3.3%) | 73 (3.1%) | 97 (3.5%) | 77 (3.4%) | 87 (3.3%) | 97 (3.4%) | |
| Orthopedic | 5940 (46.1%) | 1030 (44.4%) | 1417 (51.0%) | 1093 (48.0%) | 1193 (45.2%) | 1207 (42.3%) | |
| Endoscopic | 739 (5.7%) | 196 (8.4%) | 153 (5.5%) | 139 (6.1%) | 123 (4.7%) | 128 (4.5%) | |
| Thoracic | 241 (1.9%) | 37 (1.6%) | 52 (1.9%) | 49 (2.2%) | 52 (2.0%) | 51 (1.8%) | |
| Surgery duration (h, median [IQR]) | 2.08 (1.42, 3.17) | 2.04 (1.42, 3.08) | 2.05 (1.42, 3.08) | 2.08 (1.42, 3.17) | 2.08 (1.42, 3.25) | 2.17 (1.45, 3.25) | 0.445 |
| Outcome | |||||||
| POD | 685 (5.3%) | 218 (9.4%) | 146 (5.2%) | 111 (4.9%) | 99 (3.7%) | 111 (3.9%) | <0.001 |
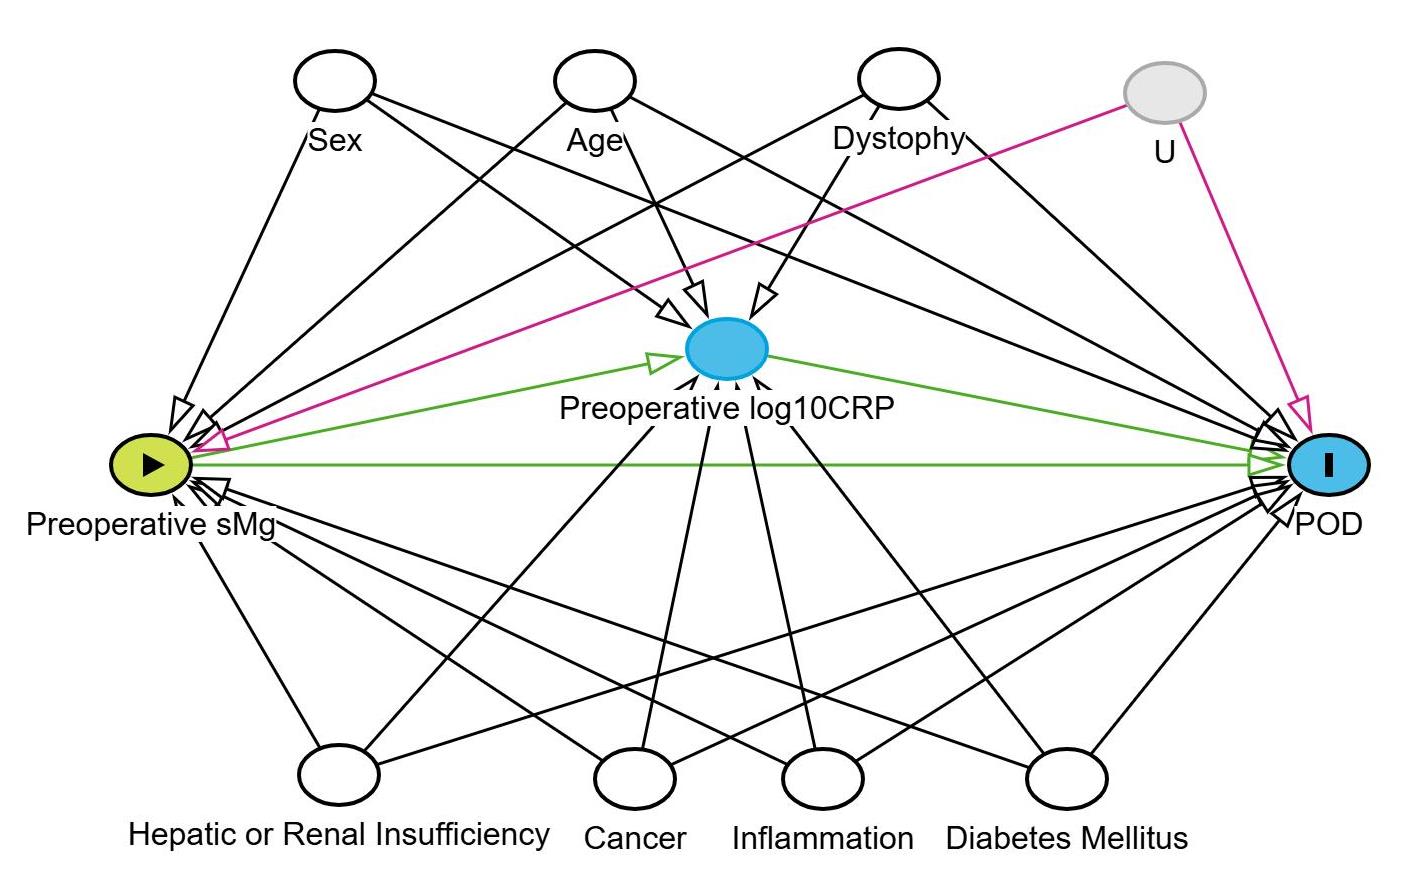
图2 描述协变量、主要暴露因素与结局之间关系的有向无环图(DAG)
Fig.2 Directed acyclic graph showing associations among the covariates, primary exposure, and the outcome. White circles denote ancestors of both the exposure and outcome that have been controlled as confounders, blue circles represent the outcome and its causal direct determinants, green circle symbolizes the exposure variable, and the gray circle denotes variables that are unobserved. The causal relationships are depicted by green lines, and gray lines illustrate the paths of bias that have been accounted for. Conversely, pink lines highlight the biasing paths that remain unadjusted due to latent variables. OR: Odds ratio; CI: Confidence interval; U: Unmeasured confounders.
| Variables | Events [n (%)] | Model 1a | Model 2b | Model 3c | |||
|---|---|---|---|---|---|---|---|
| (P trend=0.004) | (P trend=0.054) | (P trend=0.036) | |||||
| OR (95% CI) | P | OR (95% CI) | P | OR (95% CI) | P | ||
| Continuous | |||||||
| Standardized sMg | 685 (5.3%) | 0.71 (0.66, 0.76) | <0.001 | 0.83 (0.77, 0.89) | <0.001 | 0.84 (0.78, 0.90) | <0.001 |
| Categoricale | |||||||
| Quintile 1 | 218 (9.4%) | 2.66 (2.09, 3.41) | <0.001 | 1.81 (1.41, 2.35) | <0.001 | 1.77 (1.37, 2.29) | <0.001 |
| Quintile 2 | 146 (5.2%) | 1.42 (1.10, 1.85) | 0.008 | 1.26 (0.97, 1.65) | 0.091 | 1.25 (0.96, 1.64) | 0.097 |
| Quintile 3 | 111 (4.9%) | 1.32 (1.00, 1.74) | 0.052 | 1.27 (0.96, 1.68) | 0.096 | 1.27 (0.96, 1.69) | 0.096 |
| Quintile 4 | 99 (3.7%) | 1 (reference) | 1 (reference) | 1 (reference) | |||
| Quintile 5 | 111 (3.9%) | 1.04 (0.79, 1.37) | 0.786 | 1.06 (0.80, 1.40) | 0.708 | 1.01 (0.76, 1.34) | 0.941 |
表2 术前血清镁水平与术后谵妄风险的单多因素Logistic回归分析
Tab.2 Association between preoperative sMg levels and POD risk in univariate and multivariable logistic regression models
| Variables | Events [n (%)] | Model 1a | Model 2b | Model 3c | |||
|---|---|---|---|---|---|---|---|
| (P trend=0.004) | (P trend=0.054) | (P trend=0.036) | |||||
| OR (95% CI) | P | OR (95% CI) | P | OR (95% CI) | P | ||
| Continuous | |||||||
| Standardized sMg | 685 (5.3%) | 0.71 (0.66, 0.76) | <0.001 | 0.83 (0.77, 0.89) | <0.001 | 0.84 (0.78, 0.90) | <0.001 |
| Categoricale | |||||||
| Quintile 1 | 218 (9.4%) | 2.66 (2.09, 3.41) | <0.001 | 1.81 (1.41, 2.35) | <0.001 | 1.77 (1.37, 2.29) | <0.001 |
| Quintile 2 | 146 (5.2%) | 1.42 (1.10, 1.85) | 0.008 | 1.26 (0.97, 1.65) | 0.091 | 1.25 (0.96, 1.64) | 0.097 |
| Quintile 3 | 111 (4.9%) | 1.32 (1.00, 1.74) | 0.052 | 1.27 (0.96, 1.68) | 0.096 | 1.27 (0.96, 1.69) | 0.096 |
| Quintile 4 | 99 (3.7%) | 1 (reference) | 1 (reference) | 1 (reference) | |||
| Quintile 5 | 111 (3.9%) | 1.04 (0.79, 1.37) | 0.786 | 1.06 (0.80, 1.40) | 0.708 | 1.01 (0.76, 1.34) | 0.941 |
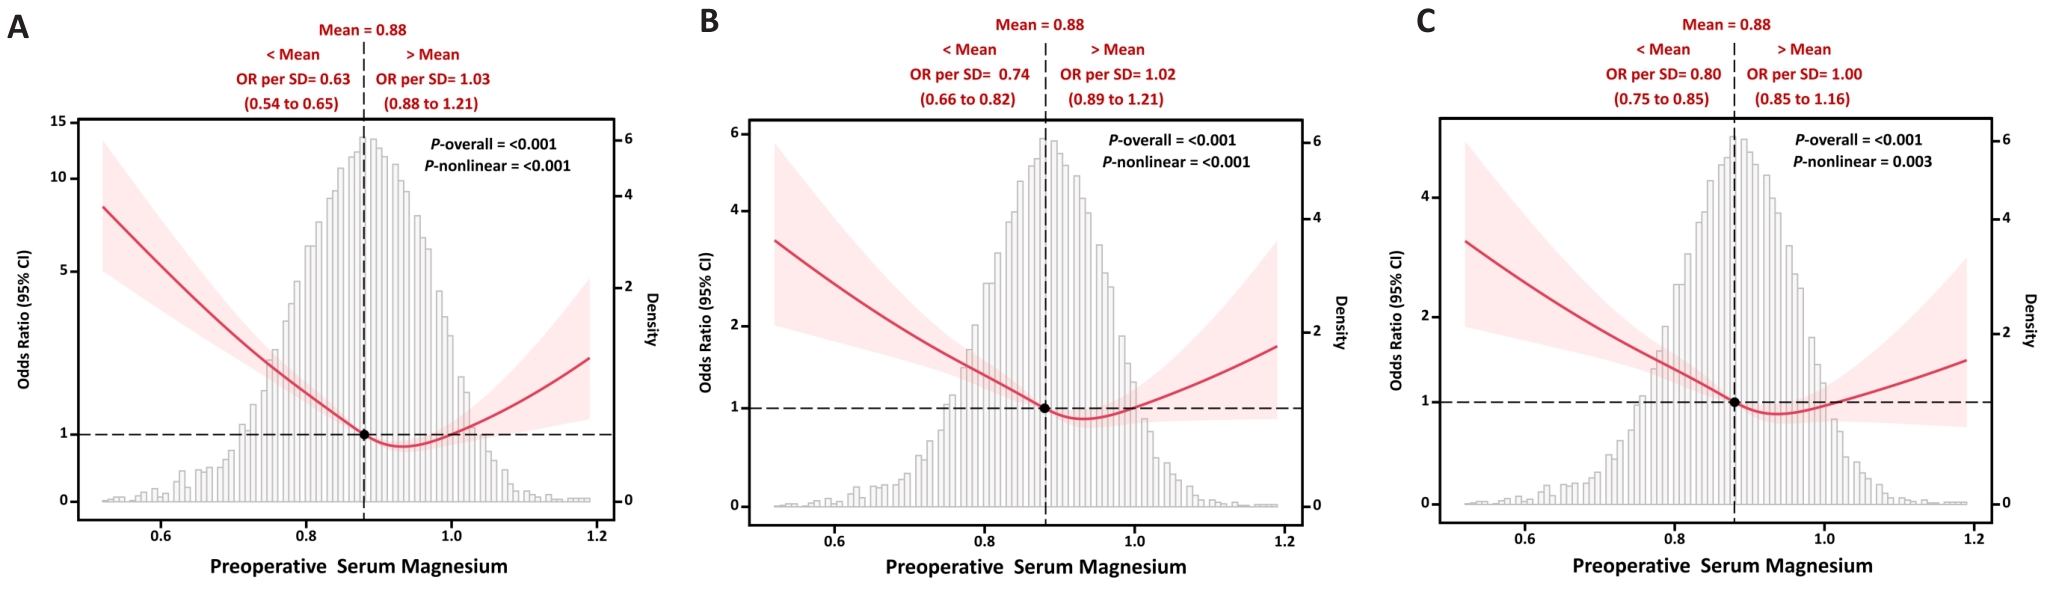
图3 基于连续变量的术前血清镁水平与术后谵妄风险的非线性关系
Fig.3 Association between preoperative sMg levels and POD risk on continuous scales. A: Model 1 (unadjusted model). B: Model 2 (multivariable model adjusted for age, sex, BMI, albumin, TBil, ALT, diabetes mellitus, cancer and renal insufficiency). C: Model 3 (multivariable model additionally adjusted for CRP levels as a potential mediator). ORs are indicated by blue solid lines and 95% CIs by light blue dotted lines. Reference lines for no association are indicated by the blackdotted lines at an OR of 1.0. Density plots are presented by gray shadow area to show the fraction of the population with different levels of sMg. sMg level corresponding to the OR equal to 1 (reference value) is shown by dark spot.
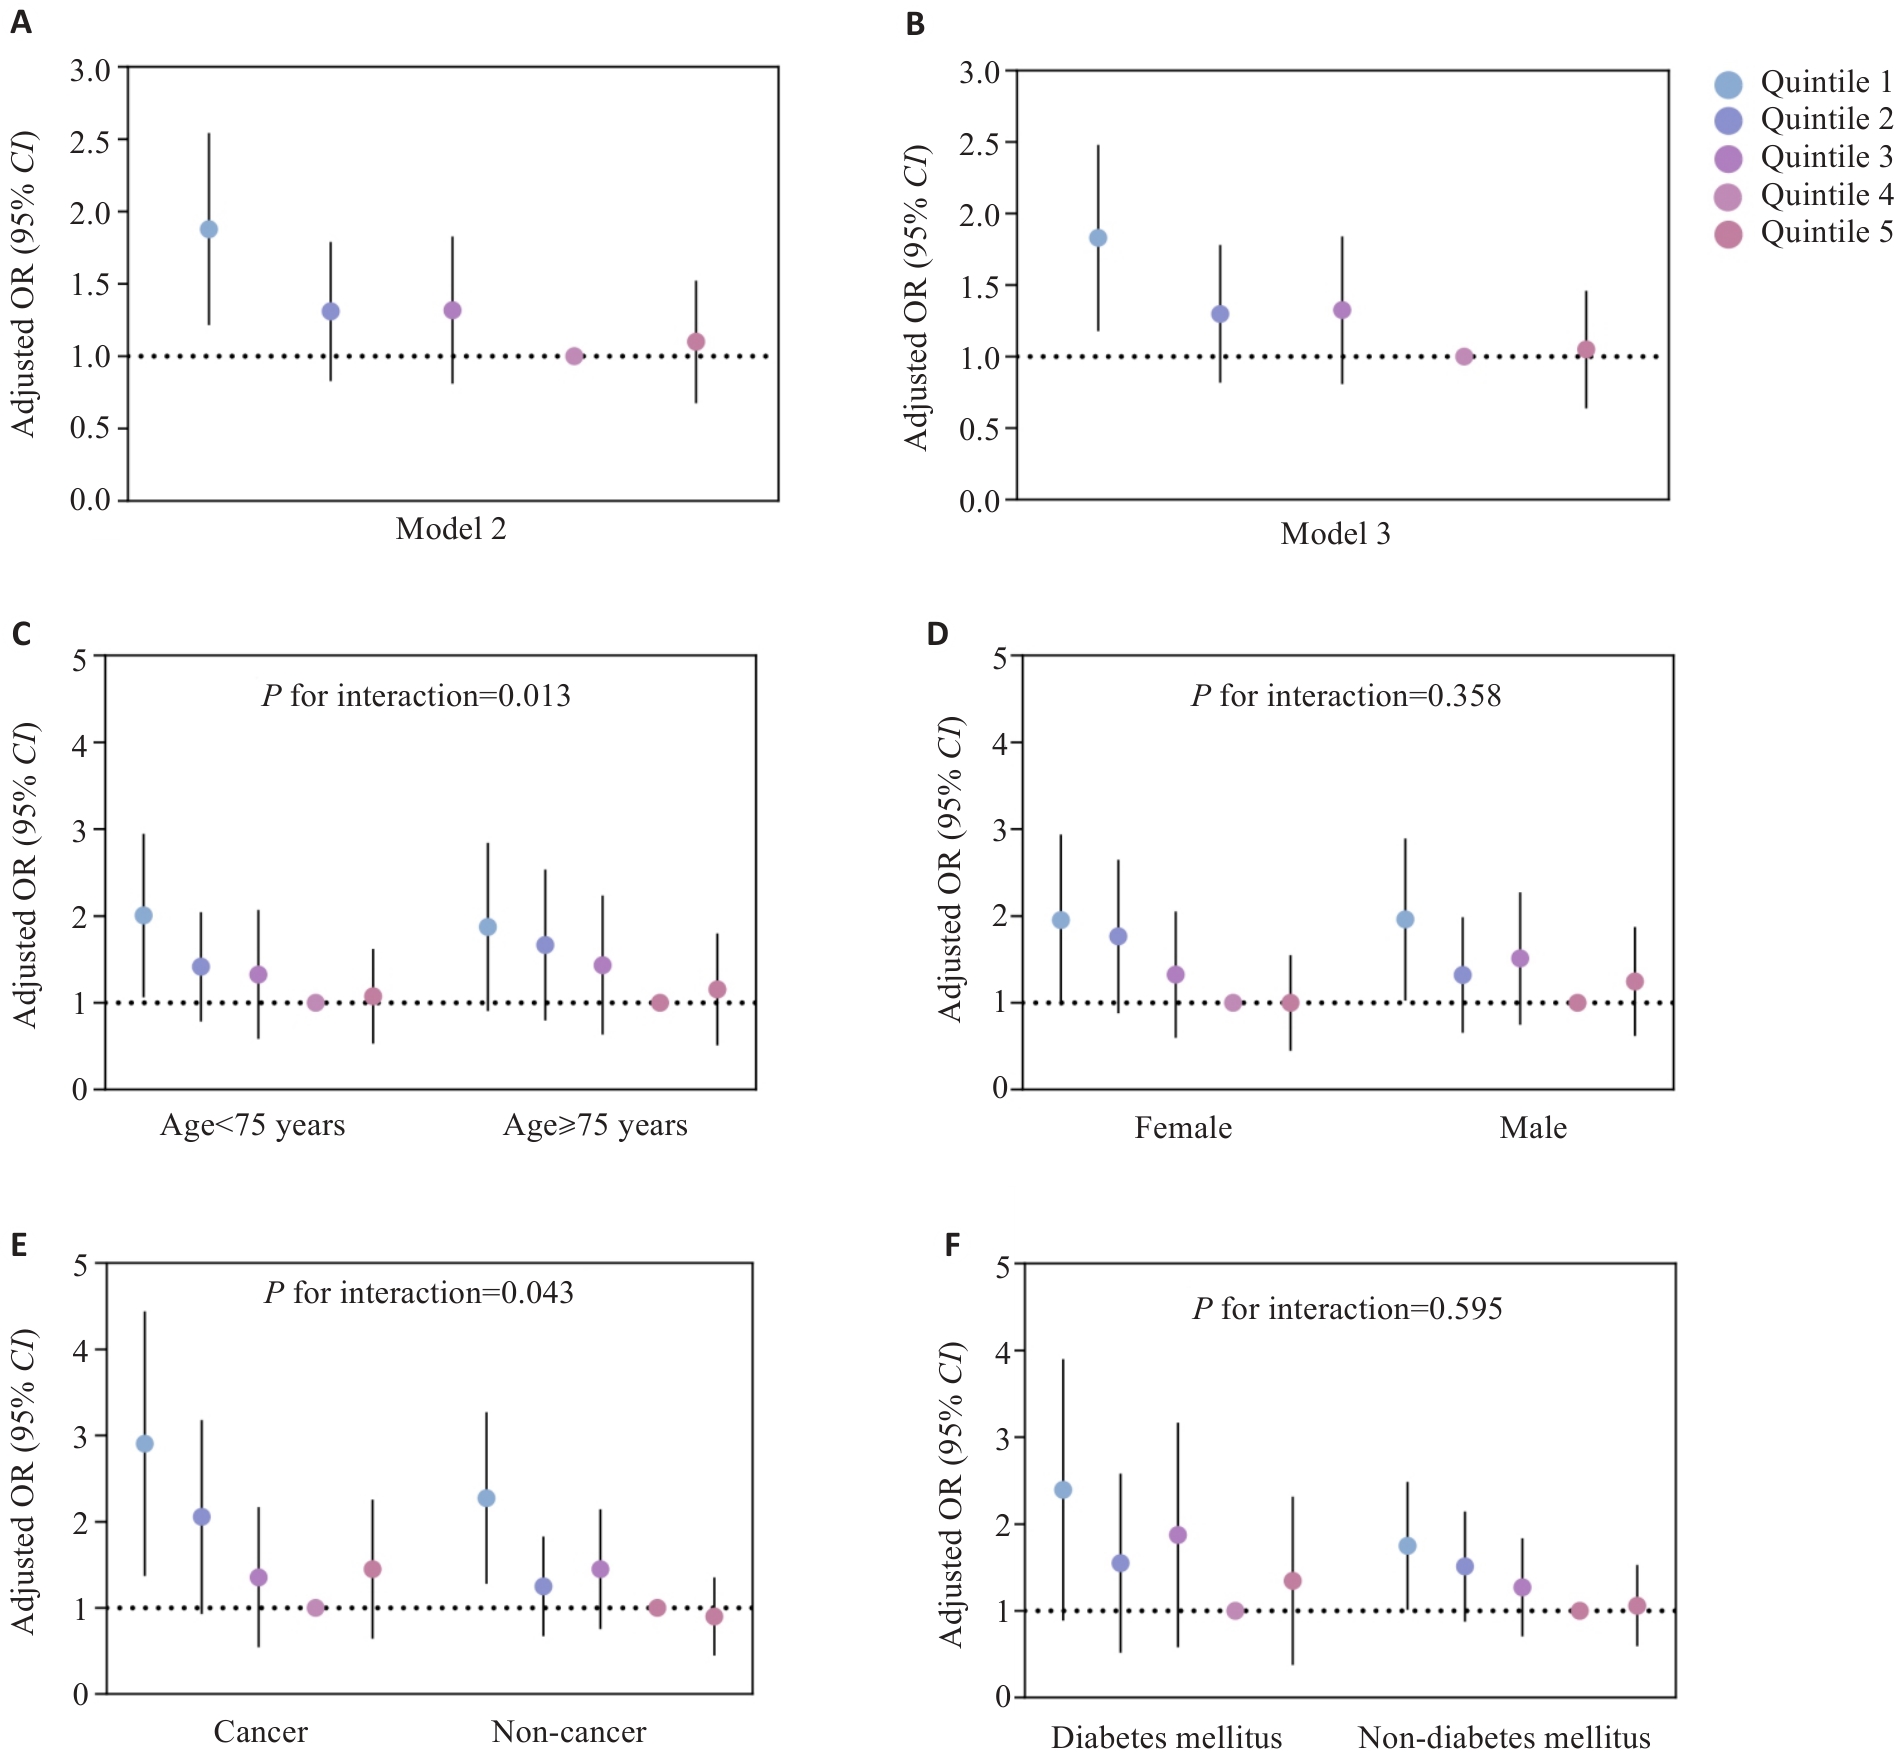
图4 基于五分位分组的术前血清镁水平与术后谵妄风险的关系
Fig.4 Association between preoperative sMg levels and POD risk based on quintile analyses. Forest plots show associations in the overall population (A, B) and subgroups (C-F). Subgroup analyses were adjusted as in model 2.
| Subgroup | OR (95% CI) of serum magnesium quintiles | P for trend | P for interaction | ||||
|---|---|---|---|---|---|---|---|
| Quintile 1 | Quintile 2 | Quintile 3 | Quintile 4 | Quintile 5 | |||
| Age (year) | 0.013 | ||||||
| <75 (n=9169) | 1.88 (1.34, 2.67) | 1.30 (0.91, 1.86) | 1.27 (0.87, 1.85) | 1 (reference) | 1.01 (0.69, 1.46) | 0.018 | |
| ≥75 (n=3707) | 1.73 (1.19, 2.56) | 1.54 (1.05, 2.28) | 1.32 (0.87, 2.00) | 1 (reference) | 1.06 (0.70, 1.61) | 0.138 | |
| Gender | 0.358 | ||||||
| Male (n=6110) | 1.84 (1.30, 2.62) | 1.23 (0.85, 1.79) | 1.40 (0.97, 2.05) | 1 (reference) | 1.16 (0.80, 1.69) | 0.150 | |
| Female (n=6766) | 1.81 (1.26, 2.65) | 1.64 (1.14, 2.39) | 1.22 (0.81, 1.84) | 1 (reference) | 0.92 (0.61, 1.39) | 0.011 | |
| Diabetes mellitus | 0.595 | ||||||
| No (n=9503) | 1.67 (1.23, 2.27) | 1.44 (1.06, 1.96) | 1.20 (0.87, 1.67) | 1 (reference) | 1.01 (0.73, 1.39) | 0.023 | |
| Yes (n=3373) | 2.15 (1.33, 3.46) | 1.35 (0.82, 2.28) | 1.62 (0.96, 2.79) | 1 (reference) | 1.15 (0.66, 2.03) | 0.166 | |
| Cancer | 0.043 | ||||||
| No (n=7718) | 2.15 (1.57, 2.98) | 1.18 (0.84, 1.66) | 1.36 (0.96, 1.94) | 1 (reference) | 0.84 (0.58, 1.22) | 0.025 | |
| Yes (n=5158) | 2.67 (1.82, 3.99) | 1.88 (1.26, 2.85) | 1.23 (0.78, 1.93) | 1 (reference) | 1.33 (0.88, 2.02) | 0.076 | |
表3 基于五分位分组的术前血清镁水平与术后谵妄风险的关系
Tab.3 Associations between preoperative sMg levels and POD risk based on quintile analysis
| Subgroup | OR (95% CI) of serum magnesium quintiles | P for trend | P for interaction | ||||
|---|---|---|---|---|---|---|---|
| Quintile 1 | Quintile 2 | Quintile 3 | Quintile 4 | Quintile 5 | |||
| Age (year) | 0.013 | ||||||
| <75 (n=9169) | 1.88 (1.34, 2.67) | 1.30 (0.91, 1.86) | 1.27 (0.87, 1.85) | 1 (reference) | 1.01 (0.69, 1.46) | 0.018 | |
| ≥75 (n=3707) | 1.73 (1.19, 2.56) | 1.54 (1.05, 2.28) | 1.32 (0.87, 2.00) | 1 (reference) | 1.06 (0.70, 1.61) | 0.138 | |
| Gender | 0.358 | ||||||
| Male (n=6110) | 1.84 (1.30, 2.62) | 1.23 (0.85, 1.79) | 1.40 (0.97, 2.05) | 1 (reference) | 1.16 (0.80, 1.69) | 0.150 | |
| Female (n=6766) | 1.81 (1.26, 2.65) | 1.64 (1.14, 2.39) | 1.22 (0.81, 1.84) | 1 (reference) | 0.92 (0.61, 1.39) | 0.011 | |
| Diabetes mellitus | 0.595 | ||||||
| No (n=9503) | 1.67 (1.23, 2.27) | 1.44 (1.06, 1.96) | 1.20 (0.87, 1.67) | 1 (reference) | 1.01 (0.73, 1.39) | 0.023 | |
| Yes (n=3373) | 2.15 (1.33, 3.46) | 1.35 (0.82, 2.28) | 1.62 (0.96, 2.79) | 1 (reference) | 1.15 (0.66, 2.03) | 0.166 | |
| Cancer | 0.043 | ||||||
| No (n=7718) | 2.15 (1.57, 2.98) | 1.18 (0.84, 1.66) | 1.36 (0.96, 1.94) | 1 (reference) | 0.84 (0.58, 1.22) | 0.025 | |
| Yes (n=5158) | 2.67 (1.82, 3.99) | 1.88 (1.26, 2.85) | 1.23 (0.78, 1.93) | 1 (reference) | 1.33 (0.88, 2.02) | 0.076 | |
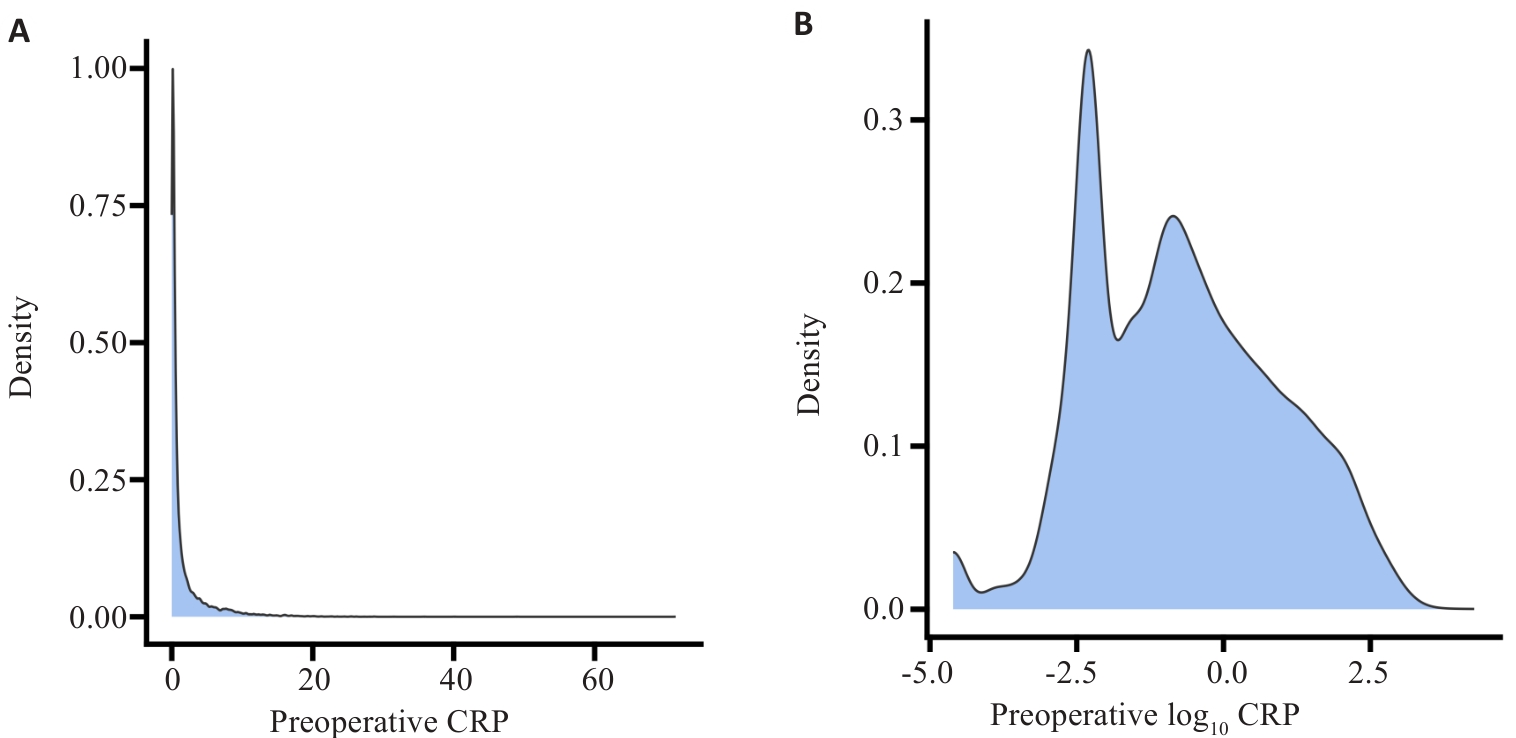
图5 CRP水平对数转换前后的分布图
Fig.5 Distribution of CRP levels before and after logarithmic transformation. A: Histogram of the distribution of preoperative CRP levels. B: Histogram of the distribution of preoperative log10 CRP levels.
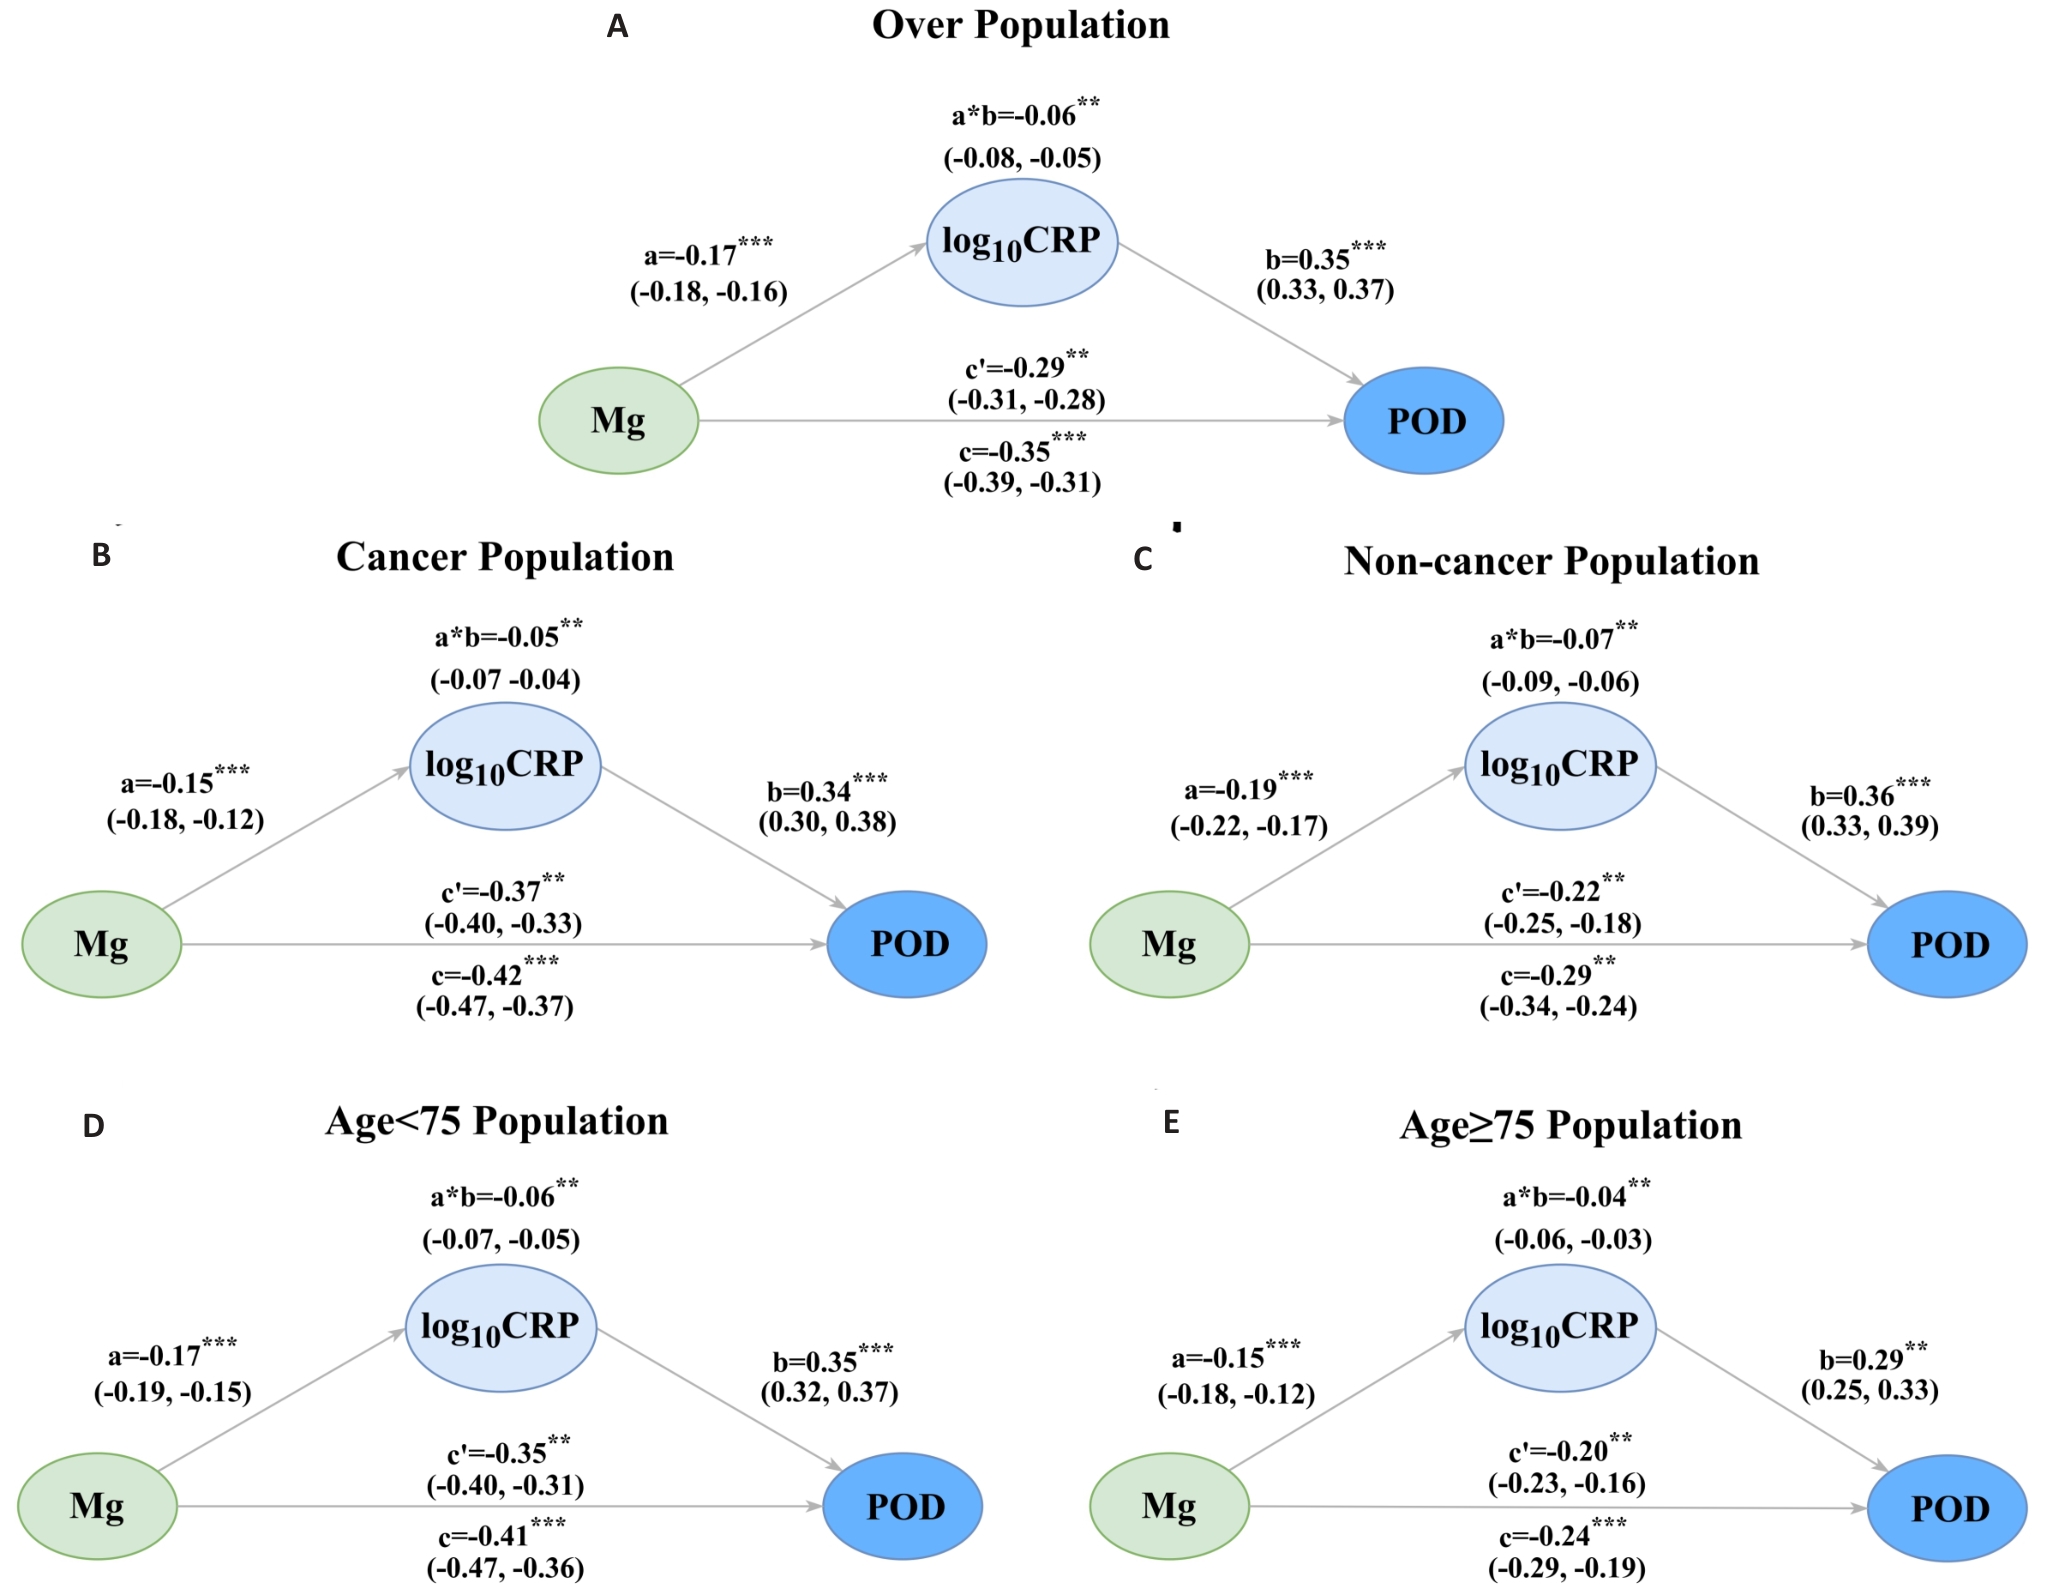
图6 以log₁₀CRP为中介的术前血清镁水平与术后谵妄风险的中介效应分析
Fig.6 Mediation analyses of the associations between preoperative serum magnesium levels and POD risk through log10CRP levels. Mediation analyses were conducted in the overall population (A) and in key subgroups, including cancer (B), non-cancer (C), age <75 years (D), and age ≥75 years (E) Mediation groups. Subgroup analyses were adjusted as in model 2. a=the effects of sMg on log10 CRP; b=the effects of log10 CRP on POD Risk. a*b: the indirect effect; c: the total effect; c': the direct effect. **P<0.01,***P<0.001.
Pathways sMg→log10 CRP→POD | c | P | c' | P | a*b | P | a | P | b | P | |ab/c| |
|---|---|---|---|---|---|---|---|---|---|---|---|
| Overall | -0.35 | <0.001 | -0.29 | <0.001 | -0.06 | 0.007 | -0.17 | <0.001 | 0.35 | <0.001 | 17.14% |
| Age (year) | |||||||||||
| <75 | -0.41 | <0.001 | -0.35 | 0.006 | -0.06 | <0.001 | -0.17 | <0.001 | 0.35 | <0.001 | 14.63% |
| ≥75 | -0.24 | 0.005 | -0.20 | 0.008 | -0.04 | 0.006 | -0.25 | 0.005 | 0.29 | <0.001 | 16.67% |
| Cancer | |||||||||||
| Absent | -0.29 | 0.015 | -0.22 | 0.003 | -0.07 | 0.008 | -0.19 | <0.001 | 0.36 | <0.001 | 24.14% |
| Present | -0.42 | <0.001 | -0.37 | <0.001 | -0.05 | 0.010 | -0.17 | <0.001 | 0.35 | <0.001 | 11.90% |
表4 总体及各亚组中CRP的中介效应分析结果
Tab.4 Mediation analysis in the overall population and subgroups
Pathways sMg→log10 CRP→POD | c | P | c' | P | a*b | P | a | P | b | P | |ab/c| |
|---|---|---|---|---|---|---|---|---|---|---|---|
| Overall | -0.35 | <0.001 | -0.29 | <0.001 | -0.06 | 0.007 | -0.17 | <0.001 | 0.35 | <0.001 | 17.14% |
| Age (year) | |||||||||||
| <75 | -0.41 | <0.001 | -0.35 | 0.006 | -0.06 | <0.001 | -0.17 | <0.001 | 0.35 | <0.001 | 14.63% |
| ≥75 | -0.24 | 0.005 | -0.20 | 0.008 | -0.04 | 0.006 | -0.25 | 0.005 | 0.29 | <0.001 | 16.67% |
| Cancer | |||||||||||
| Absent | -0.29 | 0.015 | -0.22 | 0.003 | -0.07 | 0.008 | -0.19 | <0.001 | 0.36 | <0.001 | 24.14% |
| Present | -0.42 | <0.001 | -0.37 | <0.001 | -0.05 | 0.010 | -0.17 | <0.001 | 0.35 | <0.001 | 11.90% |
| Analysis | OR (95% CI) | P for trend | ||||
|---|---|---|---|---|---|---|
Quintile 1 (0.36-0.82) | Quintile 2 (0.82-0.87) | Quintile 3 (0.87-0.90) | Quintile 4 (0.90-0.94) | Quintile 5 (0.94-1.44) | ||
| Primary analysis | 1.81 (1.41, 2.35) | 1.26 (0.97, 1.65) | 1.27 (0.96, 1.68) | 1 (reference) | 1.06 (0.80, 1.40) | 0.054 |
| Sensitivity analysis | ||||||
Additional adjustment for major intraoperative factorsa (n=12 876) | 1.89 (1.47, 2.45) | 1.26 (0.97, 1.65) | 1.30 (0.98, 1.72) | 1 (reference) | 1.05 (0.80, 1.40) | 0.175 |
Excluding patients with confounders missing (n=12 570) | 1.79 (1.37, 2.29) | 1.25 (0.96, 1.64) | 1.29 (0.96,1.69) | 1 (reference) | 1.03 (0.75,1.32) | 0.188 |
| Excluding patients with dystrophy (n=12 246) | 1.81 (1.39, 2.37) | 1.28 (0.97, 1.69) | 1.29 (0.97, 1.73) | 1 (reference) | 1.04 (0.78, 1.40) | 0.240 |
Excluding patients with inflammation, hepatic or renal insufficiency (n=12 156) | 1.92 (1.48, 2.52) | 1.30 (0.99, 1.72) | 1.26 (0.93, 1.69) | 1 (reference) | 1.04 (0.77, 1.40) | 0.124 |
表5 术前血清镁水平与术后谵妄风险关系的敏感性分析
Tab.5 Sensitivity analysis for associations between preoperative serum magnesium levels and POD risk
| Analysis | OR (95% CI) | P for trend | ||||
|---|---|---|---|---|---|---|
Quintile 1 (0.36-0.82) | Quintile 2 (0.82-0.87) | Quintile 3 (0.87-0.90) | Quintile 4 (0.90-0.94) | Quintile 5 (0.94-1.44) | ||
| Primary analysis | 1.81 (1.41, 2.35) | 1.26 (0.97, 1.65) | 1.27 (0.96, 1.68) | 1 (reference) | 1.06 (0.80, 1.40) | 0.054 |
| Sensitivity analysis | ||||||
Additional adjustment for major intraoperative factorsa (n=12 876) | 1.89 (1.47, 2.45) | 1.26 (0.97, 1.65) | 1.30 (0.98, 1.72) | 1 (reference) | 1.05 (0.80, 1.40) | 0.175 |
Excluding patients with confounders missing (n=12 570) | 1.79 (1.37, 2.29) | 1.25 (0.96, 1.64) | 1.29 (0.96,1.69) | 1 (reference) | 1.03 (0.75,1.32) | 0.188 |
| Excluding patients with dystrophy (n=12 246) | 1.81 (1.39, 2.37) | 1.28 (0.97, 1.69) | 1.29 (0.97, 1.73) | 1 (reference) | 1.04 (0.78, 1.40) | 0.240 |
Excluding patients with inflammation, hepatic or renal insufficiency (n=12 156) | 1.92 (1.48, 2.52) | 1.30 (0.99, 1.72) | 1.26 (0.93, 1.69) | 1 (reference) | 1.04 (0.77, 1.40) | 0.124 |
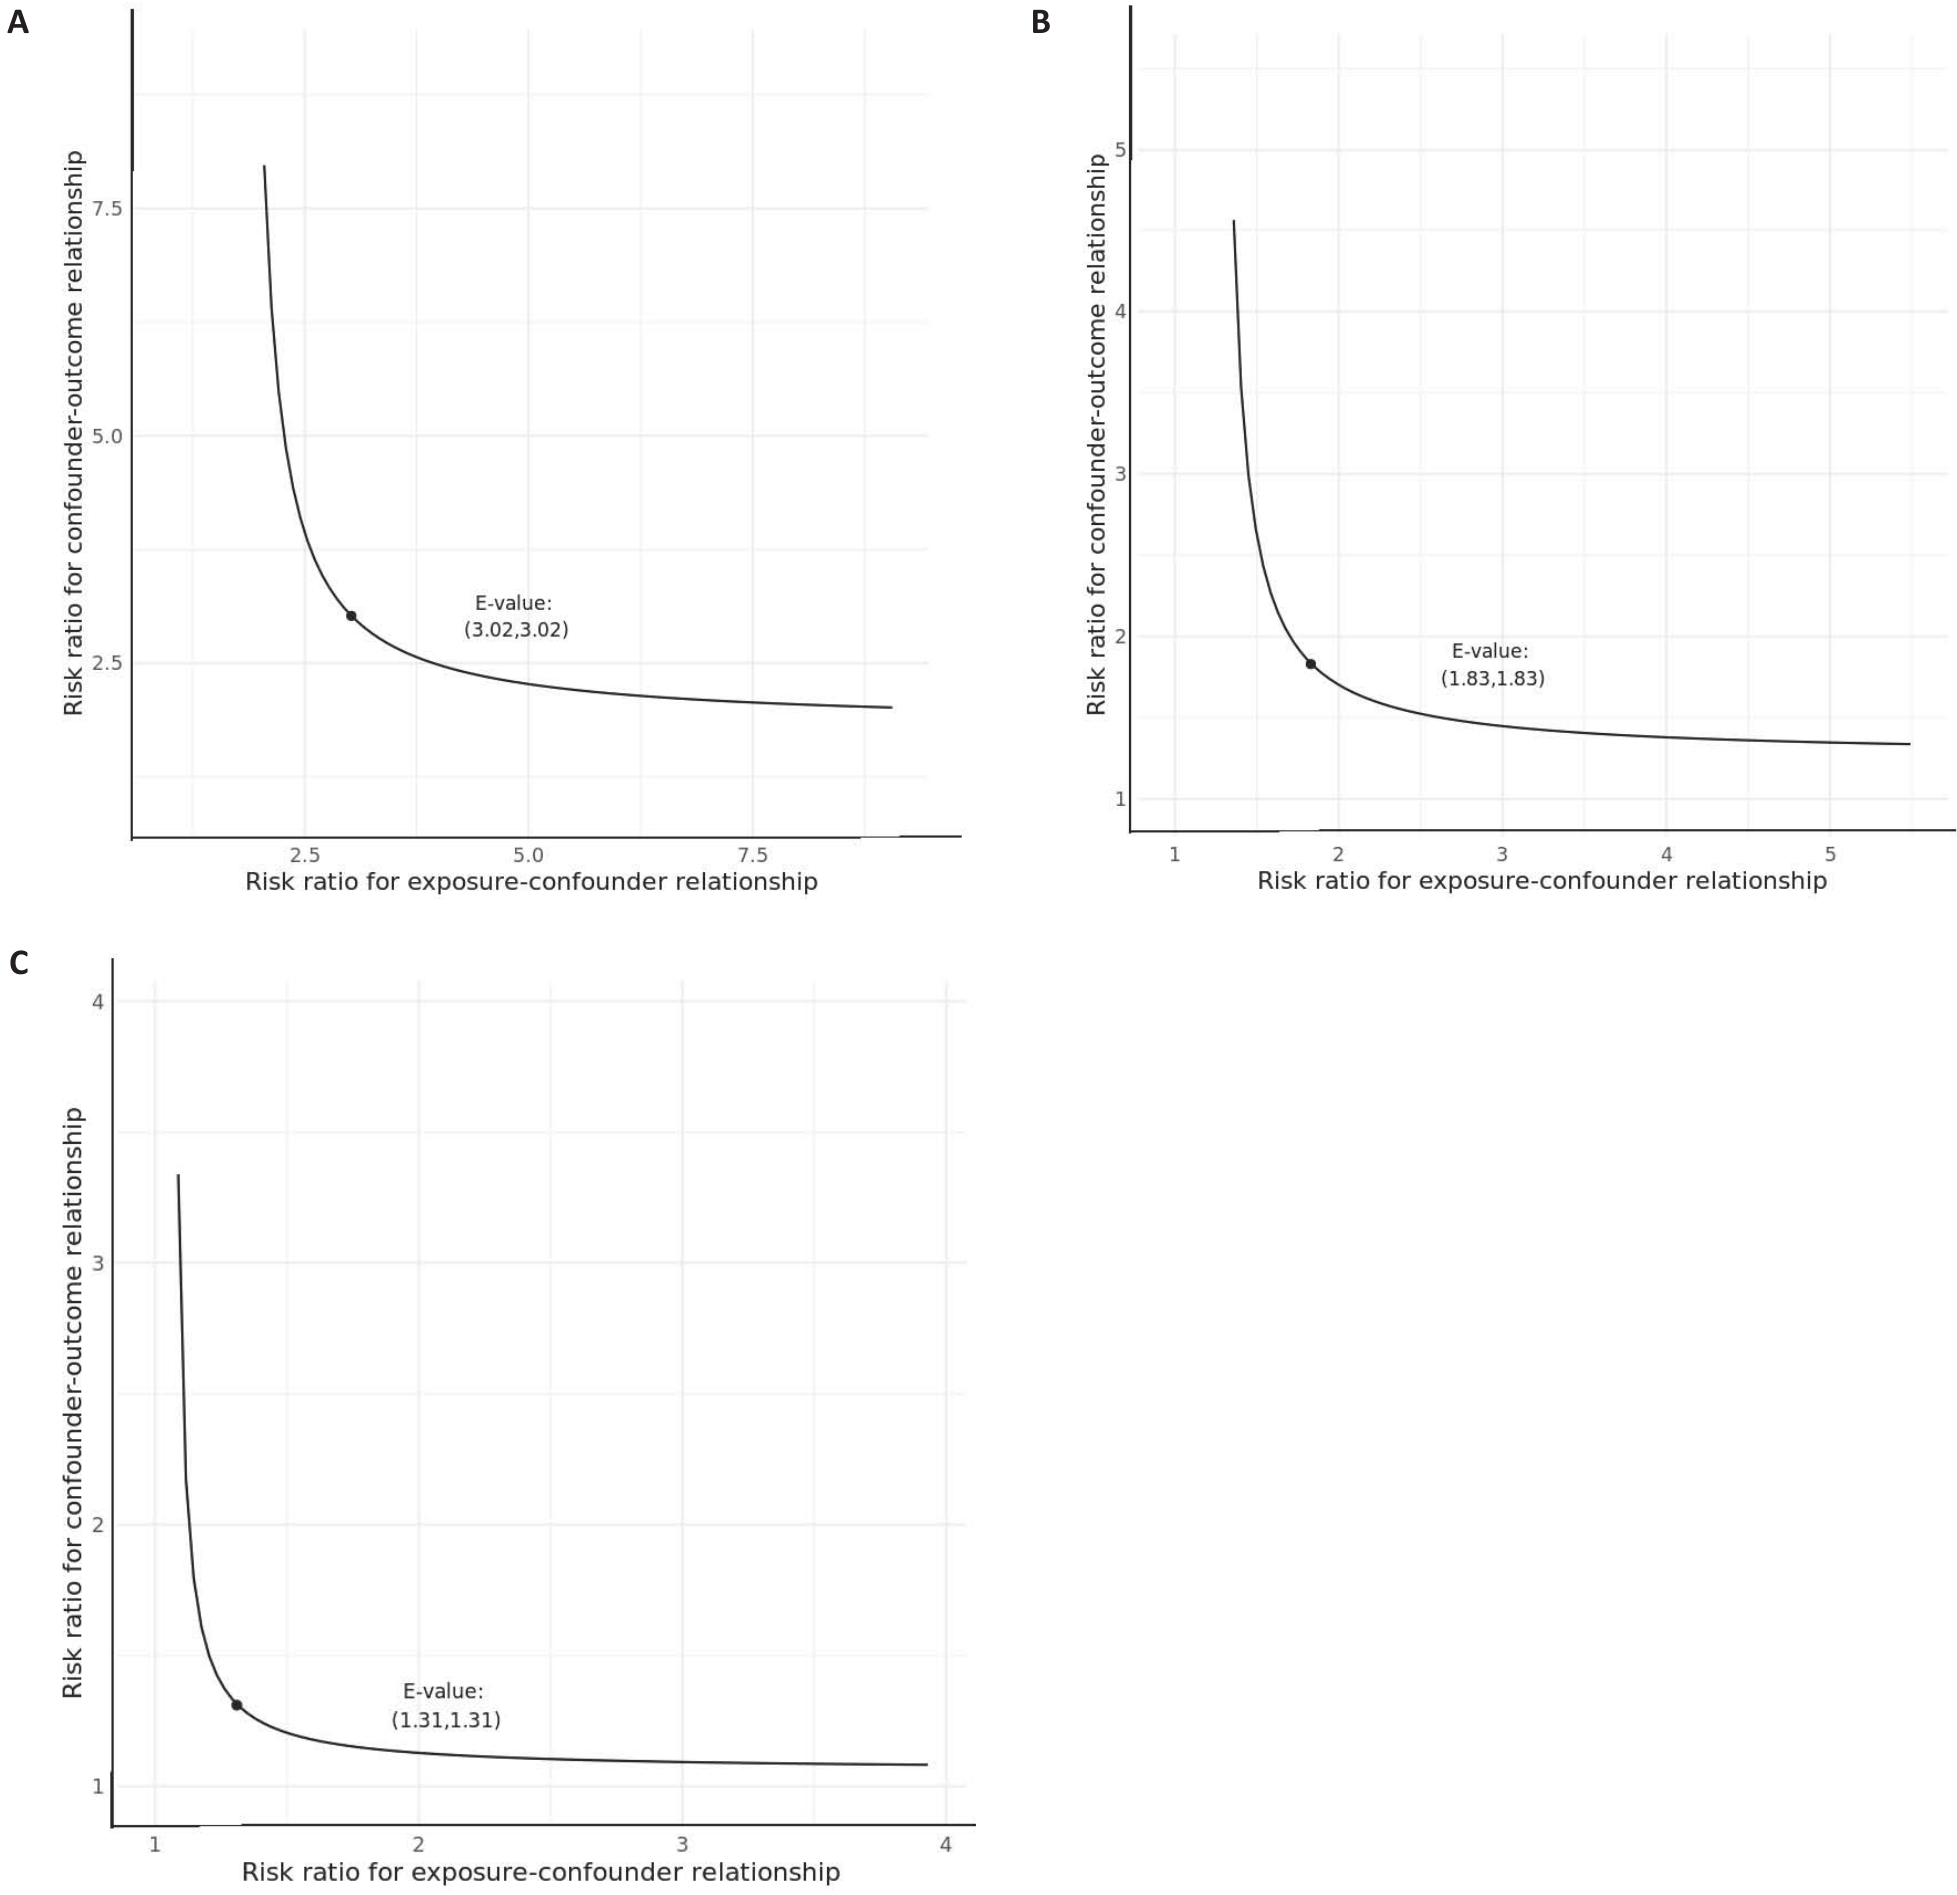
图7 E值敏感性分析曲线图(显示未测量混杂因素的影响强度)
Fig. 7 Curves of the sensitivity analyses for unobserved confounders with E-value highlighted. A: E-value for quintile 1 point estimate: 3.02 and for confidence interval: 2.17. B: E-value for quintile 2 point estimate: 1.83 and for confidence interval: 1. C: E-value for quintile 5 point estimate:1.31 and for confidence interval: 1.
| [1] | Hughes CG, Boncyk CS, Culley DJ, et al. American society for enhanced recovery and perioperative quality initiative joint consensus statement on postoperative delirium prevention[J]. Anesth Analg, 2020, 130(6): 1572-90. doi:10.1213/ane.0000000000004641 |
| [2] | Oh ES, Fong TG, Hshieh TT, et al. Delirium in older persons: advances in diagnosis and treatment[J]. JAMA, 2017, 318(12): 1161-74. doi:10.1001/jama.2017.12067 |
| [3] | Yan E, Veitch M, Saripella A, et al. Association between postoperative delirium and adverse outcomes in older surgical patients: a systematic review and meta-analysis[J]. J Clin Anesth, 2023, 90: 111221. doi:10.1016/j.jclinane.2023.111221 |
| [4] | Jin Z, Hu J, Ma D. Postoperative delirium: perioperative assessment, risk reduction, and management[J]. Br J Anaesth, 2020, 125(4): 492-504. doi:10.1016/j.bja.2020.06.063 |
| [5] | Mattison MLP. Delirium[J]. Ann Intern Med, 2020, 173(7): ITC49-64. doi:10.7326/aitc202010060 |
| [6] | Maier JAM, Locatelli L, Fedele G, et al. Magnesium and the brain: a focus on neuroinflammation and neurodegeneration[J]. Int J Mol Sci, 2022, 24(1): 223. doi:10.3390/ijms24010223 |
| [7] | Kirkland AE, Sarlo GL, Holton KF. The role of magnesium in neurological disorders[J]. Nutrients, 2018, 10(6): E730. doi:10.3390/nu10060730 |
| [8] | Veronese N, Zurlo A, Solmi M, et al. Magnesium status in Alzheimer's disease: a systematic review[J]. Am J Alzheimers Dis Other Demen, 2016, 31(3): 208-13. doi:10.1177/1533317515602674 |
| [9] | Yamanaka R, Shindo Y, Oka K. Magnesium is a key player in neuronal maturation and neuropathology[J]. Int J Mol Sci, 2019, 20(14): E3439. doi:10.3390/ijms20143439 |
| [10] | Hynd MR, Scott HL, Dodd PR. Glutamate-mediated excitotoxicity and neurodegeneration in Alzheimer's disease[J]. Neurochem Int, 2004, 45(5): 583-95. doi:10.1016/j.neuint.2004.03.007 |
| [11] | Slutsky I, Sadeghpour S, Li B, et al. Enhancement of synaptic plasticity through chronically reduced Ca2+ flux during uncorrelated activity[J]. Neuron, 2004, 44(5): 835-49. doi:10.1016/j.neuron.2004.11.013 |
| [12] | Serita T, Miyahara M, Tanimizu T, et al. Dietary magnesium deficiency impairs hippocampus-dependent memories without changes in the spine density and morphology of hippocampal neurons in mice[J]. Brain Res Bull, 2019, 144: 149-57. doi:10.1016/j.brainresbull.2018.11.019 |
| [13] | Balmuș IM, Strungaru SA, Ciobica A, et al. Preliminary data on the interaction between some biometals and oxidative stress status in mild cognitive impairment and Alzheimer’s disease patients[J]. Oxid Med Cell Longev, 2017, 2017: 7156928. doi:10.1155/2017/7156928 |
| [14] | Kieboom BCT, Licher S, Wolters FJ, et al. Serum magnesium is associated with the risk of dementia[J]. Neurology, 2017, 89(16): 1716-22. doi:10.1212/wnl.0000000000004517 |
| [15] | Kim JY, Lee HJ, Lee HY, et al. The effects of hypomagnesemia on delirium in middle-aged and older adult patients admitted to medical intensive care units[J]. Acute Crit Care, 2022, 37(3): 407-14. doi:10.4266/acc.2022.00164 |
| [16] | Boccardi V, Ercolani S, Serra R, et al. Hypomagnesemia and incident delirium in hospitalized older persons[J]. Aging Clin Exp Res, 2023, 35(4): 847-53. doi:10.1007/s40520-023-02357-3 |
| [17] | Fathy W, Hussein M, Elanwar R, et al. Effect of intra-operative Magnesium sulphate on the occurrence of post-operative delirium and insomnia in patients undergoing lumbar fixation: a randomized controlled trial[J]. BMC Anesthesiol, 2024, 24(1): 289. doi:10.1186/s12871-024-02579-6 |
| [18] | Hassan WF, Tawfik MH, Nabil TM, et al. Could intraoperative magnesium sulphate protect against postoperative cognitive dysfunction[J]? Minerva Anestesiol, 2020, 86(8): 808-15. doi:10.23736/s0375-9393.20.14012-4 |
| [19] | Li W, Yu J, Liu Y, et al. Elevation of brain magnesium prevents synaptic loss and reverses cognitive deficits in Alzheimer’s disease mouse model[J]. Mol Brain, 2014, 7: 65. doi:10.1186/s13041-014-0065-y |
| [20] | Cederholm T, Bosaeus I, Barazzoni R, et al. Diagnostic criteria for malnutrition–an ESPEN consensus statement[J]. Clin Nutr, 2015, 34(3): 335-40. doi:10.1016/j.clnu.2015.03.001 |
| [21] | Zhang LM, Hornor MA, Robinson T, et al. Evaluation of postoperative functional health status decline among older adults[J]. JAMA Surg, 2020, 155(10): 950-8. doi:10.1001/jamasurg.2020.2853 |
| [22] | Kim EM, Li G, Kim M. Development of a risk score to predict postoperative delirium in patients with hip fracture[J]. Anesth Analg, 2020, 130(1): 79-86. doi:10.1213/ane.0000000000004386 |
| [23] | Saczynski JS, Kosar CM, Xu G, et al. A tale of two methods: chart and interview methods for identifying delirium[J]. J Am Geriatr Soc, 2014, 62(3): 518-24. doi:10.1111/jgs.12684 |
| [24] | Peduzzi P, Concato J, Kemper E, et al. A simulation study of the number of events per variable in logistic regression analysis[J]. J Clin Epidemiol, 1996, 49(12): 1373-9. doi:10.1016/s0895-4356(96)00236-3 |
| [25] | Zhang Q, Xiao S, Jiao X, et al. The triglyceride-glucose index is a predictor for cardiovascular and all-cause mortality in CVD patients with diabetes or pre-diabetes: evidence from NHANES 2001-2018[J]. Cardiovasc Diabetol, 2023, 22(1): 279. doi:10.1186/s12933-023-02030-z |
| [26] | Textor J, van der Zander B, Gilthorpe MS, et al. Robust causal inference using directed acyclic graphs: the R package ‘dagitty’[J]. Int J Epidemiol, 2016, 45(6): 1887-94. |
| [27] | Lindenauer PK, Stefan MS, Pekow PS, et al. Association between initiation of pulmonary rehabilitation after hospitalization for COPD and 1-year survival among medicare beneficiaries[J]. JAMA, 2020, 323(18): 1813-23. doi:10.1001/jama.2020.4437 |
| [28] | Hou H, Wang L, Fu T, et al. Magnesium acts as a second messenger in the regulation of NMDA receptor-mediated CREB signaling in neurons[J]. Mol Neurobiol, 2020, 57(6): 2539-50. doi:10.1007/s12035-020-01871-z |
| [29] | Rajani V, Sengar AS, Salter MW. Tripartite signalling by NMDA receptors[J]. Mol Brain, 2020, 13(1): 23. doi:10.1186/s13041-020-0563-z |
| [30] | Metwally E, Zhao GL, Zhang YQ. The calcium-dependent protease calpain in neuronal remodeling and neurodegeneration[J]. Trends Neurosci, 2021, 44(9): 741-52. doi:10.1016/j.tins.2021.07.003 |
| [31] | Collingridge GL. Long-term potentiation in the hippocampus: from magnesium to memory[J]. Neuroscience, 2025, 578: 126-31. doi:10.1016/j.neuroscience.2024.11.069 |
| [32] | Maridaki Z, Syrros G, Gianna Delichatsiou S, et al. Claudin-5 and occludin levels in patients with psychiatric disorders-A systematic review[J]. Brain Behav Immun, 2025, 123: 865-75. doi:10.1016/j.bbi.2024.11.006 |
| [33] | Jawa RS, Anillo S, Huntoon K, et al. Interleukin-6 in surgery, trauma, and critical care part II: clinical implications[J]. J Intensive Care Med, 2011, 26(2): 73-87. doi:10.1177/0885066610384188 |
| [34] | Zhu D, You J, Zhao N, et al. Magnesium regulates endothelial barrier functions through TRPM7, MagT1, and S1P1[J]. Adv Sci: Weinh, 2019, 6(18): 1901166. doi:10.1002/advs.201901166 |
| [35] | Esen F, Erdem T, Aktan D, et al. Effect of magnesium sulfate administration on blood-brain barrier in a rat model of intraperitoneal sepsis: a randomized controlled experimental study[J]. Crit Care, 2005, 9(1): R18-R23. doi:10.1186/cc3004 |
| [36] | Ben-David D, Livne E, Reznick AZ. The involvement of oxidants and NF-κB in cytokine-induced MMP-9 synthesis by bone marrow-derived osteoprogenitor cells[J]. Inflamm Res, 2012, 61(7): 673-88. doi:10.1007/s00011-012-0461-7 |
| [37] | Chiarini A, Gui L, Viviani C, et al. NLRP3 inflammasome's activation in acute and chronic brain diseases-an update on pathogenetic mechanisms and therapeutic perspectives with respect to other inflammasomes[J]. Biomedicines, 2023, 11(4): 999. doi:10.3390/biomedicines11040999 |
| [38] | Kelley N, Jeltema D, Duan Y, et al. The NLRP3 inflammasome: an overview of mechanisms of activation and regulation[J]. Int J Mol Sci, 2019, 20(13): E3328. doi:10.3390/ijms20133328 |
| [39] | Yang S, Gu C, Mandeville ET, et al. Anesthesia and surgery impair blood-brain barrier and cognitive function in mice[J]. Front Immunol, 2017, 8: 902. doi:10.3389/fimmu.2017.00902 |
| [40] | Ma G, Jiang X, Meng X, et al. Inhibition of NLRP3 inflammasome alleviates postoperative cognitive impairment by suppressing the HMGB-1/TLR4/NF‑κB pathway[J]. Neurochem Res, 2025, 50(3): 173. doi:10.1007/s11064-025-04416-9 |
| [41] | Perazella MA. Onco-nephrology: renal toxicities of chemothera-peutic agents[J]. Clin J Am Soc Nephrol, 2012, 7(10): 1713-21. doi:10.2215/cjn.02780312 |
| [42] | Kimura A, Kato K, Nakashima A, et al. Association between parathyroid hormone-related peptide levels and mortality in patients with malignancy[J]. Endocr Pract, 2024, 30(12): 1119-25. doi:10.1016/j.eprac.2024.09.003 |
| [43] | Javanmehr N, Saleki K, Alijanizadeh P, et al. Microglia dynamics in aging-related neurobehavioral and neuroinflammatory diseases[J]. J Neuroinflammation, 2022, 19(1): 273. doi:10.1186/s12974-022-02637-1 |
| [1] | 吕雪彩, 刘艳红, 韩诗怡, 张浩赟, 侯爱生, 周志康, 史立凯, 高洁, 曹江北, 张宏, 米卫东. 老年患者胃肠道手术后综合并发症的危险因素——一项多中心观察性研究[J]. 南方医科大学学报, 2025, 45(4): 736-743. |
| [2] | 何 勇, 刘四云, 罗永金, 吴洪坤, 余 杨, 陈 灏. 体外循环术后早期升高的C反应蛋白与术后心房颤动有关[J]. 南方医科大学学报, 2022, 42(3): 443-447. |
| [3] | 许立倩, 魏 宁, 单美娟, 汪子怡, 叶天成, 梁赛珍, 李 乐, 朱 强, 何路遥, 白建杰, 陈碧霞, 徐金东. 加温湿化高流量鼻导管吸氧可减少老年患者麻醉复苏期缺氧事件发生[J]. 南方医科大学学报, 2021, 41(8): 1265-1269. |
| [4] | 江颖仪, 李德宪, 劳穗华, 肖 芃. 血清淀粉样蛋白A、降钙素原、超敏C反应蛋白检测对肺结核合并肺炎的诊断价值[J]. 南方医科大学学报, 2021, 41(3): 453-458. |
| [5] | 赵昌盛,王军锋,张 恒,王晓华,孙 彬,张 克,杨 滨. 术前C反应蛋白水平同老年股骨颈骨折患者的术后并发症相关[J]. 南方医科大学学报, 2019, 39(12): 1511-1514. |
| [6] | 陈小慧,任晓强,马亚兵,葛莉,胡钟元,阎文军. 术后疼痛引起老年患者术后认知功能障碍的相关机制研究进展[J]. 南方医科大学学报, 2019, 39(09): 1122-. |
| [7] | 陈英英,张佳和,张湾,杨子科,罗荣城,康世均. C反应蛋白/白蛋白比率预测结直肠癌病人预后关系[J]. 南方医科大学学报, 2017, 37(05): 622-. |
| [8] | 袁思捷,谢海庭,李忠丽. 超敏反应蛋白、纤维蛋白原和D-二聚体在结缔组织病相关间质性肺炎中的临床意义[J]. 南方医科大学学报, 2017, 37(03): 415-. |
| [9] | 陈思,马宝良,曹明强,于红娟,马兴铭. 类风湿关节炎患者血清MBL、MASP-2、HsCRP与C3水平的相关性[J]. 南方医科大学学报, 2016, 36(10): 1340-. |
| [10] | 何钕琴,沈淑馨,汪艳,郭胜存,王俊芬,宾建平. 急性ST段抬高型心肌梗死患者血清白介素-37表达的时间变化及与C反应蛋白的关系[J]. 南方医科大学学报, 2015, 35(12): 1751-. |
| [11] | 沈克锋,刘启发,孙竞,江千里,张钰,周红升,戴敏,肖敏,王瑾,罗莉,李钦璐,安海云,洪振亚,孟力,杨默,周剑峰,王高翔. 移植日C反应蛋白水平对异基因造血干细胞移植早期感染及预后的预测意义[J]. 南方医科大学学报, 2015, 35(11): 1535-. |
| [12] | 熊思敏,赵 娜,裘宇容,张丽芸,左大明,陈政良. MASP2在小儿上呼吸道感染中的意义[J]. 南方医科大学学报, 2015, 35(06): 888-. |
| [13] | 孙长江,张西志,陈勇. 厄洛替尼治疗老年晚期非小细胞肺癌的疗效[J]. 南方医科大学学报, 2012, 32(12): 1839-. |
| [14] | 黄劲松,黄克力,简旭华,吴敏,卢聪,郑少忆. 50岁以上的主动脉瓣病变患者的外科治疗:附73例报告[J]. 南方医科大学学报, 2012, 32(02): 258-. |
| [15] | 陈爱华,何非,程婧,刘福林,宋旭东,郭敬宾. C反应蛋白对人外周血来源内皮祖细胞Notch信号通路表达影响的实验研究[J]. 南方医科大学学报, 2012, 32(02): 239-. |
| 阅读次数 | ||||||
|
全文 |
|
|||||
|
摘要 |
|
|||||