Journal of Southern Medical University ›› 2024, Vol. 44 ›› Issue (6): 1141-1148.doi: 10.12122/j.issn.1673-4254.2024.06.15
Previous Articles Next Articles
Caiyu SHEN1( ), Shuai WANG2, Ruiying ZHOU1, Yuhe WANG3, Qin GAO4, Xingzhi CHEN4, Shu YANG1()
Received:2024-01-15
Online:2024-06-20
Published:2024-07-01
Contact:
Shu YANG
E-mail:1224911076@qq.com;yangshu@bbmc.edu.cn
Supported by:Caiyu SHEN, Shuai WANG, Ruiying ZHOU, Yuhe WANG, Qin GAO, Xingzhi CHEN, Shu YANG. Prediction of risk of in-hospital death in patients with chronic heart failure complicated by lung infections using interpretable machine learning[J]. Journal of Southern Medical University, 2024, 44(6): 1141-1148.
Add to citation manager EndNote|Ris|BibTeX
URL: https://www.j-smu.com/EN/10.12122/j.issn.1673-4254.2024.06.15
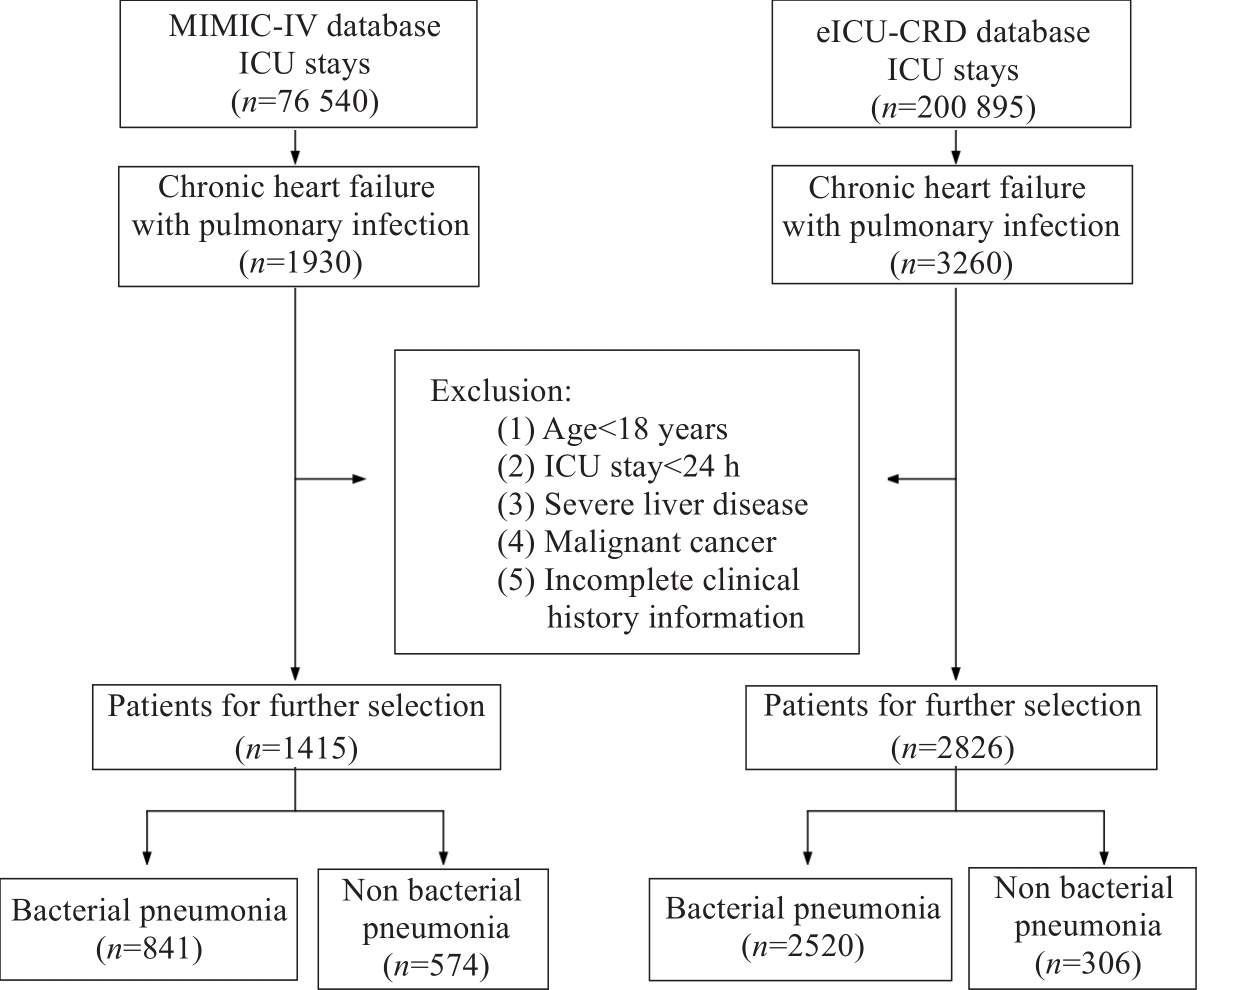
Fig.1 Flowchart of patient screening from two databases.
| Troponin T (ng/mL) | 0.7 (0.08, 0.53) | 0.64 (0.08, 0.52) | 0.88 (0.07, 0.62) | 0.834 |
| NT-proBNP (pg/mL) | 13207 (6192, 18491) | 12 852 (5555, 17906) | 14703 (8280, 20015) | <0.001 |
| PaO2 (mmHg) | 108 (71.0, 123.0) | 110 (71.2, 126.0) | 100 (69.0, 116.0) | 0.386 |
| PaCO2 (mmHg) | 43.6 (38.0, 47.0) | 43.6 (38.7, 47.0) | 43.4 (36.0, 48.0) | 0.069 |
| Lactate min (mmol/L) | 1.6 (1.0, 1.8) | 1.5 (1.0, 1.8) | 1.9 (1.1, 2.1) | <0.001 |
| Lactate max (mmol/L) | 2.8 (1.5, 3.3) | 2.6 (1.4, 3.0) | 3.4 (1.6, 4.1) | <0.001 |
| Bicarbonate min (mEq/L) | 25.9 (19.0, 26.0) | 23.0 (19.0, 26.0) | 21.3 (18.3, 25.0) | <0.001 |
| Bicarbonate max (mEq/L) | 25.7 (22.0, 29.0) | 26.1 (22.0, 29.0) | 25.0 (21.0, 28.0) | <0.001 |
| Urine output (mL) | 1759 (905, 2295) | 1848 (994, 2395) | 1382 (584, 1885) | <0.001 |
| Cerebrovascular disease [n(%)] | 221 (15.6) | 157 (13.7) | 64 (23.6) | <0.001 |
| Mild liver disease [n(%)] | 136 (9.6) | 97 (8.4) | 39 (14.4) | 0.003 |
| Myocardial infarct [n(%)] | 423 (29.9) | 338 (29.5) | 85 (31.4) | 0.556 |
| Peripheral vascular disease [n(%)] | 258 (18.2) | 210 (18.4) | 48 (17.7) | 0.805 |
| Dementia [n(%)] | 73 (5.2) | 58 (5.1) | 15 (5.5) | 0.756 |
| Chronic Pulmonary Disease [n(%)] | 608 (43.0) | 498 (43.5) | 110 (40.6) | 0.379 |
| Rheumatic disease [n(%)] | 69 (4.9) | 53 (4.6) | 16 (5.9) | 0.382 |
| Peptic ulcer disease [n(%)] | 38 (2.7) | 32 (2.8) | 6 (2.2) | 0.593 |
| Diabetes without cc [n(%)] | 448 (31.7) | 366 (32.0) | 82 (30.3) | 0.581 |
| Diabetes with cc [n(%)] | 276 (19.5) | 229 (20.0) | 47 (17.3) | 0.318 |
| Paraplegia [n(%)] | 66 (4.7) | 46 (4.0) | 20 (7.4) | 0.018 |
| Renal disease [n(%)] | 583 (41.2) | 456 (39.9) | 127 (46.9) | 0.035 |
| Metastatic solid tumor [n(%)] | 17 (1.2) | 9 (0.8) | 8 (0.3) | 0.003 |
| Aids [n(%)] | 12 (0.08) | 12 (0.1) | 0 | 0.090 |
| SOFA score | 6.9 (4.0, 9.0) | 6.3 (3.0, 9.0) | 9.2 (6.0, 12) | <0.001 |
| SAPSII score | 42.0 (32.0, 50.0) | 40.2 (31.0, 48.0) | 49.4 (40.0, 58.0) | <0.001 |
| GCS min score | 11.1 (8.0, 15.0) | 11.7 (9.0, 15.0) | 8.3 (3.0, 13.0) | <0.001 |
| Diuretic [n(%)] | 487 (34.4) | 388 (33.9) | 99 (36.5) | 0.415 |
| ACEI [n(%)] | 42 (0.03) | 32 (0.03) | 10 (0.036) | 0.436 |
Tab.1 Baseline patient characteristics [M (Q1, Q3)]
| Troponin T (ng/mL) | 0.7 (0.08, 0.53) | 0.64 (0.08, 0.52) | 0.88 (0.07, 0.62) | 0.834 |
| NT-proBNP (pg/mL) | 13207 (6192, 18491) | 12 852 (5555, 17906) | 14703 (8280, 20015) | <0.001 |
| PaO2 (mmHg) | 108 (71.0, 123.0) | 110 (71.2, 126.0) | 100 (69.0, 116.0) | 0.386 |
| PaCO2 (mmHg) | 43.6 (38.0, 47.0) | 43.6 (38.7, 47.0) | 43.4 (36.0, 48.0) | 0.069 |
| Lactate min (mmol/L) | 1.6 (1.0, 1.8) | 1.5 (1.0, 1.8) | 1.9 (1.1, 2.1) | <0.001 |
| Lactate max (mmol/L) | 2.8 (1.5, 3.3) | 2.6 (1.4, 3.0) | 3.4 (1.6, 4.1) | <0.001 |
| Bicarbonate min (mEq/L) | 25.9 (19.0, 26.0) | 23.0 (19.0, 26.0) | 21.3 (18.3, 25.0) | <0.001 |
| Bicarbonate max (mEq/L) | 25.7 (22.0, 29.0) | 26.1 (22.0, 29.0) | 25.0 (21.0, 28.0) | <0.001 |
| Urine output (mL) | 1759 (905, 2295) | 1848 (994, 2395) | 1382 (584, 1885) | <0.001 |
| Cerebrovascular disease [n(%)] | 221 (15.6) | 157 (13.7) | 64 (23.6) | <0.001 |
| Mild liver disease [n(%)] | 136 (9.6) | 97 (8.4) | 39 (14.4) | 0.003 |
| Myocardial infarct [n(%)] | 423 (29.9) | 338 (29.5) | 85 (31.4) | 0.556 |
| Peripheral vascular disease [n(%)] | 258 (18.2) | 210 (18.4) | 48 (17.7) | 0.805 |
| Dementia [n(%)] | 73 (5.2) | 58 (5.1) | 15 (5.5) | 0.756 |
| Chronic Pulmonary Disease [n(%)] | 608 (43.0) | 498 (43.5) | 110 (40.6) | 0.379 |
| Rheumatic disease [n(%)] | 69 (4.9) | 53 (4.6) | 16 (5.9) | 0.382 |
| Peptic ulcer disease [n(%)] | 38 (2.7) | 32 (2.8) | 6 (2.2) | 0.593 |
| Diabetes without cc [n(%)] | 448 (31.7) | 366 (32.0) | 82 (30.3) | 0.581 |
| Diabetes with cc [n(%)] | 276 (19.5) | 229 (20.0) | 47 (17.3) | 0.318 |
| Paraplegia [n(%)] | 66 (4.7) | 46 (4.0) | 20 (7.4) | 0.018 |
| Renal disease [n(%)] | 583 (41.2) | 456 (39.9) | 127 (46.9) | 0.035 |
| Metastatic solid tumor [n(%)] | 17 (1.2) | 9 (0.8) | 8 (0.3) | 0.003 |
| Aids [n(%)] | 12 (0.08) | 12 (0.1) | 0 | 0.090 |
| SOFA score | 6.9 (4.0, 9.0) | 6.3 (3.0, 9.0) | 9.2 (6.0, 12) | <0.001 |
| SAPSII score | 42.0 (32.0, 50.0) | 40.2 (31.0, 48.0) | 49.4 (40.0, 58.0) | <0.001 |
| GCS min score | 11.1 (8.0, 15.0) | 11.7 (9.0, 15.0) | 8.3 (3.0, 13.0) | <0.001 |
| Diuretic [n(%)] | 487 (34.4) | 388 (33.9) | 99 (36.5) | 0.415 |
| ACEI [n(%)] | 42 (0.03) | 32 (0.03) | 10 (0.036) | 0.436 |
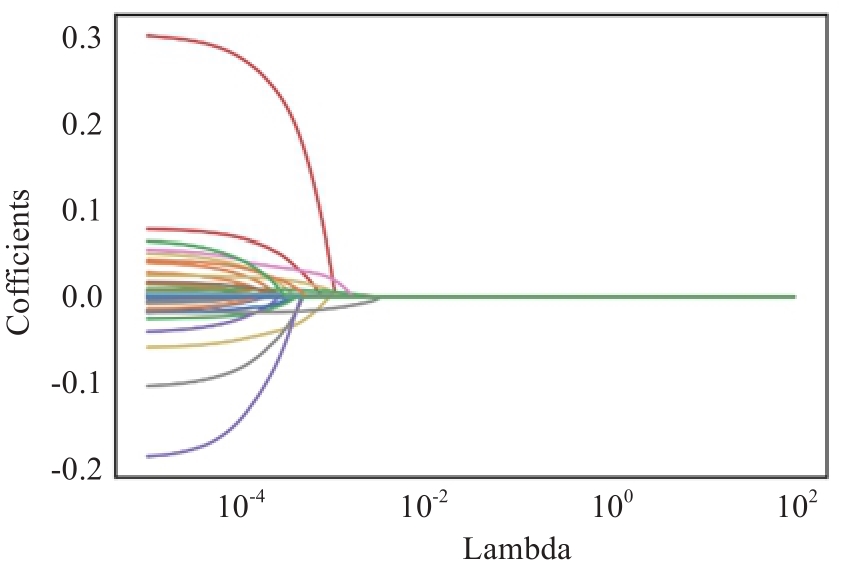
Fig.2 Lambda versus regression coefficients.
| Trait | Coefficient |
|---|---|
| Age | 0.000264 |
| Heart rate | 0.001311 |
| Systolic blood pressure | -0.000002 |
| Resp rate | 0.000995 |
| Temperature | -0.032731 |
| Peripheral vascular disease | -0.004364 |
| Cerebrovascular disease | 0.034564 |
| Peptic ulcer disease | -0.027540 |
| Mild liver disease | 0.001324 |
| Diabetes with cc | -0.000665 |
| Metastatic solid tumor | 0.202496 |
| Aids | -0.020164 |
| SOFA | 0.004093 |
| SAPS II | 0.000876 |
| GCS min | -0.017186 |
| Weight | -0.000768 |
| White blood cell | 0.008654 |
| Platelet | -0.000094 |
| Blood urea nitrogen | 0.001737 |
| PaO2 | 0.000110 |
| PaCO2 | -0.000313 |
| Lactate min | 0.033445 |
| Urine output | -0.000008 |
| Diuretic | 0.011216 |
Tab.2 Characterization coefficients of the selected features
| Trait | Coefficient |
|---|---|
| Age | 0.000264 |
| Heart rate | 0.001311 |
| Systolic blood pressure | -0.000002 |
| Resp rate | 0.000995 |
| Temperature | -0.032731 |
| Peripheral vascular disease | -0.004364 |
| Cerebrovascular disease | 0.034564 |
| Peptic ulcer disease | -0.027540 |
| Mild liver disease | 0.001324 |
| Diabetes with cc | -0.000665 |
| Metastatic solid tumor | 0.202496 |
| Aids | -0.020164 |
| SOFA | 0.004093 |
| SAPS II | 0.000876 |
| GCS min | -0.017186 |
| Weight | -0.000768 |
| White blood cell | 0.008654 |
| Platelet | -0.000094 |
| Blood urea nitrogen | 0.001737 |
| PaO2 | 0.000110 |
| PaCO2 | -0.000313 |
| Lactate min | 0.033445 |
| Urine output | -0.000008 |
| Diuretic | 0.011216 |
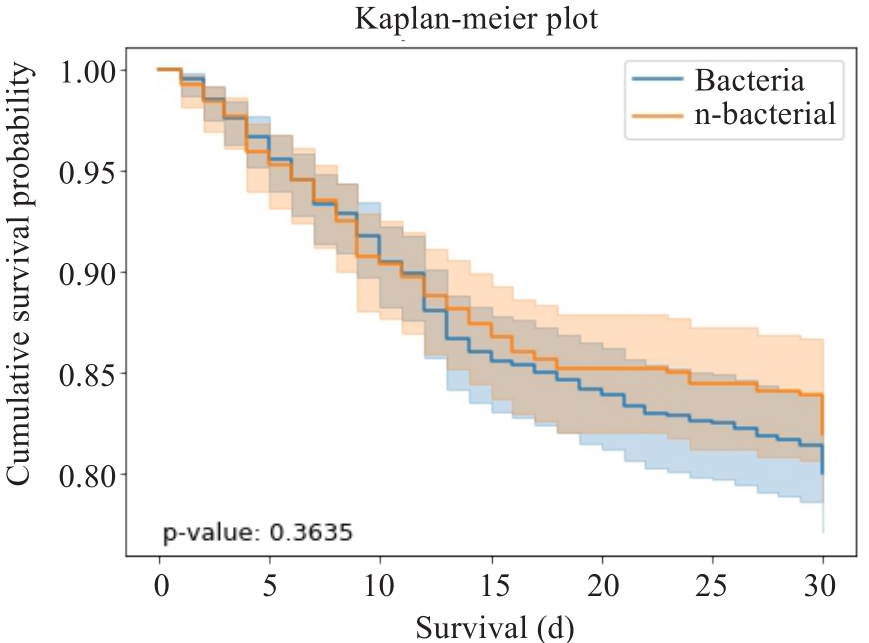
Fig.3 Survival curves of the patients with bacterial and non-bacterial pneumonia.
| Mode | Accuracy | Precision | F1-score | AUC | AUC (95 %CI) |
|---|---|---|---|---|---|
| LR1 | 0.816 | 0.832 | 0.893 | 0.773 | (0.788, 0.839) |
| AdaBoost1 | 0.841 | 0.861 | 0.906 | 0.767 | (0.688, 0.803) |
| XGBoost1 | 0.845 | 0.855 | 0.909 | 0.829 | (0.785, 0.866) |
| LightGBM1 | 0.837 | 0.854 | 0.904 | 0.836 | (0.697, 0.869) |
| LR2 | 0.805 | 0.808 | 0.891 | 0.757 | (0.686, 0.786) |
| AdaBoost2 | 0.751 | 0.836 | 0.848 | 0.763 | (0.605, 0.779) |
| XGBoost2 | 0.811 | 0.842 | 0.889 | 0.810 | (0.709, 0.829) |
| LightGBM2 | 0.805 | 0.832 | 0.887 | 0.818 | (0.740, 0.846) |
| LR3 | 0.791 | 0.807 | 0.880 | 0.826 | (0.790, 0.841) |
| AdaBoost3 | 0.809 | 0.829 | 0.888 | 0.787 | (0.724, 0.848) |
| XGBoost3 | 0.835 | 0.840 | 0.904 | 0.846 | (0.788, 0.862) |
| LightGBM3 | 0.826 | 0.832 | 0.899 | 0.830 | (0.742, 0.860) |
Tab.3 Comparison of the performance of the 4 models using the 3 dataset
| Mode | Accuracy | Precision | F1-score | AUC | AUC (95 %CI) |
|---|---|---|---|---|---|
| LR1 | 0.816 | 0.832 | 0.893 | 0.773 | (0.788, 0.839) |
| AdaBoost1 | 0.841 | 0.861 | 0.906 | 0.767 | (0.688, 0.803) |
| XGBoost1 | 0.845 | 0.855 | 0.909 | 0.829 | (0.785, 0.866) |
| LightGBM1 | 0.837 | 0.854 | 0.904 | 0.836 | (0.697, 0.869) |
| LR2 | 0.805 | 0.808 | 0.891 | 0.757 | (0.686, 0.786) |
| AdaBoost2 | 0.751 | 0.836 | 0.848 | 0.763 | (0.605, 0.779) |
| XGBoost2 | 0.811 | 0.842 | 0.889 | 0.810 | (0.709, 0.829) |
| LightGBM2 | 0.805 | 0.832 | 0.887 | 0.818 | (0.740, 0.846) |
| LR3 | 0.791 | 0.807 | 0.880 | 0.826 | (0.790, 0.841) |
| AdaBoost3 | 0.809 | 0.829 | 0.888 | 0.787 | (0.724, 0.848) |
| XGBoost3 | 0.835 | 0.840 | 0.904 | 0.846 | (0.788, 0.862) |
| LightGBM3 | 0.826 | 0.832 | 0.899 | 0.830 | (0.742, 0.860) |
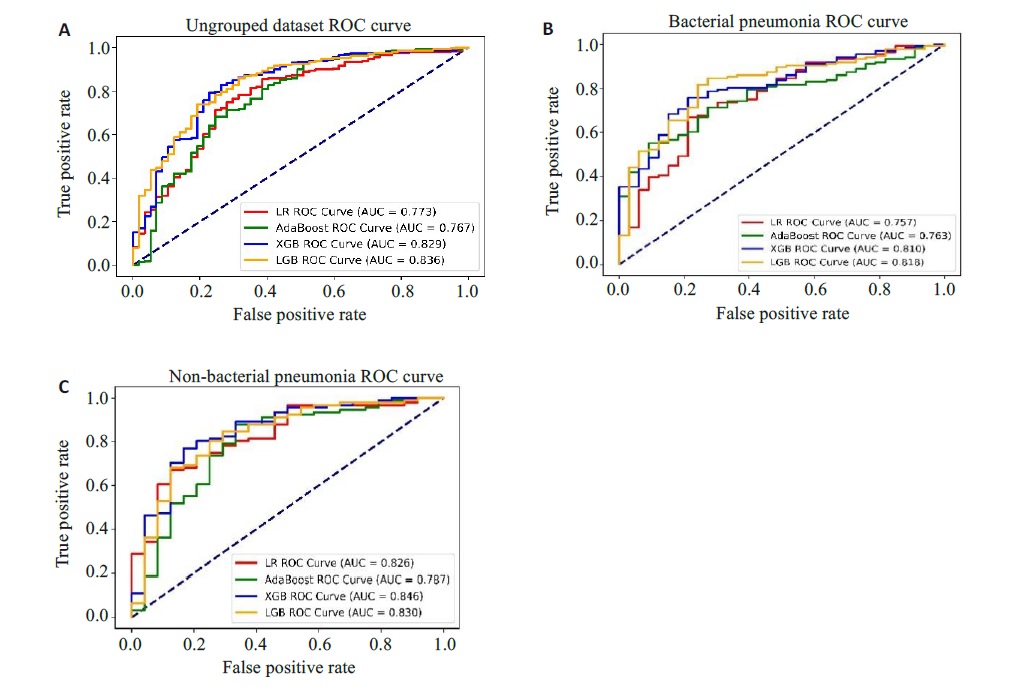
Fig.4 ROC curves of the patients before and after grouping. A: Ungrouped dataset ROC. B: ROC for bacterial pneumonia dataset. C: ROC for non-bacterial pneumonia dataset.
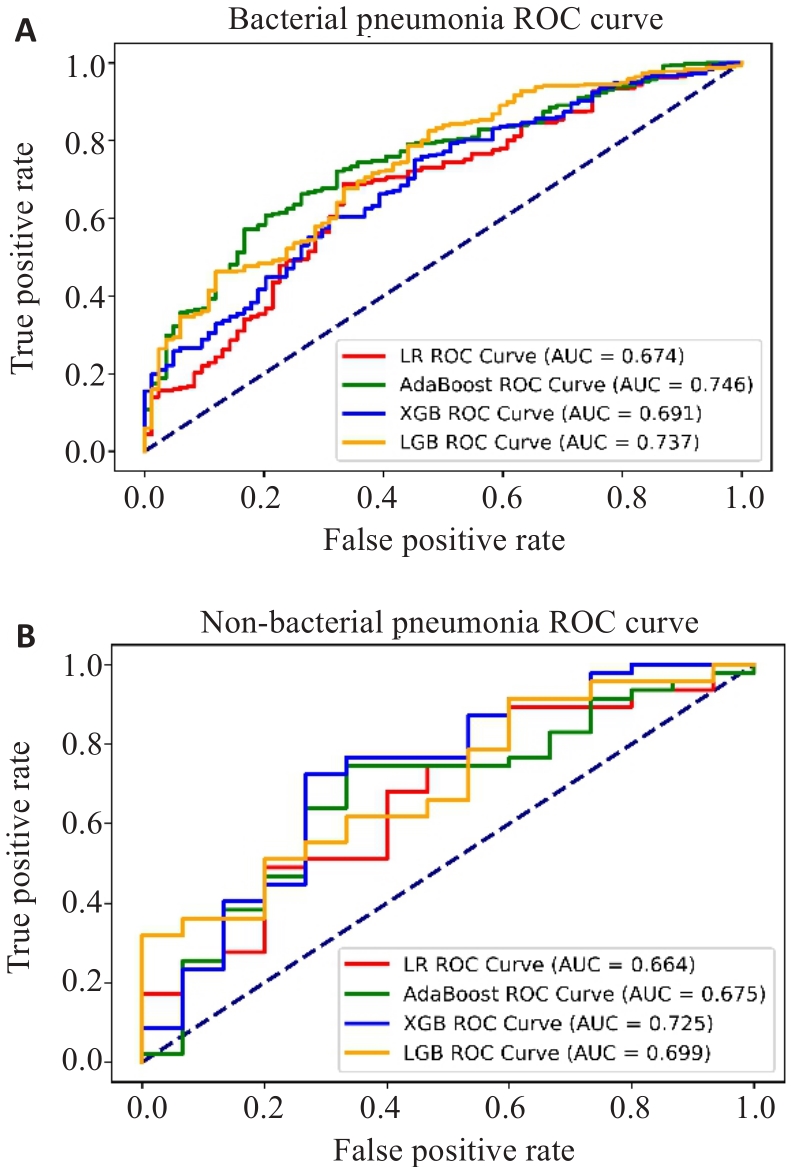
Fig.5 ROC curves of the patients with bacterial pneumonia (A) and non-bacterial pneumonia (B) from eICU-CRD.
| Mode | Accuracy | Precision | F1-score | AUC | AUC (95% CI) |
|---|---|---|---|---|---|
| LR1 | 0.833 | 0.840 | 0.908 | 0.674 | (0.652, 0.697) |
| AdaBoost1 | 0.815 | 0.856 | 0.894 | 0.746 | (0.639, 0.788) |
| XGBoost1 | 0.827 | 0.851 | 0.903 | 0.691 | (0.654, 0.720) |
| LightGBM 1 | 0.829 | 0.845 | 0.904 | 0.737 | (0.647, 0.770) |
| LR2 | 0.742 | 0.772 | 0.846 | 0.664 | (0.567, 0.753) |
| AdaBoost2 | 0.710 | 0.784 | 0.816 | 0.675 | (0.549, 0.780) |
| XGBoost2 | 0.774 | 0.800 | 0.863 | 0.725 | (0.577, 0.782) |
| LightGBM 2 | 0.772 | 0.801 | 0.862 | 0.699 | (0.569, 0.786) |
Tab.4 Comparison of model performance for patients with bacterial pneumonia and non-bacterial pneumonia from eICU-CRD
| Mode | Accuracy | Precision | F1-score | AUC | AUC (95% CI) |
|---|---|---|---|---|---|
| LR1 | 0.833 | 0.840 | 0.908 | 0.674 | (0.652, 0.697) |
| AdaBoost1 | 0.815 | 0.856 | 0.894 | 0.746 | (0.639, 0.788) |
| XGBoost1 | 0.827 | 0.851 | 0.903 | 0.691 | (0.654, 0.720) |
| LightGBM 1 | 0.829 | 0.845 | 0.904 | 0.737 | (0.647, 0.770) |
| LR2 | 0.742 | 0.772 | 0.846 | 0.664 | (0.567, 0.753) |
| AdaBoost2 | 0.710 | 0.784 | 0.816 | 0.675 | (0.549, 0.780) |
| XGBoost2 | 0.774 | 0.800 | 0.863 | 0.725 | (0.577, 0.782) |
| LightGBM 2 | 0.772 | 0.801 | 0.862 | 0.699 | (0.569, 0.786) |
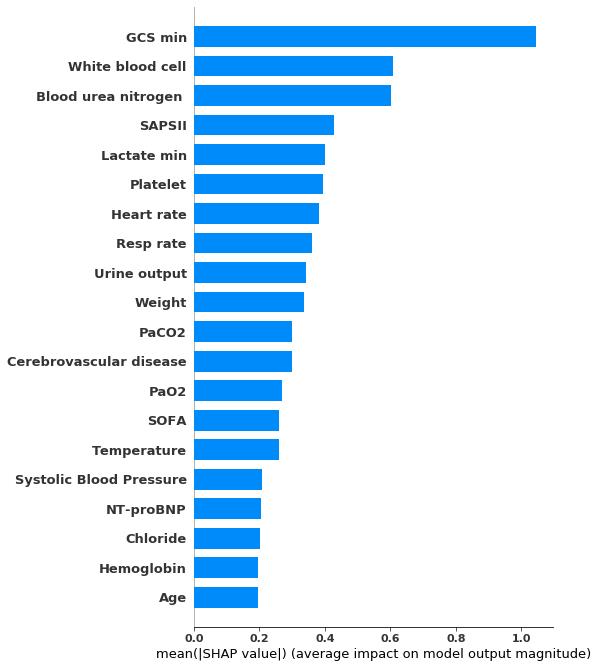
Fig.6 Importance ranking of SHAP features.
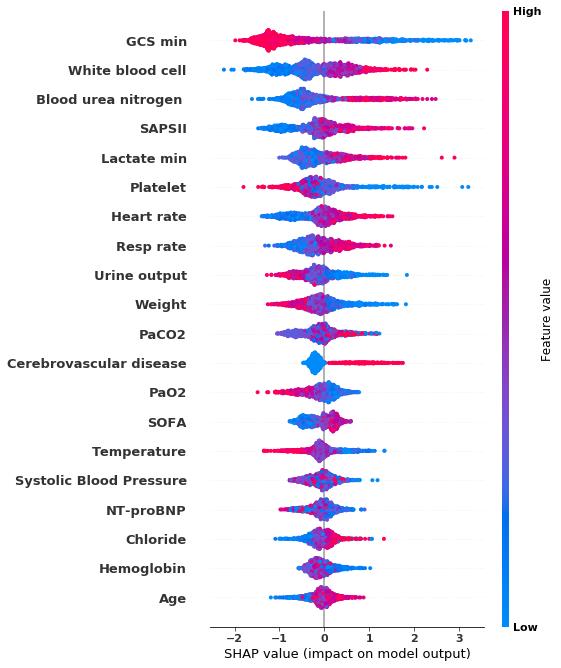
Fig.7 Distribution of feature effects on model output.
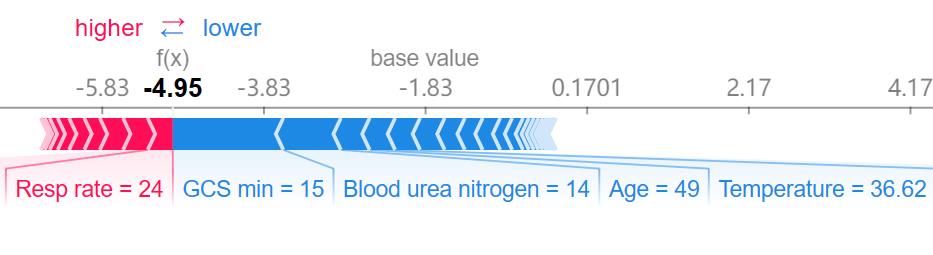
Fig.8 Contribution of characteristics of surviving CHF patients with lung infections.
| 1 | 肖小菊, 黎励文. 《心力衰竭的通用定义和分类》解读[J]. 中国胸心血管外科临床杂志, 2021, 28(10): 1140-4. DOI: 10.7507/1007-4848.202106044 |
| 2 | 马丽媛, 王增武, 樊 静, 等. 《中国心血管健康与疾病报告2022》要点解读[J]. 中国全科医学, 2023, 26(32): 3975-94. DOI: 10.12114/j.issn.1007-9572.2023.0408 |
| 3 | Shen L, Jhund PS, Anand IS, et al. Incidence and outcomes of pneumonia in patients with heart failure[J]. J Am Coll Cardiol, 2021, 77(16): 1961-73. |
| 4 | Bo XW, Zhang YH, Liu Y, et al. Performance of the heart failure risk scores in predicting 1year mortality and short-term readmission of patients[J]. ESC Heart Fail, 2023, 10(1): 502-17. |
| 5 | Wang B, Li YX, Tian Y, et al. Novel pneumonia score based on a machine learning model for predicting mortality in pneumonia patients on admission to the intensive care unit[J]. Respir Med, 2023, 217: 107363. |
| 6 | Theunissen M, Browning J. Putting explainable AI in context: institutional explanations for medical AI[J]. Ethics Inf Technol, 2022, 24(2): 23-9. |
| 7 | Saqr M. Is GDPR failing? a tale of the many challenges in interpretations, applications, and enforcement[J]. Int J Health Sci, 2022, 16(5): 1-2. |
| 8 | 陈珂锐, 孟小峰. 机器学习的可解释性[J]. 计算机研究与发展, 2020, 57(9): 1971-86. DOI: 10.7544/issn1000-1239.2020.20190456 |
| 9 | Rogers P, Wang D, Lu ZY. Medical information mart for intensive care: a foundation for the fusion of artificial intelligence and real-world data[J]. Front Artif Intell, 2021, 4: 691626-35. |
| 10 | Pollard TJ, Johnson AEW, Raffa JD, et al. The eICU Collaborative Research Database, a freely available multi-center database for critical care research[J]. Sci Data, 2018, 5: 180178-83. |
| 11 | Chen YN, Chen H, Lu XD, et al. Automatic ICD-10 coding: deep semantic matching based on analogical reasoning[J]. Heliyon, 2023, 9(4): e15570-6. |
| 12 | 于翠香, 王西艳. 《中国成人医院获得性肺炎与呼吸机相关性肺炎诊断和治疗指南(2018年版)》解读[J]. 中国医刊, 2021, 56(9): 951-3. DOI: 10.3969/j.issn.1008-1070.2021.09.008 |
| 13 | 卓于迪, 朱陵群, 张立山, 等. 套索回归模型在中医临床研究数据的统计应用与R语言实践[J]. 世界中医药, 2023, 18(7): 1033-8. DOI: 10.3969/j.issn.1673-7202.2023.07.023 |
| 14 | 杨 柳, 王 钰. 泛化误差的各种交叉验证估计方法综述[J]. 计算机应用研究, 2015, 32(5): 1287-90, 1297. DOI: 10.3969/j.issn.1001-3695.2015.05.002 |
| 15 | Lynam AL, Dennis JM, Owen KR, et al. Logistic regression has similar performance to optimised machine learning algorithms in a clinical setting: application to the discrimination between type 1 and type 2 diabetes in young adults[J]. Diagn Progn Res, 2020, 4: 6-12. |
| 16 | Amendolara A, Pfister D, Settelmayer M, et al. An overview of machine learning applications in sports injury prediction[J]. Cureus, 2023, 15(9): e46170-8. |
| 17 | Chen RC, Caraka RE, Arnita NE, et al. An end to end of scalable tree boosting system[J]. Sylwan, 2020, 165(1): 1-11. |
| 18 | Li XQ, Xiong XY, Liang ZA, et al. A machine learning diagnostic model for Pneumocystis jirovecii pneumonia in patients with severe pneumonia[J]. Intern Emerg Med, 2023, 18(6): 1741-9. |
| 19 | Xu CG, Li HX, Yang JP, et al. Interpretable prediction of 3-year all-cause mortality in patients with chronic heart failure based on machine learning[J]. BMC Med Inform Decis Mak, 2023, 23(1): 267-79. |
| 20 | Petch J, Di S, Nelson W. Opening the black box: the promise and limitations of explainable machine learning in cardiology[J]. Can J Cardiol, 2022, 38(2): 204-13. |
| 21 | Cho YR, Kang M. Interpretable machine learning in bioinformatics[J]. Methods, 2020, 179: 1-2. |
| 22 | Ma MW, Liu RY, Wen CJ, et al. Predicting the molecular subtype of breast cancer and identifying interpretable imaging features using machine learning algorithms[J]. Eur Radiol, 2022, 32(3): 1652-62. |
| 23 | 鲍利改, 董 谦. 慢性心力衰竭合并肺部感染患者MIP-2、MMP-9、D-D、miR-21表达及与病原菌类型、心肌功能的关联性研究[J]. 临床误诊误治, 2022, 35(3): 78-83. DOI: 10.3969/j.issn.1002-3429.2022.03.018 |
| 24 | Mancini D, Gibson GT. Impact of pneumonia in HeartFailurePatients[J]. J Am Coll Cardiol, 2021, 77(16): 1974-6. |
| 25 | Chen ZJ, Li TM, Guo S, et al. Machine learning-based in-hospital mortality risk prediction tool for intensive care unit patients with heart failure[J]. Front Cardiovasc Med, 2023, 10: 1119699. |
| 26 | Chiotos K, Tamma PD, Gerber JS. Antibiotic stewardship in the intensive care unit: challenges and opportunities[J]. Infect Control Hosp Epidemiol, 2019, 40(6): 693-8. |
| 27 | Bifarin OO. Interpretable machine learning with tree-based shapley additive explanations: application to metabolomics datasets for binary classification[J]. PLoS One, 2023, 18(5): e0284315. |
| 28 | Chen JM, Li Y, Liu P, et al. A nomogram to predict the in-hospital mortality of patients with congestive heart failure and chronic kidney disease[J]. ESC Heart Fail, 2022, 9(5): 3167-76. |
| 29 | Aryee EK, Ozkan B, Ndumele CE. Heart failure and obesity: the latest pandemic[J]. Prog Cardiovasc Dis, 2023, 78: 43-8. |
| 30 | 孟广蕊, 纪志芳, 田 勇. 老年心力衰竭合并肺部感染病原菌分布及血清CRP、PCT水平变化[J]. 中国病原生物学杂志, 2023, 18(7): 821-4, 829. |
| [1] | Meimei CHEN, Yang WANG, Huangwei LEI, Fei ZHANG, Ruina HUANG, Zhaoyang YANG. Construction of recognition models for subthreshold depression based on multiple machine learning algorithms and vocal emotional characteristics [J]. Journal of Southern Medical University, 2025, 45(4): 711-717. |
| [2] | Zhiliang CHEN, Yonggang YANG, Xia HUANG, Yan CHENG, Yuan QU, Qiqi HENG, Yujia FU, Kewei LI, Ning GU. Differential expressions of exosomal miRNAs in patients with chronic heart failure and hyperuricemia: diagnostic values of miR-27a-5p and miR-139-3p [J]. Journal of Southern Medical University, 2025, 45(1): 43-51. |
| [3] | Lili CHEN, Tianyu WU, Ming ZHANG, Zixia DING, Yan ZHANG, Yiqing YANG, Jiaqian ZHENG, Xiaonan ZHANG. Identification of potential biomarkers and immunoregulatory mechanisms of rheumatoid arthritis based on multichip co-analysis of GEO database [J]. Journal of Southern Medical University, 2024, 44(6): 1098-1108. |
| [4] | Zhiwei ZUO, Qingliang MENG, Jiakang CUI, Kelei GUO, Hua BIAN. An artificial neural network diagnostic model for scleroderma and immune cell infiltration analysis based on mitochondria-associated genes [J]. Journal of Southern Medical University, 2024, 44(5): 920-929. |
| [5] | Xiaoyin HUANG, Fenglian CHEN, Yu ZHANG, Shujun LIANG. A predictive model for survival outcomes of glioma patients based on multi-parametric, multi-regional MRI radiomics features and clinical features [J]. Journal of Southern Medical University, 2024, 44(10): 2004-2014. |
| [6] | HE Huishan, GUO Erjia, MENG Wenyi, WANG Yu, WANG Wen, HE Wenle, WU Yuankui, YANG Wei. Predicting cerebral glioma enhancement pattern using a machine learning-based magnetic resonance imaging radiomics model [J]. Journal of Southern Medical University, 2024, 44(1): 194-200. |
| [7] | LUO Xiao, CHENG Yi, WU Cheng, HE Jia. An interpretable machine learning-based prediction model for risk of death for patients with ischemic stroke in intensive care unit [J]. Journal of Southern Medical University, 2023, 43(7): 1241-1247. |
| [8] | GAO Kaiji, WANG Yihao, CAO Haikun, JIA Jianguang. Efficacy of machine learning models versus Cox regression model for predicting prognosis of esophagogastric junction adenocarcinoma [J]. Journal of Southern Medical University, 2023, 43(6): 952-963. |
| [9] | ZENG Pengguihang, TANG Xiuxiao, WU Tingqin, TIAN Qi, LI Mangmang, DING Junjun. Identification of potential regulatory genes for embryonic stem cell self-renewal and pluripotency by random forest [J]. Journal of Southern Medical University, 2021, 41(8): 1234-1242. |
| [10] | . Establishment of naive Bayes classifier-based risk prediction model for chemotherapy-induced nausea and vomiting [J]. Journal of Southern Medical University, 2021, 41(4): 607-612. |
| [11] | . Application of artificial intelligence for detection and classification of colon polyps [J]. Journal of Southern Medical University, 2021, 41(2): 310-312. |
| [12] | CHEN Yonfeng, LI Xiaorong, LAI Weiwei, ZHU Feiyu, TAN Xin, XIAN Wei, KANG Pinfang, WANG Hongju. RIP1/RIP3-MLKL signaling pathway correlates with occurrence, progression and prognosis of chronic heart failure [J]. Journal of Southern Medical University, 2021, 41(10): 1534-1539. |
| [13] | . Inhibition of CD96 enhances interferon-γ secretion by natural killer cells to alleviate lung injury in mice with pulmonary Chlamydia muridarum infection [J]. Journal of Southern Medical University, 2020, 40(07): 930-935. |
| [14] | Relationship between circadian rhythm related brain dysfunction and bipolar disorder. [J]. Journal of Southern Medical University, 2020, 40(06): 822-827. |
| [15] | . Deep learning network-based recognition and localization of diatom images against complex background [J]. Journal of Southern Medical University, 2020, 40(02): 183-189. |
| Viewed | ||||||
|
Full text |
|
|||||
|
Abstract |
|
|||||