Journal of Southern Medical University ›› 2025, Vol. 45 ›› Issue (9): 1859-1866.doi: 10.12122/j.issn.1673-4254.2025.09.06
Jialie JIN1,2( ), Fei WANG1, Liya ZHU1, Xiaojing ZHAO3,4, Jinxin WANG5, Chao ZHU6(), Rongxi YANG1()
Received:2025-03-21
Online:2025-09-20
Published:2025-09-28
Contact:
Chao ZHU, Rongxi YANG
E-mail:jljin@cdc.zj.cn;zhuchaodoctor@163.com;rongxiyang@njmu.edu.cn
Supported by:Jialie JIN, Fei WANG, Liya ZHU, Xiaojing ZHAO, Jinxin WANG, Chao ZHU, Rongxi YANG. Association between MLPH gene hypermethylation in peripheral blood and coronary heart disease[J]. Journal of Southern Medical University, 2025, 45(9): 1859-1866.
Add to citation manager EndNote|Ris|BibTeX
URL: https://www.j-smu.com/EN/10.12122/j.issn.1673-4254.2025.09.06
| Variables | CHD group (n=86) | Control group (n=95) | Z/χ2 | P |
|---|---|---|---|---|
| Gender [n (%)] | 3.113 | 0.078a | ||
| Male | 52 (60.5) | 45 (47.4) | ||
| Female | 34 (39.5) | 50 (52.6) | ||
| Smoking [n (%)] | 7.983 | 0.005a | ||
| Yes | 35 (40.7) | 20 (21.1) | ||
| No | 51 (59.3) | 74 (77.9) | ||
| Drinking [n (%)] | 0.034 | 0.853a | ||
| Yes | 23 (26.7) | 24 (25.3) | ||
| No | 63 (73.3) | 70 (73.7) | ||
| Hypertension [n (%)] | 6.004 | 0.014a | ||
| Yes | 55 (64.0) | 42 (44.2) | ||
| No | 31 (36.0) | 50 (52.6) | ||
| Diabetes [n (%)] | 4.314 | 0.038a | ||
| Yes | 34 (39.5) | 23 (24.2) | ||
| No | 52 (60.5) | 69 (72.6) | ||
| Age (years) | 65 (57, 73) | 63 (61,68) | -0.364 | 0.716b |
| TC (mmol/L) | 3.79 (3.26, 4.41) | 4.21 (3.59, 5.02) | -2.608 | 0.009b |
| TG (mmol/L) | 1.33 (0.97, 1.86) | 1.38 (1.06, 1.92) | -0.562 | 0.574b |
| HDL-C (mmol/L) | 1.03 (0.86, 1.29) | 1.18 (0.91, 1.41) | -1.829 | 0.067b |
| LDL-C (mmol/L) | 2.27 (1.85, 2.76) | 2.64 (2.07, 3.35) | -2.794 | 0.005b |
Tab.1 Baseline data from patients with CHD and normal controls
| Variables | CHD group (n=86) | Control group (n=95) | Z/χ2 | P |
|---|---|---|---|---|
| Gender [n (%)] | 3.113 | 0.078a | ||
| Male | 52 (60.5) | 45 (47.4) | ||
| Female | 34 (39.5) | 50 (52.6) | ||
| Smoking [n (%)] | 7.983 | 0.005a | ||
| Yes | 35 (40.7) | 20 (21.1) | ||
| No | 51 (59.3) | 74 (77.9) | ||
| Drinking [n (%)] | 0.034 | 0.853a | ||
| Yes | 23 (26.7) | 24 (25.3) | ||
| No | 63 (73.3) | 70 (73.7) | ||
| Hypertension [n (%)] | 6.004 | 0.014a | ||
| Yes | 55 (64.0) | 42 (44.2) | ||
| No | 31 (36.0) | 50 (52.6) | ||
| Diabetes [n (%)] | 4.314 | 0.038a | ||
| Yes | 34 (39.5) | 23 (24.2) | ||
| No | 52 (60.5) | 69 (72.6) | ||
| Age (years) | 65 (57, 73) | 63 (61,68) | -0.364 | 0.716b |
| TC (mmol/L) | 3.79 (3.26, 4.41) | 4.21 (3.59, 5.02) | -2.608 | 0.009b |
| TG (mmol/L) | 1.33 (0.97, 1.86) | 1.38 (1.06, 1.92) | -0.562 | 0.574b |
| HDL-C (mmol/L) | 1.03 (0.86, 1.29) | 1.18 (0.91, 1.41) | -1.829 | 0.067b |
| LDL-C (mmol/L) | 2.27 (1.85, 2.76) | 2.64 (2.07, 3.35) | -2.794 | 0.005b |
| CpG sites | CHD group (n=86) | Control group (n=95) | Z | P* |
|---|---|---|---|---|
| TSSC1_CpG_1 | 0.89 (0.82, 0.95) | 0.85 (0.77, 0.93) | -1.258 | 0.208 |
| TSSC1_CpG_6/cg23245316 | 0.43 (0.33, 0.53) | 0.41 (0.32, 0.55) | -0.007 | 0.994 |
| TSSC1_CpG_7 | 1.00 (0.98, 1.00) | 1.00 (0.97, 1.00) | -0.389 | 0.697 |
| TSSC1_CpG_8 | 0.68 (0.60, 0.77) | 0.67 (0.59, 0.73) | -1.474 | 0.140 |
| TSSC1_CpG_12 | 1.00 (0.89, 1.00) | 1.00 (0.91, 1.00) | -0.315 | 0.753 |
| TSSC1_CpG_14 | 0.33 (0.26, 0.39) | 0.31 (0.24, 0.39) | -0.942 | 0.346 |
| TSSC1_CpG_15 | 0.38 (0.33, 0.50) | 0.42 (0.32, 0.49) | -0.329 | 0.742 |
| TSSC1_CpG_16 | 0.96 (0.92, 0.97) | 0.96 (0.93, 0.97) | -0.593 | 0.553 |
| TSSC1_CpG_17 | 1.00 (1.00, 1.00) | 1.00 (0.98, 1.00) | -1.629 | 0.103 |
| TSSC1_CpG_18 | 0.98 (0.95, 0.99) | 0.99 (0.96, 0.99) | -0.468 | 0.640 |
| MLPH_CpG_2.7 | 0.85 (0.81, 0.93) | 0.84 (0.80, 0.90) | -1.715 | 0.086 |
| MLPH_CpG_3/cg06639874 | 0.92 (0.84, 0.97) | 0.90 (0.87, 0.94) | -0.657 | 0.511 |
| MLPH_CpG_4 | 0.94 (0.89, 0.99) | 0.94 (0.88, 0.96) | -1.410 | 0.159 |
| MLPH_CpG_5 | 0.87 (0.82, 0.95) | 0.86 (0.82, 0.90) | -1.763 | 0.078 |
| MLPH_CpG_6 | 0.59 (0.37, 0.69) | 0.56 (0.36, 0.67) | -1.217 | 0.224 |
Tab.2 Differences in methylation levels of TSSC1 and MLPH genes between CHD and control groups [M(P25, P75)]
| CpG sites | CHD group (n=86) | Control group (n=95) | Z | P* |
|---|---|---|---|---|
| TSSC1_CpG_1 | 0.89 (0.82, 0.95) | 0.85 (0.77, 0.93) | -1.258 | 0.208 |
| TSSC1_CpG_6/cg23245316 | 0.43 (0.33, 0.53) | 0.41 (0.32, 0.55) | -0.007 | 0.994 |
| TSSC1_CpG_7 | 1.00 (0.98, 1.00) | 1.00 (0.97, 1.00) | -0.389 | 0.697 |
| TSSC1_CpG_8 | 0.68 (0.60, 0.77) | 0.67 (0.59, 0.73) | -1.474 | 0.140 |
| TSSC1_CpG_12 | 1.00 (0.89, 1.00) | 1.00 (0.91, 1.00) | -0.315 | 0.753 |
| TSSC1_CpG_14 | 0.33 (0.26, 0.39) | 0.31 (0.24, 0.39) | -0.942 | 0.346 |
| TSSC1_CpG_15 | 0.38 (0.33, 0.50) | 0.42 (0.32, 0.49) | -0.329 | 0.742 |
| TSSC1_CpG_16 | 0.96 (0.92, 0.97) | 0.96 (0.93, 0.97) | -0.593 | 0.553 |
| TSSC1_CpG_17 | 1.00 (1.00, 1.00) | 1.00 (0.98, 1.00) | -1.629 | 0.103 |
| TSSC1_CpG_18 | 0.98 (0.95, 0.99) | 0.99 (0.96, 0.99) | -0.468 | 0.640 |
| MLPH_CpG_2.7 | 0.85 (0.81, 0.93) | 0.84 (0.80, 0.90) | -1.715 | 0.086 |
| MLPH_CpG_3/cg06639874 | 0.92 (0.84, 0.97) | 0.90 (0.87, 0.94) | -0.657 | 0.511 |
| MLPH_CpG_4 | 0.94 (0.89, 0.99) | 0.94 (0.88, 0.96) | -1.410 | 0.159 |
| MLPH_CpG_5 | 0.87 (0.82, 0.95) | 0.86 (0.82, 0.90) | -1.763 | 0.078 |
| MLPH_CpG_6 | 0.59 (0.37, 0.69) | 0.56 (0.36, 0.67) | -1.217 | 0.224 |
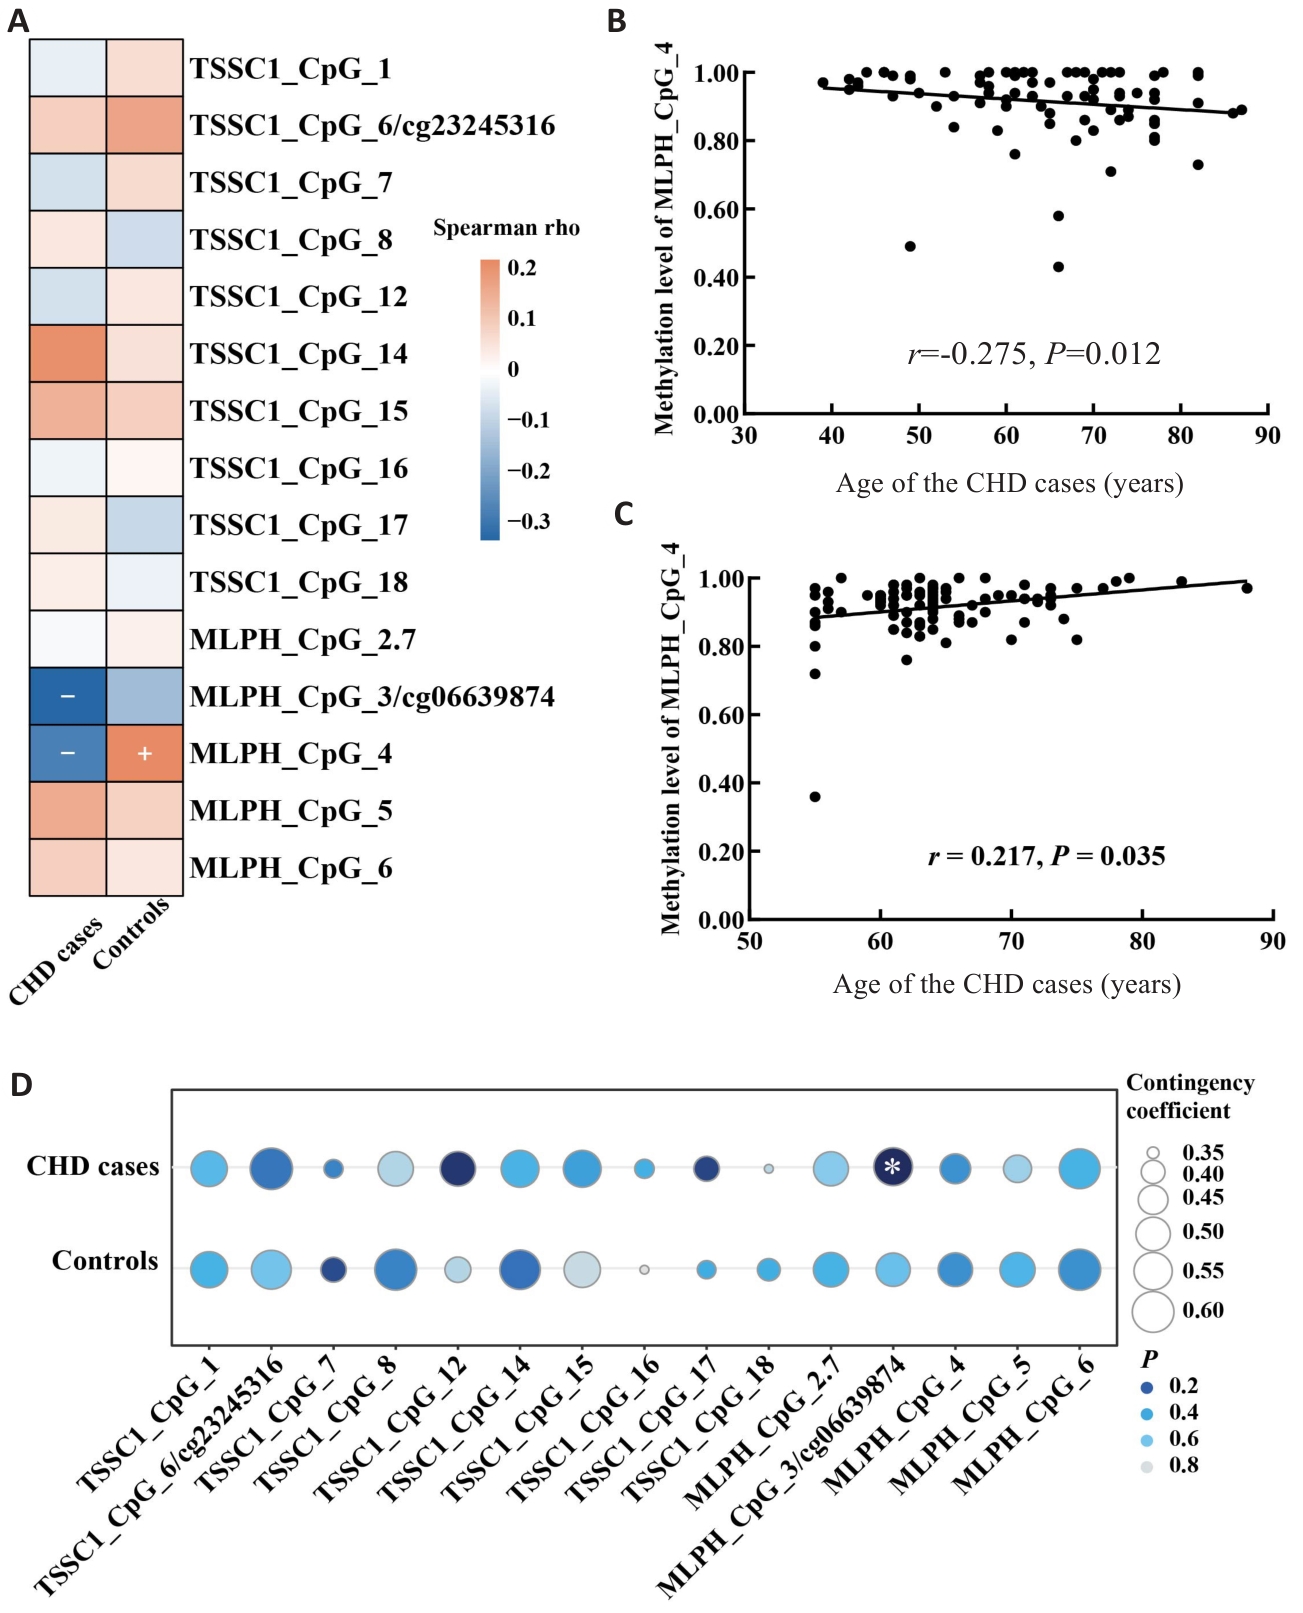
Fig.1 Correlation of methylation levels of TSSC1 and MLPH genes with age and male. A: Heat map of the correlation between age and methylation levels. B: Scatter plot of the correlation between MLPH_CpG_4 methylation level and age in CHD cases. C: Scatter plot of the correlation between MLPH_CpG_4 methylation level and age in control group. D: Bubble chart of the correlation between male gender and methylation levels.
| CpG sites | Age<65 years (n=101) | Age≥65 year (n=80) | |||||
|---|---|---|---|---|---|---|---|
| CHD (n=41) | Control (n=0) | P* | CHD (n=45) | Control (n=35) | P * | ||
| TSSC1_CpG_1 | 0.92 (0.82, 0.95) | 0.85 (0.76, 0.93) | 0.151 | 0.89 (0.79, 0.95) | 0.86 (0.76, 0.95) | 0.725 | |
| TSSC1_CpG_6/cg23245316 | 0.42 (0.29, 0.53) | 0.40 (0.29, 0.55) | 0.730 | 0.44 (0.34, 0.54) | 0.45 (0.36, 0.58) | 0.470 | |
| TSSC1_CpG_7 | 1.00 (0.97, 1.00) | 1.00 (0.97, 1.00) | 0.888 | 1.00 (0.98, 1.00) | 1.00 (0.96, 1.00) | 0.419 | |
| TSSC1_CpG_8 | 0.68 (0.56, 0.76) | 0.68 (0.59, 0.73) | 0.921 | 0.69 (0.62, 0.77) | 0.66 (0.59, 0.73) | 0.233 | |
| TSSC1_CpG_12 | 1.00 (0.90, 1.00) | 1.00 (0.89, 1.00) | 0.687 | 1.00 (0.89, 1.00) | 1.00 (0.93, 1.00) | 0.352 | |
| TSSC1_CpG_14 | 0.33 (0.25, 0.39) | 0.31 (0.25, 0.38) | 0.888 | 0.34 (0.29, 0.42) | 0.32 (0.21, 0.43) | 0.384 | |
| TSSC1_CpG_15 | 0.37 (0.31, 0.51) | 0.42 (0.31, 0.47) | 0.969 | 0.40 (0.33, 0.50) | 0.42 (0.35, 0.50) | 0.507 | |
| TSSC1_CpG_16 | 0.96 (0.94, 0.97) | 0.96 (0.92, 0.97) | 1.000 | 0.96 (0.90, 0.97) | 0.96 (0.93, 0.97) | 0.405 | |
| TSSC1_CpG_17 | 1.00 (1.00, 1.00) | 1.00 (0.99, 1.00) | 0.701 | 1.00 (1.00, 1.00) | 1.00 (0.98, 1.00) | 0.051 | |
| TSSC1_CpG_18 | 0.98 (0.94, 0.99) | 0.99 (0.95, 0.99) | 0.320 | 0.99 (0.96, 0.99) | 0.98 (0.96, 0.99) | 0.744 | |
| MLPH_CpG_2.7 | 0.86 (0.83, 0.94) | 0.83 (0.80, 0.89) | 0.014 | 0.85 (0.80, 0.91) | 0.85 (0.79, 0.93) | 0.941 | |
| MLPH_CpG_3/cg06639874 | 0.95 (0.87, 0.98) | 0.91 (0.88, 0.96) | 0.147 | 0.89 (0.82, 0.94) | 0.89 (0.83, 0.93) | 0.930 | |
| MLPH_CpG_4 | 0.97 (0.93, 1.00) | 0.93 (0.87, 0.95) | 0.001 | 0.92 (0.86, 0.98) | 0.94 (0.89, 0.97) | 0.187 | |
| MLPH_CpG_5 | 0.86 (0.81, 0.95) | 0.86 (0.82, 0.89) | 0.652 | 0.90 (0.84, 0.95) | 0.87 (0.84, 0.91) | 0.104 | |
| MLPH_CpG_6 | 0.58 (0.35, 0.71) | 0.55 (0.35, 0.67) | 0.568 | 0.62 (0.41, 0.69) | 0.57 (0.39, 0.66) | 0.284 | |
| *The P values were calculated by the Mann-Whitney U test. | |||||||
Tab.4 Differences in TSSC1 and MLPH gene methylation between CHD and control groups stratified by age [M (P25,P75)]
| CpG sites | Age<65 years (n=101) | Age≥65 year (n=80) | |||||
|---|---|---|---|---|---|---|---|
| CHD (n=41) | Control (n=0) | P* | CHD (n=45) | Control (n=35) | P * | ||
| TSSC1_CpG_1 | 0.92 (0.82, 0.95) | 0.85 (0.76, 0.93) | 0.151 | 0.89 (0.79, 0.95) | 0.86 (0.76, 0.95) | 0.725 | |
| TSSC1_CpG_6/cg23245316 | 0.42 (0.29, 0.53) | 0.40 (0.29, 0.55) | 0.730 | 0.44 (0.34, 0.54) | 0.45 (0.36, 0.58) | 0.470 | |
| TSSC1_CpG_7 | 1.00 (0.97, 1.00) | 1.00 (0.97, 1.00) | 0.888 | 1.00 (0.98, 1.00) | 1.00 (0.96, 1.00) | 0.419 | |
| TSSC1_CpG_8 | 0.68 (0.56, 0.76) | 0.68 (0.59, 0.73) | 0.921 | 0.69 (0.62, 0.77) | 0.66 (0.59, 0.73) | 0.233 | |
| TSSC1_CpG_12 | 1.00 (0.90, 1.00) | 1.00 (0.89, 1.00) | 0.687 | 1.00 (0.89, 1.00) | 1.00 (0.93, 1.00) | 0.352 | |
| TSSC1_CpG_14 | 0.33 (0.25, 0.39) | 0.31 (0.25, 0.38) | 0.888 | 0.34 (0.29, 0.42) | 0.32 (0.21, 0.43) | 0.384 | |
| TSSC1_CpG_15 | 0.37 (0.31, 0.51) | 0.42 (0.31, 0.47) | 0.969 | 0.40 (0.33, 0.50) | 0.42 (0.35, 0.50) | 0.507 | |
| TSSC1_CpG_16 | 0.96 (0.94, 0.97) | 0.96 (0.92, 0.97) | 1.000 | 0.96 (0.90, 0.97) | 0.96 (0.93, 0.97) | 0.405 | |
| TSSC1_CpG_17 | 1.00 (1.00, 1.00) | 1.00 (0.99, 1.00) | 0.701 | 1.00 (1.00, 1.00) | 1.00 (0.98, 1.00) | 0.051 | |
| TSSC1_CpG_18 | 0.98 (0.94, 0.99) | 0.99 (0.95, 0.99) | 0.320 | 0.99 (0.96, 0.99) | 0.98 (0.96, 0.99) | 0.744 | |
| MLPH_CpG_2.7 | 0.86 (0.83, 0.94) | 0.83 (0.80, 0.89) | 0.014 | 0.85 (0.80, 0.91) | 0.85 (0.79, 0.93) | 0.941 | |
| MLPH_CpG_3/cg06639874 | 0.95 (0.87, 0.98) | 0.91 (0.88, 0.96) | 0.147 | 0.89 (0.82, 0.94) | 0.89 (0.83, 0.93) | 0.930 | |
| MLPH_CpG_4 | 0.97 (0.93, 1.00) | 0.93 (0.87, 0.95) | 0.001 | 0.92 (0.86, 0.98) | 0.94 (0.89, 0.97) | 0.187 | |
| MLPH_CpG_5 | 0.86 (0.81, 0.95) | 0.86 (0.82, 0.89) | 0.652 | 0.90 (0.84, 0.95) | 0.87 (0.84, 0.91) | 0.104 | |
| MLPH_CpG_6 | 0.58 (0.35, 0.71) | 0.55 (0.35, 0.67) | 0.568 | 0.62 (0.41, 0.69) | 0.57 (0.39, 0.66) | 0.284 | |
| *The P values were calculated by the Mann-Whitney U test. | |||||||
| CpG sites | Female (n=84) | Male (n=97) | |||||
|---|---|---|---|---|---|---|---|
| CHD (n=34) | Control (n=50) | P* | CHD (n = 52) | Control (n = 45) | P* | ||
| TSSC1_CpG_1 | 0.90 (0.83, 0.96) | 0.85 (0.75, 0.95) | 0.135 | 0.89 (0.76, 0.95) | 0.86 (0.79, 0.93) | 0.566 | |
| TSSC1_CpG_6/cg23245316 | 0.44 (0.33, 0.55) | 0.38 (0.31, 0.48) | 0.160 | 0.43 (0.32, 0.52) | 0.45 (0.35, 0.58) | 0.114 | |
| TSSC1_CpG_7 | 1.00 (0.97, 1.00) | 1.00 (0.97, 1.00) | 0.545 | 1.00 (0.98, 1.00) | 1.00 (0.96, 1.00) | 0.298 | |
| TSSC1_CpG_8 | 0.74 (0.68, 0.79) | 0.68 (0.59, 0.73) | 0.014 | 0.65 (0.52, 0.72) | 0.66 (0.58, 0.72) | 0.420 | |
| TSSC1_CpG_12 | 1.00 (0.91, 1.00) | 1.00 (0.92, 1.00) | 0.467 | 1.00 (0.88, 1.00) | 0.98 (0.90, 1.00) | 0.687 | |
| TSSC1_CpG_14 | 0.35 (0.27, 0.41) | 0.33 (0.24, 0.43) | 0.461 | 0.33 (0.25, 0.39) | 0.30 (0.24, 0.36) | 0.349 | |
| TSSC1_CpG_15 | 0.43 (0.34, 0.53) | 0.41 (0.31, 0.46) | 0.131 | 0.38 (0.30, 0.46) | 0.44 (0.34, 0.52) | 0.077 | |
| TSSC1_CpG_16 | 0.96 (0.90, 0.97) | 0.96 (0.92, 0.97) | 0.447 | 0.96 (0.93, 0.97) | 0.96 (0.93, 0.97) | 0.870 | |
| TSSC1_CpG_17 | 1.00 (1.00, 1.00) | 1.00 (0.99, 1.00) | 0.134 | 1.00 (1.00, 1.00) | 1.00 (0.98, 1.00) | 0.290 | |
| TSSC1_CpG_18 | 0.98 (0.96, 0.99) | 0.99 (0.96, 0.99) | 0.677 | 0.99 (0.93, 0.99) | 0.99 (0.95, 0.99) | 0.756 | |
| MLPH_CpG_2.7 | 0.83 (0.77, 0.89) | 0.84 (0.80, 0.91) | 0.323 | 0.87 (0.83, 0.94) | 0.83 (0.78, 0.88) | 0.004 | |
| MLPH_CpG_3/cg06639874 | 0.90 (0.81, 0.95) | 0.91 (0.86, 0.96) | 0.215 | 0.94 (0.86, 0.97) | 0.90 (0.87, 0.92) | 0.044 | |
| MLPH_CpG_4 | 0.93 (0.86, 1.00) | 0.93 (0.89, 0.96) | 0.966 | 0.95 (0.90, 0.99) | 0.94 (0.88, 0.96) | 0.090 | |
| MLPH_CpG_5 | 0.86 (0.82, 0.93) | 0.85 (0.82, 0.89) | 0.294 | 0.90 (0.83, 0.95) | 0.87 (0.84, 0.91) | 0.228 | |
| MLPH_CpG_6 | 0.62 (0.44, 0.69) | 0.49 (0.31, 0.64) | 0.099 | 0.58 (0.34, 0.74) | 0.58 (0.41, 0.68) | 0.981 | |
Tab.5 Differences in TSSC1 and MLPH gene methylation between CHD and control groups stratified by sex [M (P25,P75)]
| CpG sites | Female (n=84) | Male (n=97) | |||||
|---|---|---|---|---|---|---|---|
| CHD (n=34) | Control (n=50) | P* | CHD (n = 52) | Control (n = 45) | P* | ||
| TSSC1_CpG_1 | 0.90 (0.83, 0.96) | 0.85 (0.75, 0.95) | 0.135 | 0.89 (0.76, 0.95) | 0.86 (0.79, 0.93) | 0.566 | |
| TSSC1_CpG_6/cg23245316 | 0.44 (0.33, 0.55) | 0.38 (0.31, 0.48) | 0.160 | 0.43 (0.32, 0.52) | 0.45 (0.35, 0.58) | 0.114 | |
| TSSC1_CpG_7 | 1.00 (0.97, 1.00) | 1.00 (0.97, 1.00) | 0.545 | 1.00 (0.98, 1.00) | 1.00 (0.96, 1.00) | 0.298 | |
| TSSC1_CpG_8 | 0.74 (0.68, 0.79) | 0.68 (0.59, 0.73) | 0.014 | 0.65 (0.52, 0.72) | 0.66 (0.58, 0.72) | 0.420 | |
| TSSC1_CpG_12 | 1.00 (0.91, 1.00) | 1.00 (0.92, 1.00) | 0.467 | 1.00 (0.88, 1.00) | 0.98 (0.90, 1.00) | 0.687 | |
| TSSC1_CpG_14 | 0.35 (0.27, 0.41) | 0.33 (0.24, 0.43) | 0.461 | 0.33 (0.25, 0.39) | 0.30 (0.24, 0.36) | 0.349 | |
| TSSC1_CpG_15 | 0.43 (0.34, 0.53) | 0.41 (0.31, 0.46) | 0.131 | 0.38 (0.30, 0.46) | 0.44 (0.34, 0.52) | 0.077 | |
| TSSC1_CpG_16 | 0.96 (0.90, 0.97) | 0.96 (0.92, 0.97) | 0.447 | 0.96 (0.93, 0.97) | 0.96 (0.93, 0.97) | 0.870 | |
| TSSC1_CpG_17 | 1.00 (1.00, 1.00) | 1.00 (0.99, 1.00) | 0.134 | 1.00 (1.00, 1.00) | 1.00 (0.98, 1.00) | 0.290 | |
| TSSC1_CpG_18 | 0.98 (0.96, 0.99) | 0.99 (0.96, 0.99) | 0.677 | 0.99 (0.93, 0.99) | 0.99 (0.95, 0.99) | 0.756 | |
| MLPH_CpG_2.7 | 0.83 (0.77, 0.89) | 0.84 (0.80, 0.91) | 0.323 | 0.87 (0.83, 0.94) | 0.83 (0.78, 0.88) | 0.004 | |
| MLPH_CpG_3/cg06639874 | 0.90 (0.81, 0.95) | 0.91 (0.86, 0.96) | 0.215 | 0.94 (0.86, 0.97) | 0.90 (0.87, 0.92) | 0.044 | |
| MLPH_CpG_4 | 0.93 (0.86, 1.00) | 0.93 (0.89, 0.96) | 0.966 | 0.95 (0.90, 0.99) | 0.94 (0.88, 0.96) | 0.090 | |
| MLPH_CpG_5 | 0.86 (0.82, 0.93) | 0.85 (0.82, 0.89) | 0.294 | 0.90 (0.83, 0.95) | 0.87 (0.84, 0.91) | 0.228 | |
| MLPH_CpG_6 | 0.62 (0.44, 0.69) | 0.49 (0.31, 0.64) | 0.099 | 0.58 (0.34, 0.74) | 0.58 (0.41, 0.68) | 0.981 | |
| [1] | Virani SS, Alonso A, Aparicio HJ, et al. Heart disease and stroke statistics-2021 update: a report from the American heart association[J]. Circulation, 2021, 143(8): e254-743. doi:10.1161/cir.0000000000000950 |
| [2] | 中国心血管健康与疾病报告2021概要[J]. 中国循环杂志, 2022, 37 (6): 553-78. doi:10.3969/j.issn.1004-8812.2022.07.001 |
| [3] | Desiderio A, Pastorino M, Campitelli M, et al. DNA methylation in cardiovascular disease and heart failure: novel prediction models?[J]. Clin Epigenetics, 2024, 16(1): 115. doi:10.1186/s13148-024-01722-x |
| [4] | Dai Y, Chen D, Xu T. DNA methylation aberrant in atherosclerosis[J]. Front Pharmacol, 2022, 13: 815977. doi:10.3389/fphar.2022.815977 |
| [5] | Zhu L, Zhu C, Wang J, et al. The association between DNA methylation of 6p21.33 and AHRR in blood and coronary heart disease in Chinese population[J]. BMC Cardiovasc Disord, 2022, 22(1): 370. doi:10.1186/s12872-022-02766-8 |
| [6] | Agha G, Mendelson MM, Ward-Caviness CK, et al. Blood leukocyte DNA methylation predicts risk of future myocardial infarction and coronary heart disease[J]. Circulation, 2019, 140(8): 645-57. doi:10.1161/circulationaha.118.039357 |
| [7] | Nam AR, Lee KH, Hwang HJ, et al. Alternative methylation of intron motifs is associated with cancer-related gene expression in both canine mammary tumor and human breast cancer[J]. Clin Epigenetics, 2020, 12(1): 110. doi:10.1186/s13148-020-00888-4 |
| [8] | Bi L, Jin J, Fan Y, et al. Blood-based HYAL2 methylation as a potential marker for the preclinical detection of coronary heart disease and stroke[J]. Clin Epigenetics, 2024, 16(1): 130. doi:10.1186/s13148-024-01742-7 |
| [9] | Yin Q, Yang X, Li L, et al. The association between breast cancer and blood-based methylation of S100P and HYAL2 in the Chinese population[J]. Front Genet, 2020, 11: 977. doi:10.3389/fgene.2020.00977 |
| [10] | Long P, Si J, Zhu Z, et al. Genome-wide DNA methylation profiling in blood reveals epigenetic signature of incident acute coronary syndrome[J]. Nat Commun, 2024, 15(1): 7431. doi:10.1038/s41467-024-51751-6 |
| [11] | Infante T, Franzese M, Ruocco A, et al. ABCA1, TCF7, NFATC1, PRKCZ, and PDGFA DNA methylation as potential epigenetic-sensitive targets in acute coronary syndrome via network analysis[J]. Epigenetics, 2022, 17(5): 547-63. doi:10.1080/15592294.2021.1939481 |
| [12] | Salah HT, Yang RK, Roy-Chowdhuri S, et al. Spitz melanocytic neoplasms with MLPH: : ALK fusions: report of two cases with previously unreported features and literature review[J]. J Cutan Pathol, 2024, 51(6): 407-14. doi:10.1111/cup.14605 |
| [13] | Krushkal J, Silvers T, Reinhold WC, et al. Epigenome-wide DNA methylation analysis of small cell lung cancer cell lines suggests potential chemotherapy targets[J]. Clin Epigenetics, 2020, 12(1): 93. doi:10.1186/s13148-020-00876-8 |
| [14] | Zhang T, Sun Y, Zheng T, et al. MLPH accelerates the epithelial-mesenchymal transition in prostate cancer[J]. Onco Targets Ther, 2020, 13: 701-8. doi:10.2147/ott.s225023 |
| [15] | Wang DC, Wang HF, Yuan ZN. Runx2 induces bone osteolysis by transcriptional suppression of TSSC1[J]. Biochem Biophys Res Commun, 2013, 438(4): 635-9. doi:10.1016/j.bbrc.2013.07.131 |
| [16] | Ramakrishnan S, Cortes-Gomez E, Athans SR, et al. Race-specific coregulatory and transcriptomic profiles associated with DNA methylation and androgen receptor in prostate cancer[J]. Genome Med, 2024, 16(1): 52. doi:10.1186/s13073-024-01323-6 |
| [17] | Jiménez A, Vlacho B, Mata-Cases M, et al. Sex and age significantly modulate cardiovascular disease presentation in type 2 diabetes: a large population-based cohort study[J]. Front Endocrinol: Lausanne, 2024, 15: 1344007. doi:10.3389/fendo.2024.1344007 |
| [18] | Liu C, Yin Q, Li M, et al. ACTB methylation in blood as a potential marker for the pre-clinical detection of stroke: a prospective nested case-control study[J]. Front Neurosci, 2021, 15: 644943. doi:10.3389/fnins.2021.644943 |
| [19] | Schott S, Yang R, Stöcker S, et al. HYAL2 methylation in peripheral blood as a potential marker for the detection of pancreatic cancer: a case control study[J]. Oncotarget, 2017, 8(40): 67614-25. doi:10.18632/oncotarget.18757 |
| [20] | Ramezankhani A, Azizi F, Hadaegh F. Sex differences in risk factors for coronary heart disease events: a prospective cohort study in Iran[J]. Sci Rep, 2023, 13(1): 22398. doi:10.1038/s41598-023-50028-0 |
| [21] | Lee GB, Nam GE, Kim W, et al. Association between premature menopause and cardiovascular diseases and all-cause mortality in Korean women[J]. J Am Heart Assoc, 2023, 12(22): e030117. doi:10.1161/jaha.123.030117 |
| [22] | Goldsborough E, Osuji N, Blaha MJ. Assessment of cardiovascular disease risk a 2022 update[J]. Endocrinol Metab Clin N Am, 2022, 51(3): 483-509. doi:10.1016/j.ecl.2022.02.005 |
| [23] | Andersson C, Nayor M, Tsao CW, et al. Framingham heart study: JACC focus seminar, 1/8[J]. J Am Coll Cardiol, 2021, 77(21): 2680-92. doi:10.1016/j.jacc.2021.01.059 |
| [24] | Marrugat J, Vila J, Baena-Díez JM, et al. Relative validity of the 10-year cardiovascular risk estimate in a population cohort of the REGICOR study[J]. Rev Esp Cardiol, 2011, 64(5): 385-94. doi:10.1016/j.rec.2010.12.017 |
| [25] | Erdmann J, van der Laan SW. Unfolding and disentangling coronary vascular disease through genome-wide association studies[J]. Eur Heart J, 2021, 42(9): 934-7. doi:10.1093/eurheartj/ehaa1089 |
| [26] | Hartiala JA, Han Y, Jia Q, et al. Genome-wide analysis identifies novel susceptibility loci for myocardial infarction[J]. Eur Heart J, 2021, 42(9): 919-33. |
| [27] | Shah S, Henry A, Roselli C, et al. Genome-wide association and Mendelian randomisation analysis provide insights into the pathogenesis of heart failure[J]. Nat Commun, 2020, 11(1): 163. |
| [28] | Tcheandjieu C, Zhu X, Hilliard AT, et al. Large-scale genome-wide association study of coronary artery disease in genetically diverse populations[J]. Nat Med, 2022, 28(8): 1679-92. |
| [29] | Joáo Job PM, Dos Reis Lívero FA, Junior AG. Epigenetic control of hypertension by DNA methylation: a real possibility[J]. Curr Pharm Des, 2021, 27(35): 3722-8. doi:10.2174/1381612827666210322141703 |
| [30] | Nadiger N, Veed JK, Chinya Nataraj P, et al. DNA methylation and type 2 diabetes: a systematic review[J]. Clin Epigenetics, 2024, 16(1): 67. doi:10.1186/s13148-024-01670-6 |
| [31] | Wang S, Zha L, Cui X, et al. Epigenetic regulation of hepatic lipid metabolism by DNA methylation[J]. Adv Sci: Weinh, 2023, 10(20): e2206068. doi:10.1002/advs.202206068 |
| [32] | Xie M, Tang Q, Nie J, et al. BMAL1-downregulation aggravates Porphyromonas gingivalis-induced atherosclerosis by encouraging oxidative stress[J]. Circ Res, 2020, 126(6): e15-29. doi:10.1161/circresaha.119.315502 |
| [33] | Xia YJ, Brewer A, Bell JT. DNA methylation signatures of incident coronary heart disease: findings from epigenome-wide association studies[J]. Clin Epigenet, 2021, 13(1): 186. doi:10.1186/s13148-021-01175-6 |
| [34] | Uddin MDM, Nguyen NQH, Yu B, et al. Clonal hematopoiesis of indeterminate potential, DNA methylation, and risk for coronary artery disease[J]. Nat Commun, 2022, 13(1): 5350. doi:10.1038/s41467-022-33093-3 |
| [35] | Zhang X, Wang C, He D, et al. Identification of DNA methylation-regulated genes as potential biomarkers for coronary heart disease via machine learning in the Framingham Heart Study[J]. Clin Epigenetics, 2022, 14(1): 122. doi:10.1186/s13148-022-01343-2 |
| [36] | Feng CH, Chang YM, Weng JR. Rapid methylation of valsartan in human plasma using evaporative derivatization reagent to improve its sensitivity in MALDI-TOF mass spectrometry[J]. Anal Methods, 2022, 14(37): 3694-701. doi:10.1039/d2ay01164f |
| Viewed | ||||||
|
Full text |
|
|||||
|
Abstract |
|
|||||