Journal of Southern Medical University ›› 2025, Vol. 45 ›› Issue (6): 1174-1184.doi: 10.12122/j.issn.1673-4254.2025.06.07
Kaiyue HUANG1( ), Jingxin QI1, Wenqian LUO1, Yixuan LIN1, Meimei CHEN1,2(), Huijuan GAN1,2()
Received:2025-01-09
Online:2025-06-20
Published:2025-06-27
Contact:
Meimei CHEN, Huijuan GAN
E-mail:huangkaiyue1017@163.com;chenmeimei1984@163.com;hjganzz@126.com
Kaiyue HUANG, Jingxin QI, Wenqian LUO, Yixuan LIN, Meimei CHEN, Huijuan GAN. Wendan Decoction ameliorates metabolic phenotypes in rats with metabolic syndrome and phlegm syndrome by modulating the gut microbiota-bile acid axis[J]. Journal of Southern Medical University, 2025, 45(6): 1174-1184.
Add to citation manager EndNote|Ris|BibTeX
URL: https://www.j-smu.com/EN/10.12122/j.issn.1673-4254.2025.06.07
| Indicator | NC group (n=8) | MG group (n=24) |
|---|---|---|
| Weight (g) | 363.74±14.85 | 387.68±26.37* |
| Body length (cm) | 22.66±0.40 | 22.57±0.41 |
| Abdominal girth (cm) | 18.94±0.32 | 20.60±0.67** |
| Lee's index | 314.96±2.72 | 322.88±2.08** |
| TG [mmol/L, M (P25, P75)] | 1.13(1.01, 1.20) | 1.48(1.15,1.78)** |
| TC (mmol/L) | 2.49±0.07 | 3.56±0.57** |
| HDL (mmol/L) | 1.32±0.10 | 0.63±0.14** |
| LDL (mmol/L) | 0.30±0.11 | 1.78±0.59** |
| FBG (mmol/L) | 4.35±0.26 | 12.27±2.59** |
| FINS (μU/mL) | 40.21±5.37 | 75.83±17.89** |
| HOMA-IR | 7.82±1.45 | 41.68±14.63** |
Tab.1 Comparison of general conditions and glucose and lipid metabolism parameters between normal and model groups (Mean±SD)
| Indicator | NC group (n=8) | MG group (n=24) |
|---|---|---|
| Weight (g) | 363.74±14.85 | 387.68±26.37* |
| Body length (cm) | 22.66±0.40 | 22.57±0.41 |
| Abdominal girth (cm) | 18.94±0.32 | 20.60±0.67** |
| Lee's index | 314.96±2.72 | 322.88±2.08** |
| TG [mmol/L, M (P25, P75)] | 1.13(1.01, 1.20) | 1.48(1.15,1.78)** |
| TC (mmol/L) | 2.49±0.07 | 3.56±0.57** |
| HDL (mmol/L) | 1.32±0.10 | 0.63±0.14** |
| LDL (mmol/L) | 0.30±0.11 | 1.78±0.59** |
| FBG (mmol/L) | 4.35±0.26 | 12.27±2.59** |
| FINS (μU/mL) | 40.21±5.37 | 75.83±17.89** |
| HOMA-IR | 7.82±1.45 | 41.68±14.63** |
| Indicators | NC group | MOD group | WDT group | MET group |
|---|---|---|---|---|
| Weight (g) | 373.76±13.28 | 392.61±25.51 | 353.84±27.74△△ | 359.29±29.29△ |
| Body length (cm) | 23.68±0.25 | 23.44±0.27 | 23.63±0.23 | 23.54±0.29 |
| Abdominal girth (cm) | 20.28±0.30 | 21.93±0.30** | 19.71±0.48△△ | 19.99±0.59△△ |
| Lee's index | 304.22±1.45 | 312.27±3.52** | 299.17±5.08△△ | 301.81±5.57△△ |
| TG (mmol/L) | 0.70±0.10 | 1.07±0.11** | 0.78±0.15△△ | 0.93±0.14△ |
| TC (mmol/L) | 2.43±0.09 | 3.63±0.39** | 2.73±0.40△△ | 2.83±0.33△△ |
| HDL (mmol/L) | 0.97±0.20 | 0.59±0.14** | 1.06±0.13△△ | 0.99±0.17△△ |
| LDL (mmol/L) | 0.26±0.02 | 1.08±0.18** | 0.40±0.09△△ | 0.49±0.13△△ |
| FBG (mmol/L) | 4.84±0.17 | 14.23±1.66** | 8.45±3.07△△ | 9.66±2.66△△ |
| FINS [μU/mL, M(P25, P75)] | 67.12(61.33, 69.65) | 81.30(80.17, 84.82)** | 67.75(64.43, 71.07)△△ | 72.92(70.53, 79.02) |
| HOMA-IR | 14.15±0.84 | 52.72±6.74** | 25.24±9.67△△ | 32.00±10.06△△ |
| LPS (ng/mL) | 0.99±0.24 | 3.68±0.41** | 1.94±0.18△△ | 2.48±0.27△△ |
Tab.2 Comparison of general conditions and glucose and lipid metabolism parameters of the rats after interventions (n=8, Mean±SD)
| Indicators | NC group | MOD group | WDT group | MET group |
|---|---|---|---|---|
| Weight (g) | 373.76±13.28 | 392.61±25.51 | 353.84±27.74△△ | 359.29±29.29△ |
| Body length (cm) | 23.68±0.25 | 23.44±0.27 | 23.63±0.23 | 23.54±0.29 |
| Abdominal girth (cm) | 20.28±0.30 | 21.93±0.30** | 19.71±0.48△△ | 19.99±0.59△△ |
| Lee's index | 304.22±1.45 | 312.27±3.52** | 299.17±5.08△△ | 301.81±5.57△△ |
| TG (mmol/L) | 0.70±0.10 | 1.07±0.11** | 0.78±0.15△△ | 0.93±0.14△ |
| TC (mmol/L) | 2.43±0.09 | 3.63±0.39** | 2.73±0.40△△ | 2.83±0.33△△ |
| HDL (mmol/L) | 0.97±0.20 | 0.59±0.14** | 1.06±0.13△△ | 0.99±0.17△△ |
| LDL (mmol/L) | 0.26±0.02 | 1.08±0.18** | 0.40±0.09△△ | 0.49±0.13△△ |
| FBG (mmol/L) | 4.84±0.17 | 14.23±1.66** | 8.45±3.07△△ | 9.66±2.66△△ |
| FINS [μU/mL, M(P25, P75)] | 67.12(61.33, 69.65) | 81.30(80.17, 84.82)** | 67.75(64.43, 71.07)△△ | 72.92(70.53, 79.02) |
| HOMA-IR | 14.15±0.84 | 52.72±6.74** | 25.24±9.67△△ | 32.00±10.06△△ |
| LPS (ng/mL) | 0.99±0.24 | 3.68±0.41** | 1.94±0.18△△ | 2.48±0.27△△ |

Fig.1 Pathological observation of liver tissues of the rats in each group (HE, original magnification:×200). A: Normal group. B: Model group. C:Wendan Decoction group. D: Metformin group.
| Group | FXR/GAPDH | CYP7A1/GAPDH | FGFR4/GAPDH |
|---|---|---|---|
| NC | 0.59±0.08 | 0.65±0.18 | 0.61±0.06 |
| MOD | 0.27±0.06** | 3.00±0.15** | 0.19±0.10** |
| WDT | 0.45±0.04△△ | 1.58±0.25△△ | 0.33±0.02△ |
| MET | 0.41±0.06△ | 2.60±0.64 | 0.32±0.03△ |
Tab.3 Comparison of FXR, CYP7A1 and FGFR4 protein expressions in rat livers (Mean±SD, n=3)
| Group | FXR/GAPDH | CYP7A1/GAPDH | FGFR4/GAPDH |
|---|---|---|---|
| NC | 0.59±0.08 | 0.65±0.18 | 0.61±0.06 |
| MOD | 0.27±0.06** | 3.00±0.15** | 0.19±0.10** |
| WDT | 0.45±0.04△△ | 1.58±0.25△△ | 0.33±0.02△ |
| MET | 0.41±0.06△ | 2.60±0.64 | 0.32±0.03△ |
| Group | FXR/GAPDH | FGF15/GAPDH |
|---|---|---|
| NC | 0.42±0.08 | 0.57±0.11 |
| MOD | 0.18±0.01** | 0.13±0.03** |
| WDT | 0.28±0.03△ | 0.38±0.09△△ |
| MET | 0.35±0.02△△ | 0.33±0.08△ |
Tab.4 Comparison of FXR and FGF15 protein expressions in rat ileum (Mean±SD, n=3)
| Group | FXR/GAPDH | FGF15/GAPDH |
|---|---|---|
| NC | 0.42±0.08 | 0.57±0.11 |
| MOD | 0.18±0.01** | 0.13±0.03** |
| WDT | 0.28±0.03△ | 0.38±0.09△△ |
| MET | 0.35±0.02△△ | 0.33±0.08△ |
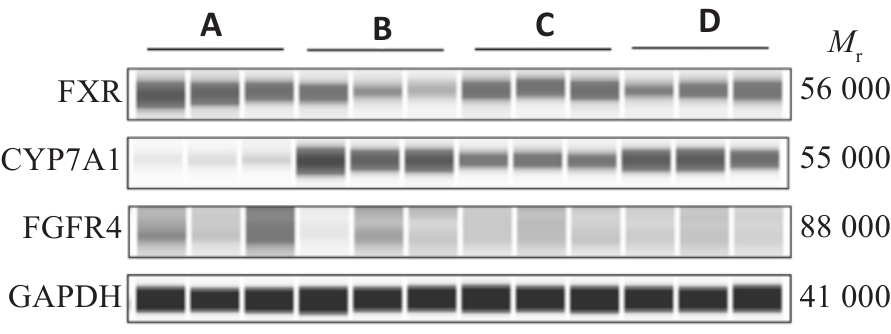
Fig.2 FXR, CYP7A1 and FGFR4 protein expression electrophoresis in rat liver tissue.A: Normal group.B:Model group.C:Wendan Decoction group. D: Metformin group.
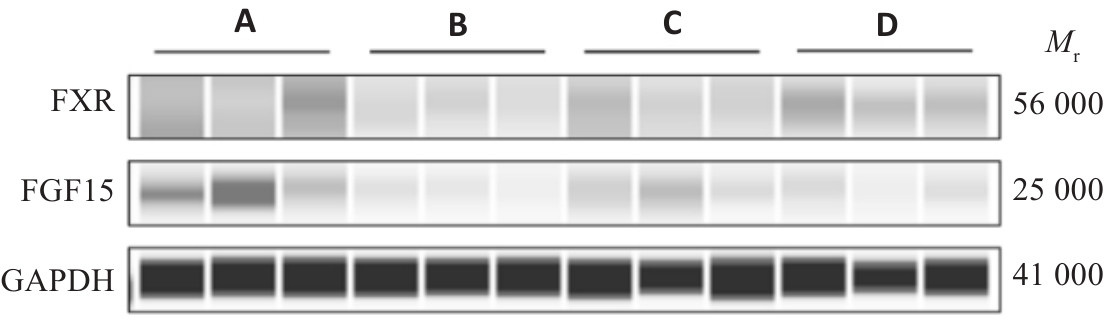
Fig.3 FXR, FGF15 protein expression electrophoresis in rat ileum.A: Normal group.B:Model group.C:Wendan Decoction group.D:Metformin group.
| Group | Chao1 | Observed species | Shannon | Simpson |
|---|---|---|---|---|
| NC | 1181.78±158.13 | 1173.88±155.67 | 7.67(6.96, 8.50) | 0.98(0.93, 0.99) |
| MOD | 784.50±93.77** | 781.38±93.18** | 6.60(6.36, 7.40)* | 0.97(0.95, 0.98) |
| WDT | 643.27±159.29 | 640.13±156.90 | 6.49(5.96, 7.00) | 0.96(0.94, 0.97) |
| MET | 695.19±153.57 | 689.50±152.21 | 6.85(6.41, 7.25) | 0.97(0.96, 0.98) |
Tab.5 Comparison on α diversity of intestinal flora among the 4 groups (n=8)
| Group | Chao1 | Observed species | Shannon | Simpson |
|---|---|---|---|---|
| NC | 1181.78±158.13 | 1173.88±155.67 | 7.67(6.96, 8.50) | 0.98(0.93, 0.99) |
| MOD | 784.50±93.77** | 781.38±93.18** | 6.60(6.36, 7.40)* | 0.97(0.95, 0.98) |
| WDT | 643.27±159.29 | 640.13±156.90 | 6.49(5.96, 7.00) | 0.96(0.94, 0.97) |
| MET | 695.19±153.57 | 689.50±152.21 | 6.85(6.41, 7.25) | 0.97(0.96, 0.98) |
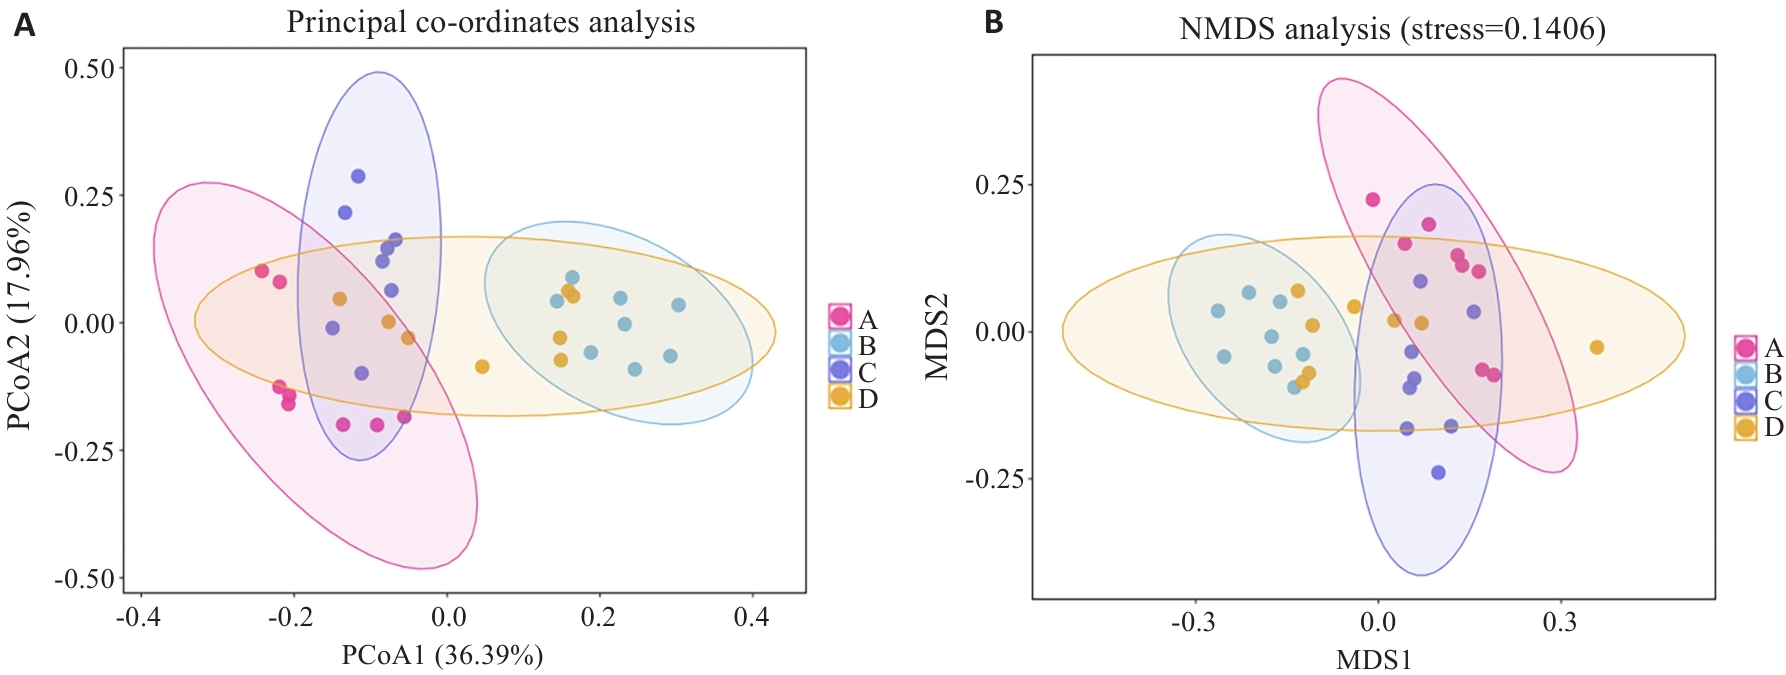
Fig.4 Analysis of β diversity in the 4 groups. A:PCoA analysis diagram. B:NMDS analysis diagram. A: Normal group. B: Model group. C: Wendan Decoction group. D: Metformin group.
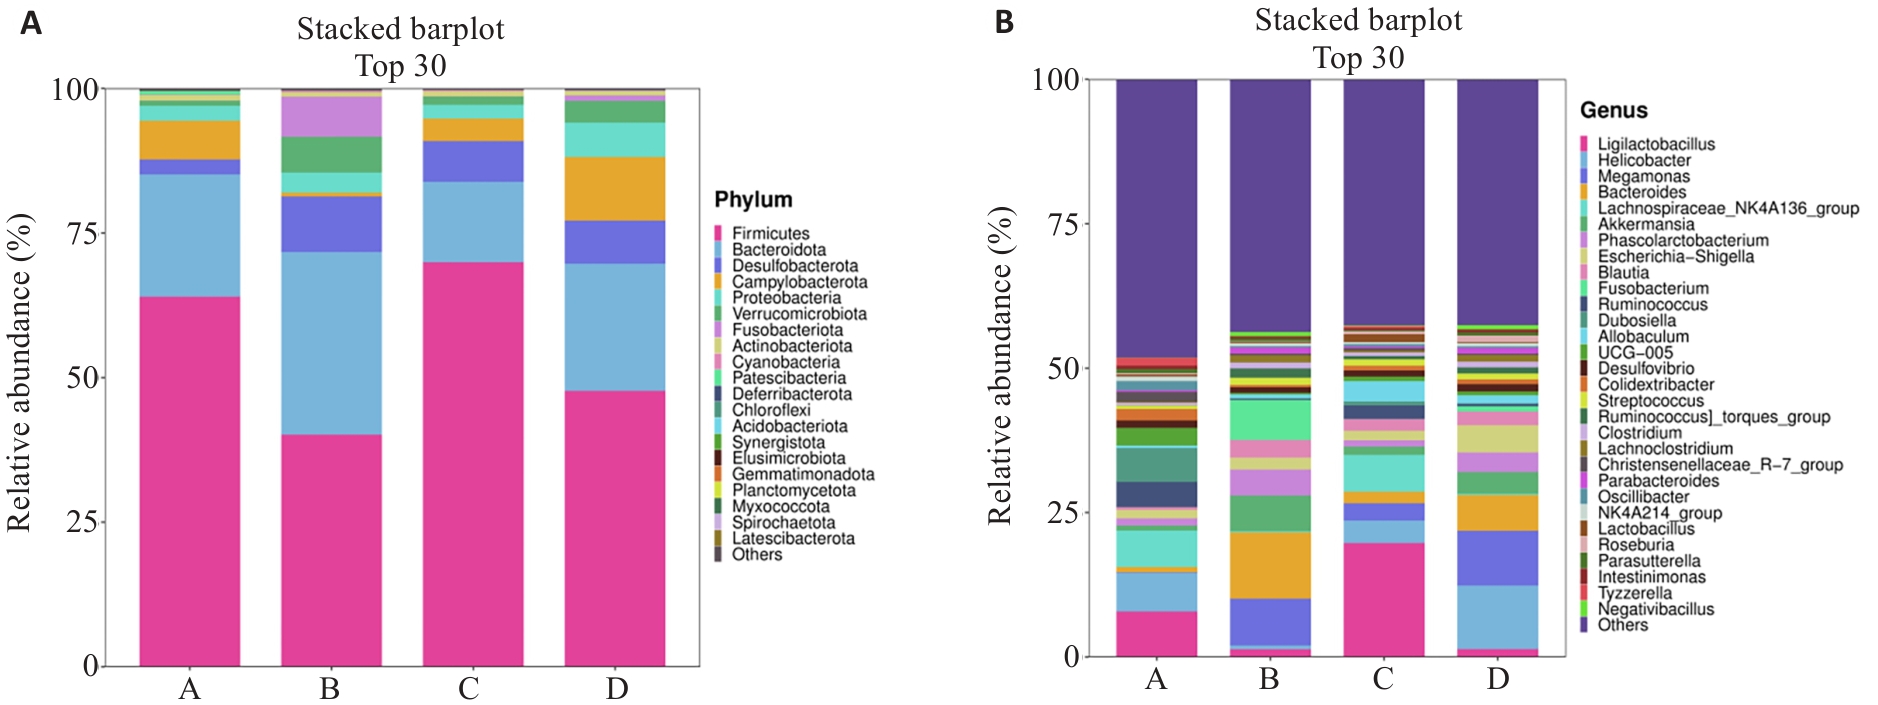
Fig.5 Histogram of phylum (A) and genus level (B) species in each group.
| Group | Firmicutes | Bacteroidota |
|---|---|---|
| NC | 64.13±10.29 | 21.13±8.24 |
| MOD | 40.27±9.55** | 31.57±8.91* |
| WDT | 70.08±10.79△△ | 13.91±4.61△△ |
| MET | 47.85±12.64 | 21.98±10.34△ |
Tab.6 Differential species analysis at the phylum level (Mean±SD, n=8)
| Group | Firmicutes | Bacteroidota |
|---|---|---|
| NC | 64.13±10.29 | 21.13±8.24 |
| MOD | 40.27±9.55** | 31.57±8.91* |
| WDT | 70.08±10.79△△ | 13.91±4.61△△ |
| MET | 47.85±12.64 | 21.98±10.34△ |
| Group | Lachnospiraceae_NK4A136_group | Megamonas | Bacteroides |
|---|---|---|---|
| NC | 5.99 (2.87, 8.66) | 0.07 (0.06, 0.15) | 0.92±0.49 |
| MOD | 0.19 (0.16, 0.20)** | 4.25 (2.24, 12.89)** | 11.47±4.97** |
| WDT | 2.56 (0.47, 7.63)△ | 2.45 (0.50, 5.30) | 2.01±1.20△△ |
| MET | 0.17 (0.09, 0.33) | 6.41 (3.04, 14.32) | 6.19±3.03 |
Tab.7 Analysis of intestinal microbiota species at the genus level [M (P25, P75), n=8]
| Group | Lachnospiraceae_NK4A136_group | Megamonas | Bacteroides |
|---|---|---|---|
| NC | 5.99 (2.87, 8.66) | 0.07 (0.06, 0.15) | 0.92±0.49 |
| MOD | 0.19 (0.16, 0.20)** | 4.25 (2.24, 12.89)** | 11.47±4.97** |
| WDT | 2.56 (0.47, 7.63)△ | 2.45 (0.50, 5.30) | 2.01±1.20△△ |
| MET | 0.17 (0.09, 0.33) | 6.41 (3.04, 14.32) | 6.19±3.03 |
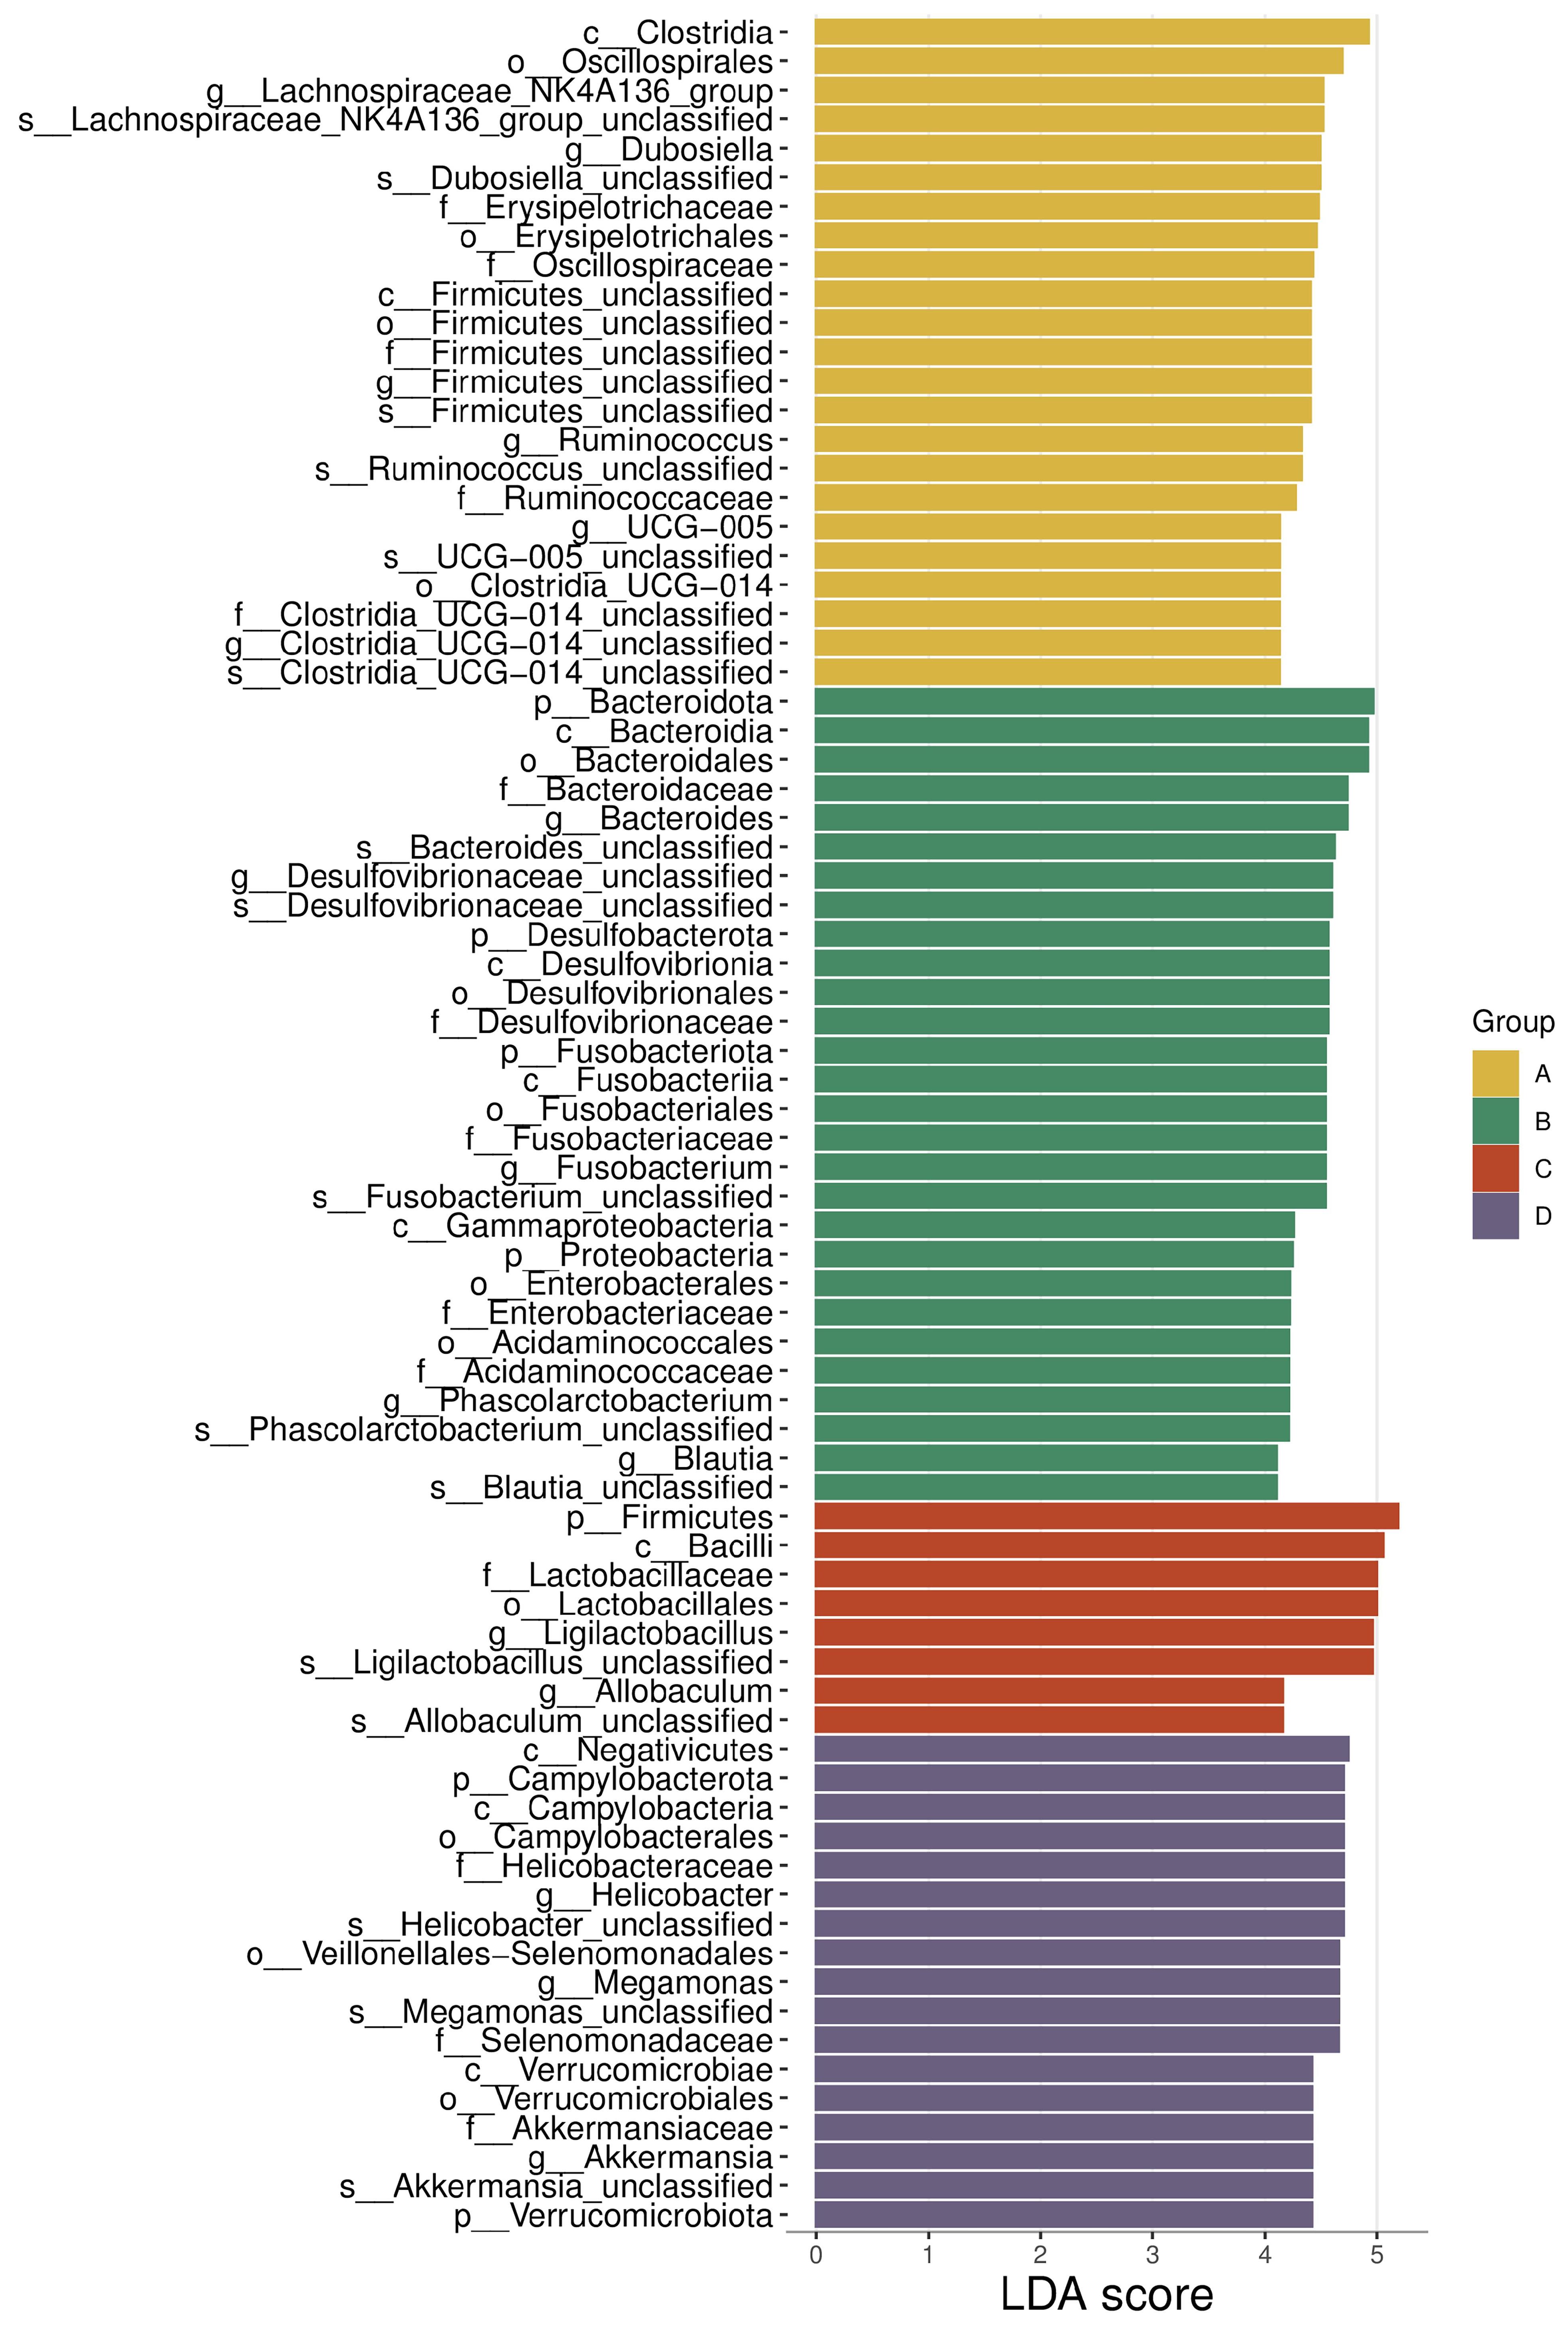
Fig.6 Histogram of LEfSe difference analysis in intestinal flora in each group. A: Normal group. B: Model group. C: Wendan Decoction group. D: Metformin group.
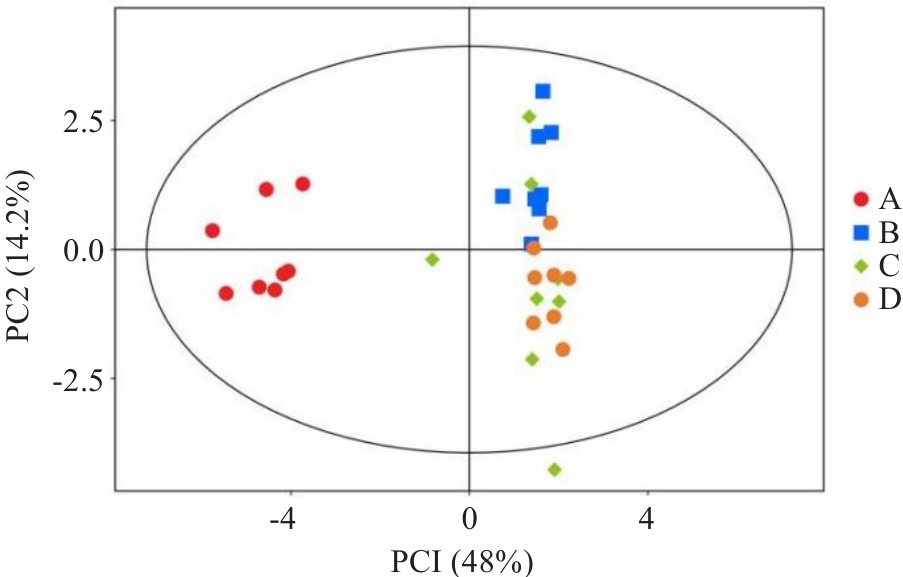
Fig.7 PCA analysis diagram. A: Normal group. B: Model group. C: Wendan Decoction group. D: Metformin group.
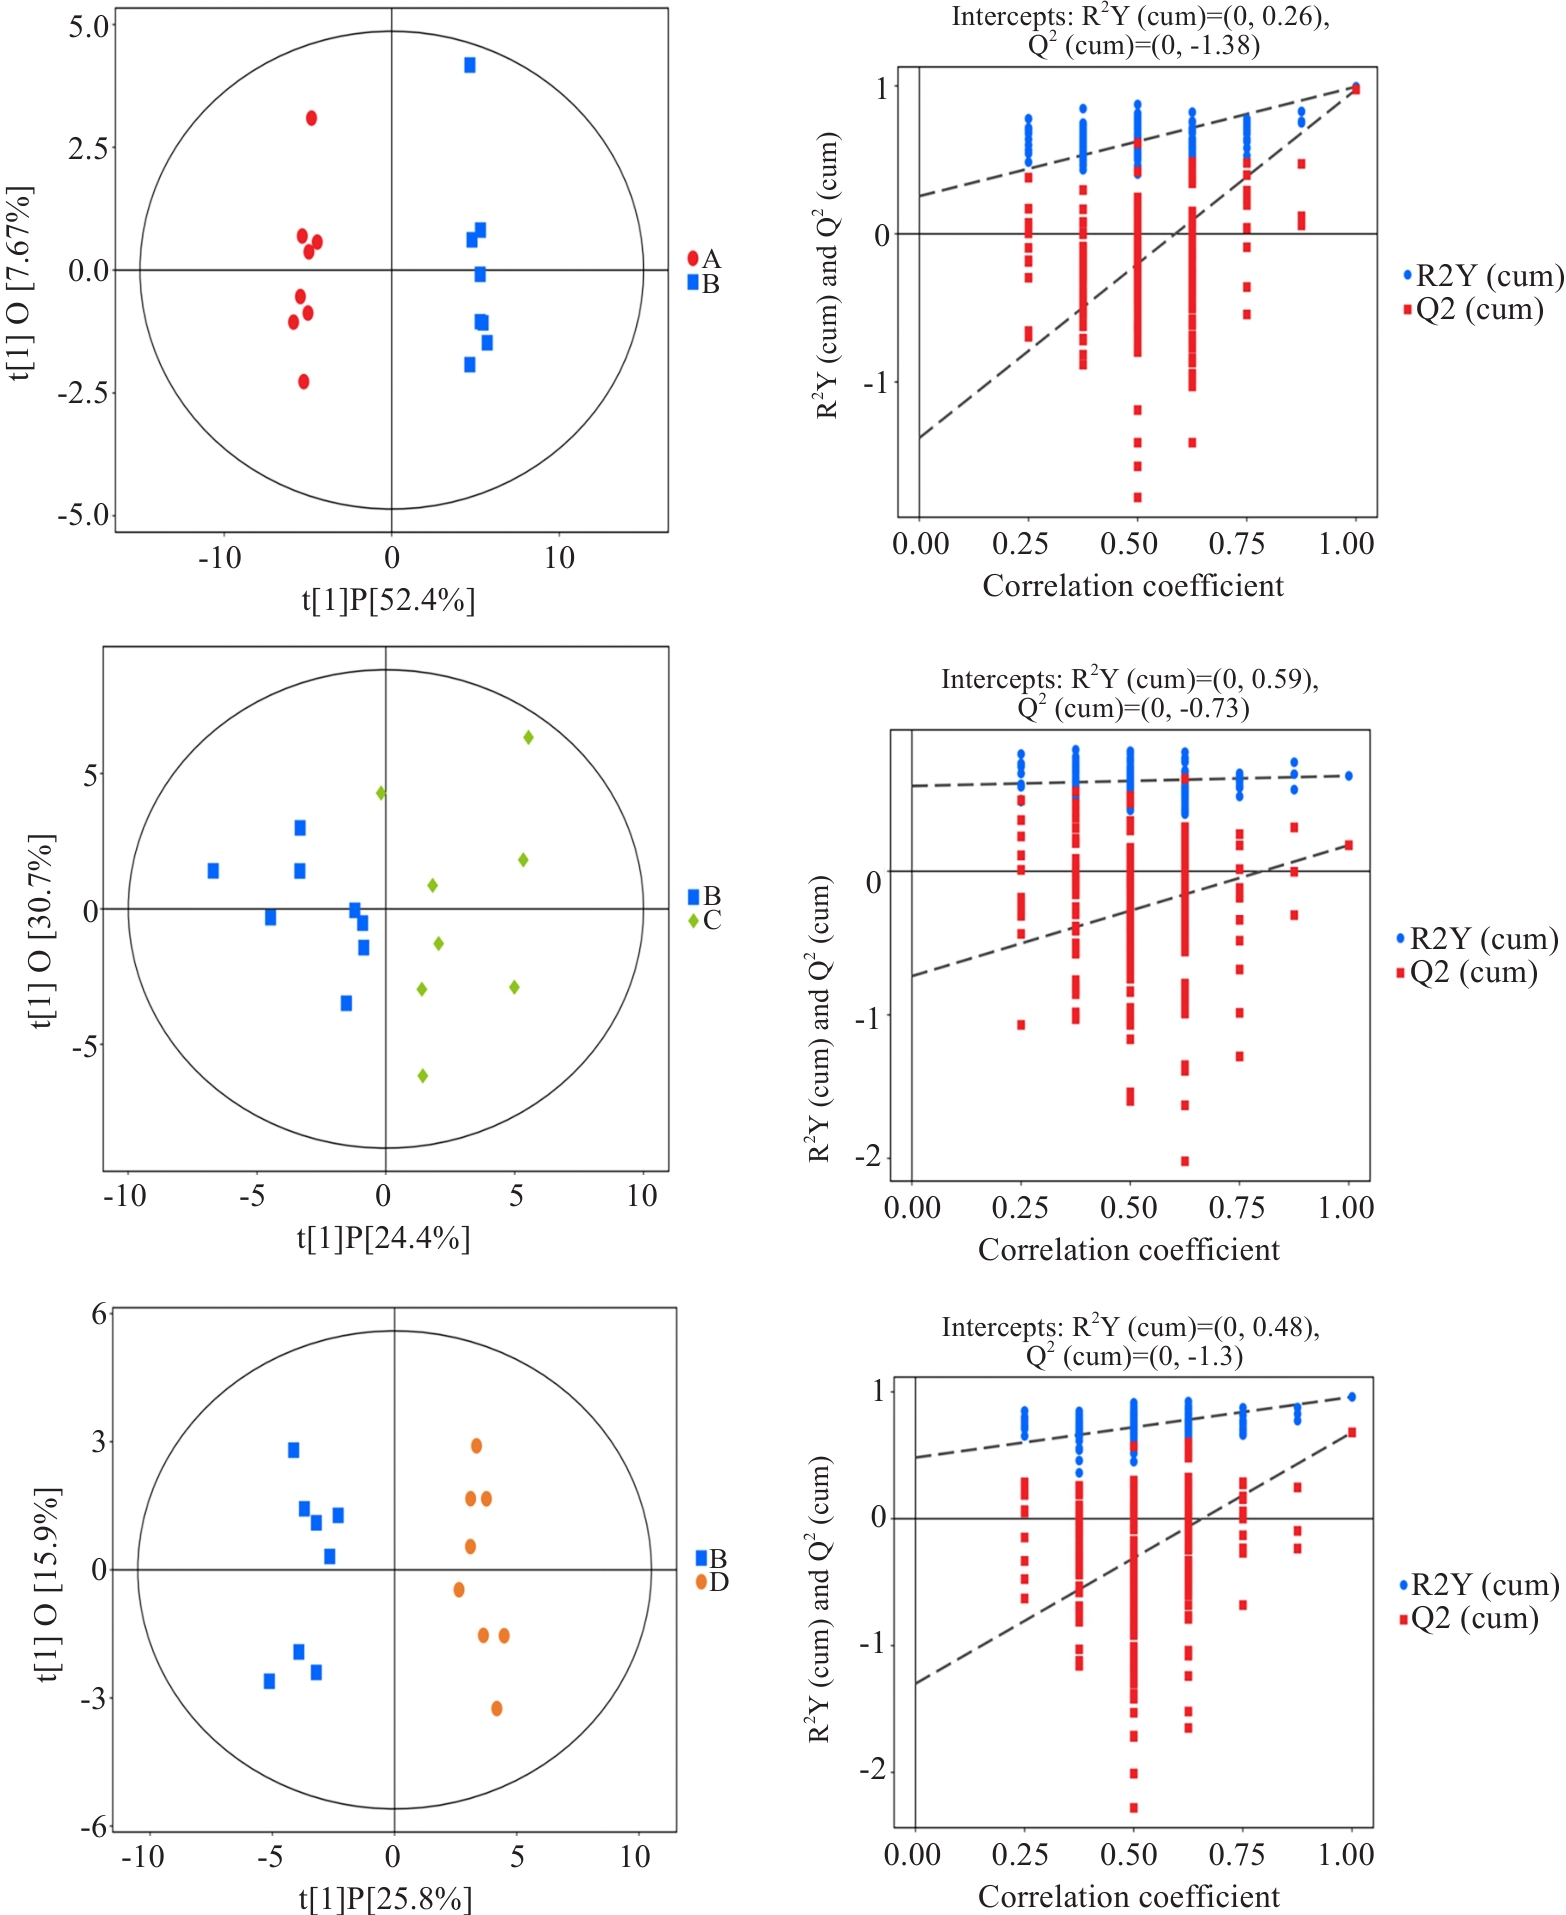
Fig.8 Distribution of OPLS-DA and 200 displacement tests in each group. A: Normal group. B: Model group. C: Wendan Decoction group. D: Metformin group.
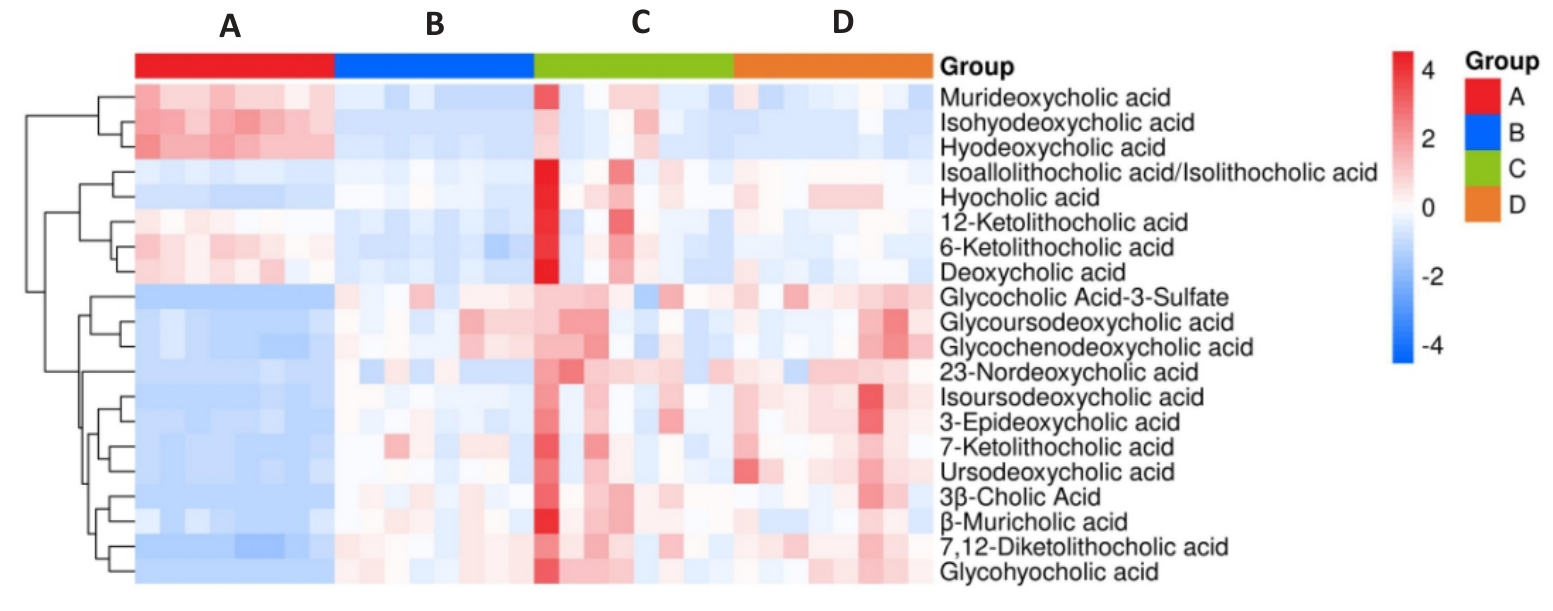
Fig.9 Differential bile acid heat maps among the 4 groups. A: Normal group. B: Model group. C: Wendan Decoction group. D: Metformin group.
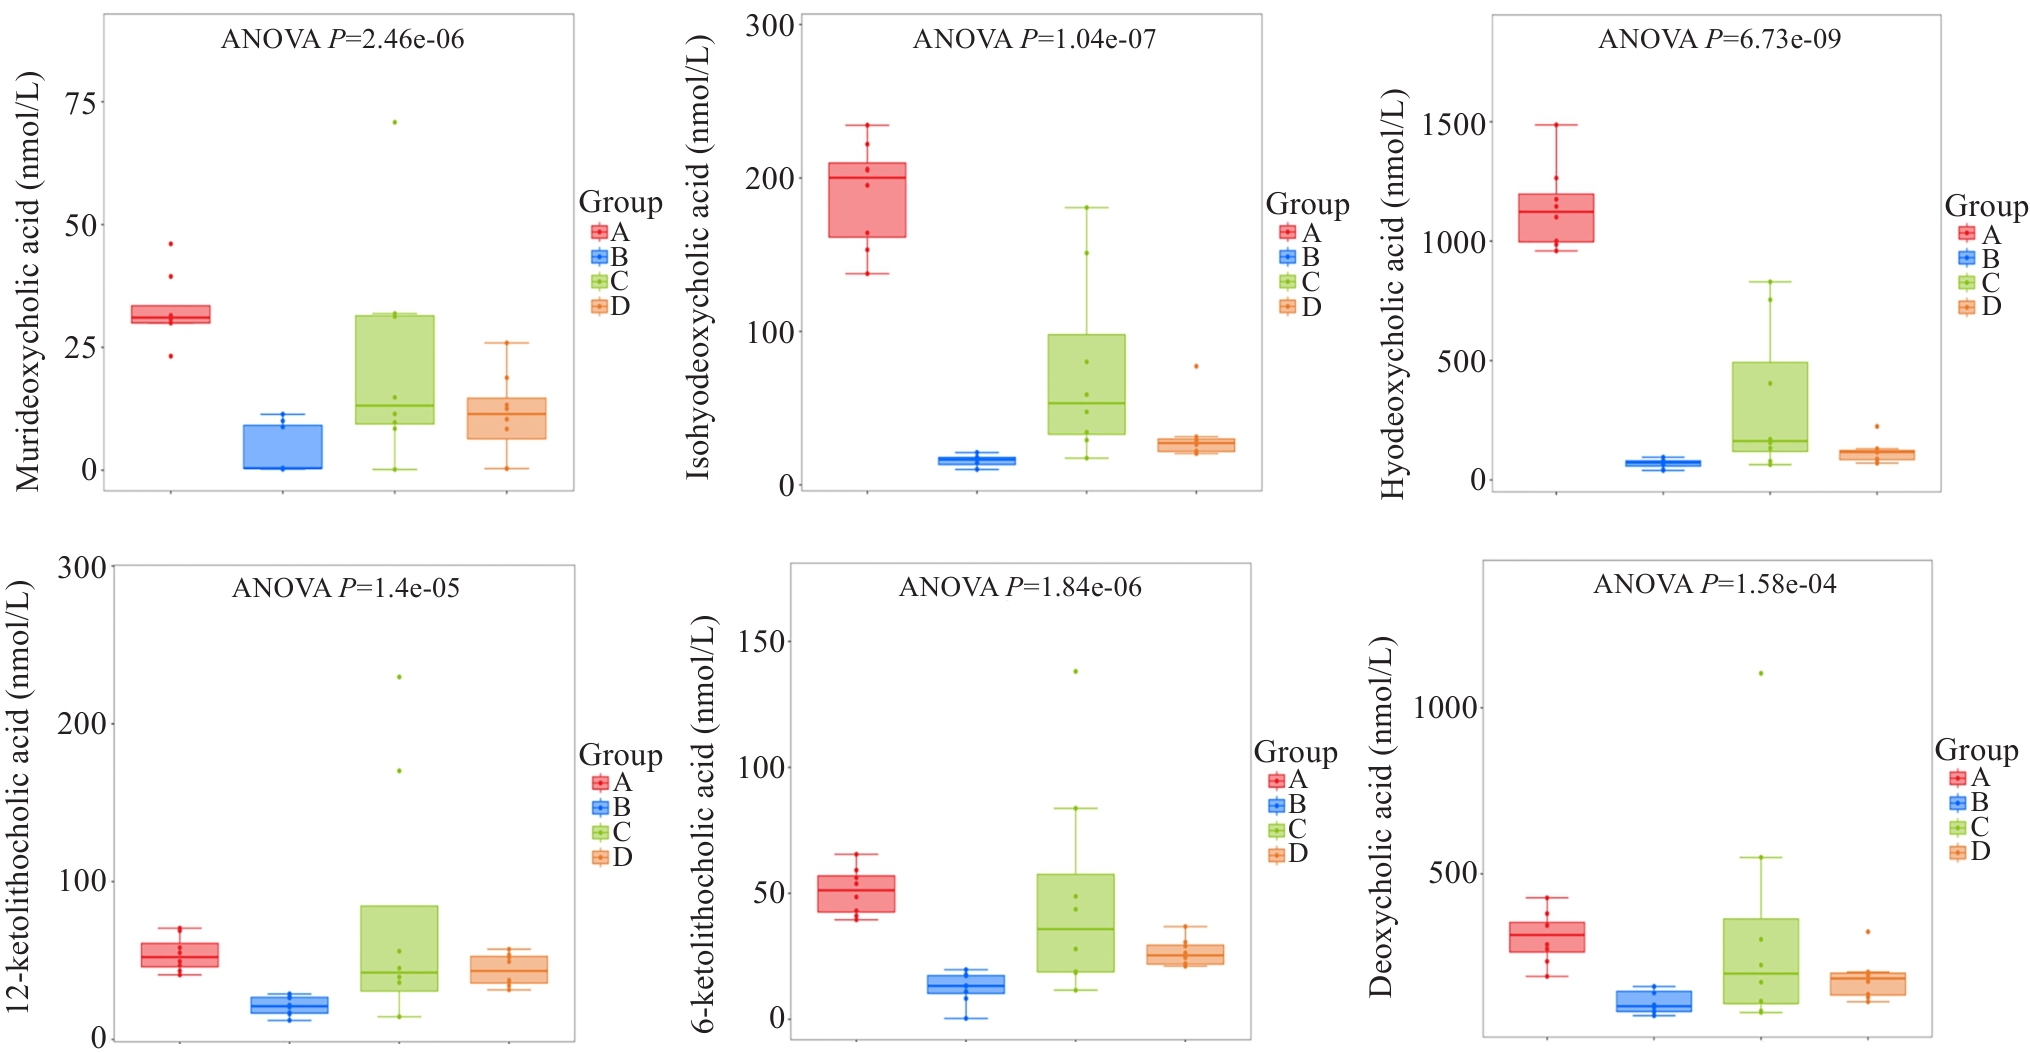
Fig.10 Differential bile acid tank diagram. A: Normal group. B: Model group. C: Wendan Decoction group. D: Metformin group.
| Flora | Isohyodeoxycholic acid | Hyodeoxycholic acid | ||
|---|---|---|---|---|
| r | P | r | P | |
| Firmicutes | 0.638 | <0.001 | 0.526 | 0.002 |
| Bacteroidota | -0.478 | 0.006 | -0.380 | 0.032 |
| Lachnospiraceae_NK4A136_group | 0.653 | <0.001 | 0.663 | <0.001 |
| Megamonas | -0.663 | <0.001 | -0.667 | <0.001 |
| Bacteroides | -0.839 | <0.001 | -0.751 | <0.001 |
Tab.8 Correlation analysis of intestinal flora and bile acid
| Flora | Isohyodeoxycholic acid | Hyodeoxycholic acid | ||
|---|---|---|---|---|
| r | P | r | P | |
| Firmicutes | 0.638 | <0.001 | 0.526 | 0.002 |
| Bacteroidota | -0.478 | 0.006 | -0.380 | 0.032 |
| Lachnospiraceae_NK4A136_group | 0.653 | <0.001 | 0.663 | <0.001 |
| Megamonas | -0.663 | <0.001 | -0.667 | <0.001 |
| Bacteroides | -0.839 | <0.001 | -0.751 | <0.001 |
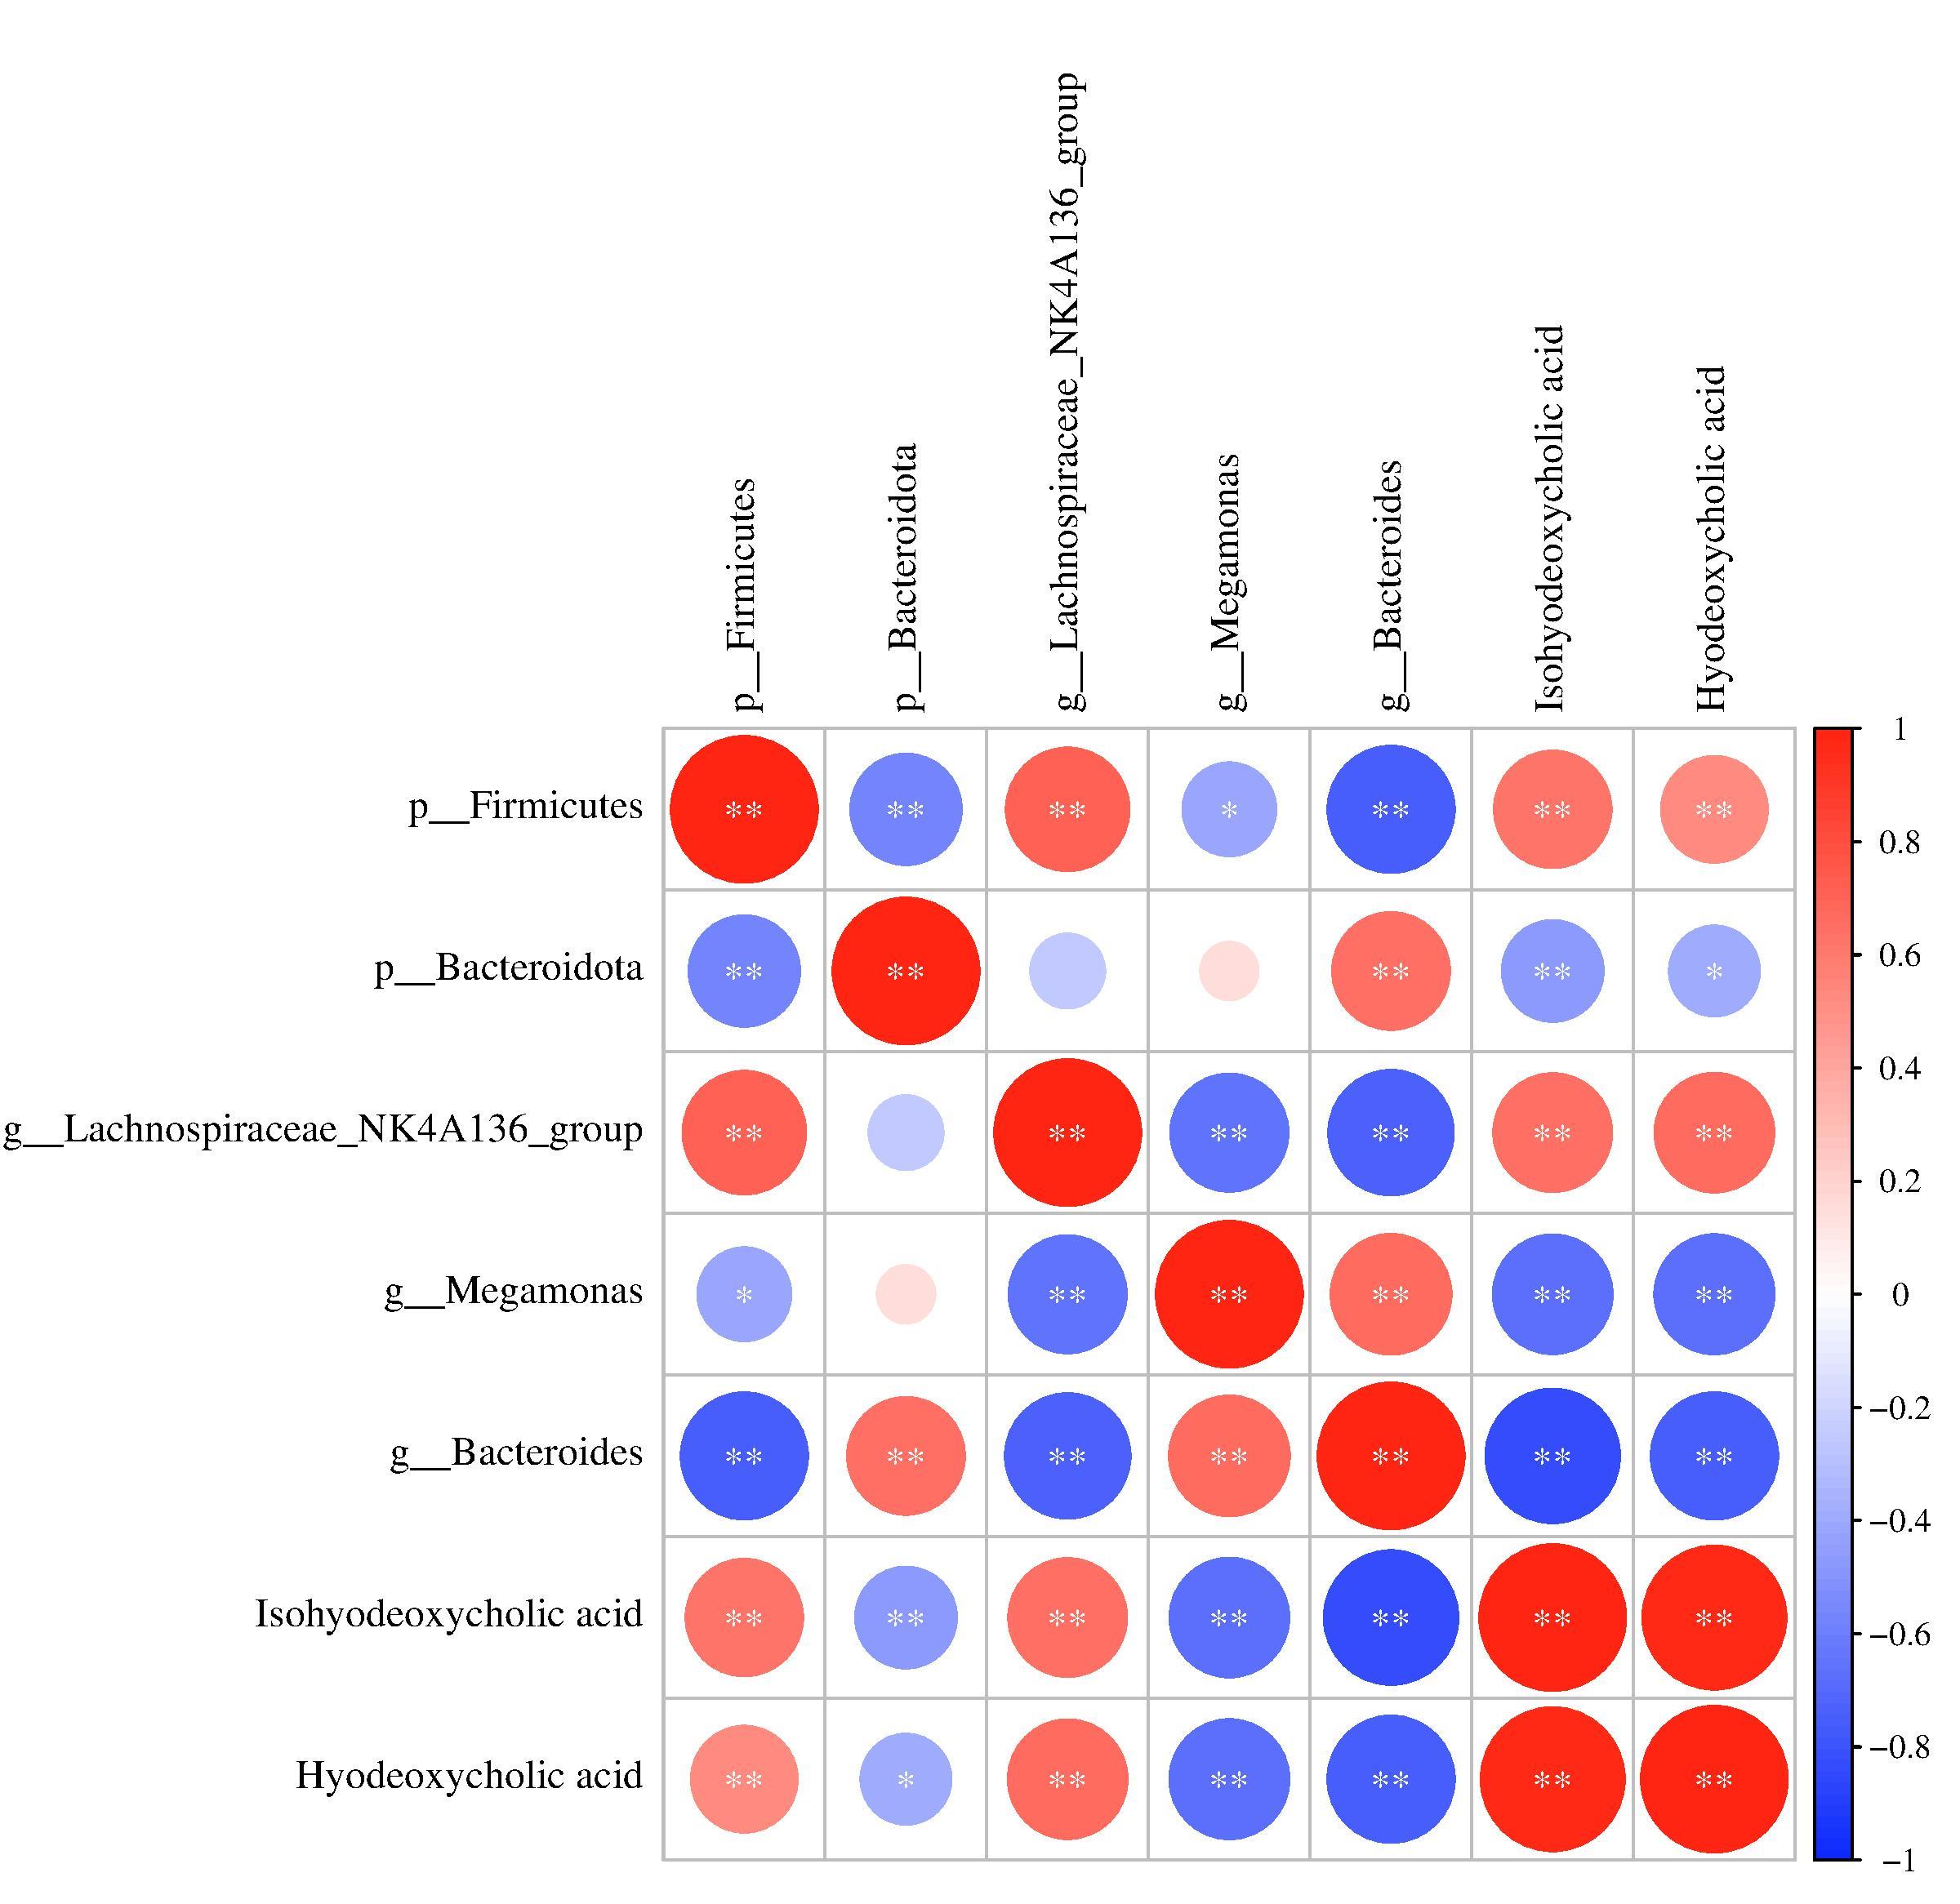
Fig.11 Correlation analysis between intestinal flora and bile acids. *P<0.05, **P<0.01.
| 1 | Cornier MA, Dabelea D, Hernandez TL, et al. The metabolic syndrome[J]. Endocr Rev, 2008, 29(7): 777-822. doi:10.1210/er.2008-0024 |
| 2 | Belladelli F, Montorsi F, Martini A. Metabolic syndrome, obesity and cancer risk[J]. Curr Opin Urol, 2022, 32(6): 594-7. doi:10.1097/mou.0000000000001041 |
| 3 | Gesteiro E, Megía A, Guadalupe-Grau A, et al. Early identification of metabolic syndrome risk: a review of reviews and proposal for defining pre-metabolic syndrome status[J]. Nutr Metab Cardiovasc Dis, 2021, 31(9): 2557-74. doi:10.1016/j.numecd.2021.05.022 |
| 4 | Ussar S, Griffin NW, Bezy O, et al. Interactions between gut microbiota, host genetics and diet modulate the predisposition to obesity and metabolic syndrome[J]. Cell Metab, 2015, 22(3): 516-30. doi:10.1016/j.cmet.2015.07.007 |
| 5 | Li T, Chiang JY. Bile acid signaling in metabolic disease and drug therapy[J]. Pharmacol Rev, 2014, 66(4): 948-83. doi:10.1124/pr.113.008201 |
| 6 | 庄耀东, 高碧珍, 王永发, 等. 代谢综合征“痰证” 的病位、病性兼杂特征及与胰岛素抵抗、生化指标的相关性研究[J]. 中华中医药杂志, 2017, 32(2): 546-8. |
| 7 | 庄耀东, 王永发, 陈晓红, 等. 代谢综合征痰证与胰岛素抵抗指数、血脂及BMI的相关性研究[J]. 中医药临床杂志, 2016, 28(11): 1600-2. doi:10.16448/j.cjtcm.2016.0563 |
| 8 | 熊红萍,李灿东,高碧珍,等. 代谢综合征的中医痰证病理与血糖、血胰岛素及胰岛素抵抗的相关性研究[J]. 中华中医药杂志, 2010, 25(5): 763-5. |
| 9 | 代谢综合征病证结合诊疗指南[J]. 世界中医药, 2023, 18(22): 3157-66. |
| 10 | 陈珍真, 康 洁, 郭屿洵, 等. 温胆汤干预大鼠代谢综合征的研究[J]. 中华中医药杂志, 2018, 33(4): 1373-6. |
| 11 | Wanrooy BJ, Kumar KP, Wen SW, et al. Distinct contributions of hyperglycemia and high-fat feeding in metabolic syndrome-induced neuroinflammation[J]. J Neuroinflammation, 2018, 15(1): 293. doi:10.1186/s12974-018-1329-8 |
| 12 | 曹 彬. 二陈汤合桃红四物汤干预痰瘀互结证代谢综合征大鼠血清代谢组学研究[D]. 沈阳: 辽宁中医药大学, 2017. |
| 13 | 陈珍真,甘慧娟,康 洁,等. 大鼠代谢综合征痰证造模方法探究[J]. 辽宁中医药大学学报, 2017, 19(11): 75-8. |
| 14 | 魏 佳, 曾华霖, 林书颖, 等. 代谢综合征痰证大鼠模型建立与评价的实验研究[J]. 辽宁中医杂志, 2022, 49(6): 195-9. doi:10.13192/j.issn.1000-1719.2022.06.054 |
| 15 | 魏伟, 吴希美, 李元建. 药理实验方法学[M]. 4版. 北京: 人民卫生出版社, 2010: 69-73. |
| 16 | Li WB, Fu XY, Lin D, et al. Conjugated linoleic acid alleviates glycolipid metabolic disorders by modulating intestinal microbiota and short-chain fatty acids in obese rats[J]. Food Funct, 2023, 14(3): 1685-98. doi:10.1039/d2fo03760b |
| 17 | Ahmed H, Leyrolle Q, Koistinen V, et al. Microbiota-derived metabolites as drivers of gut-brain communication[J]. Gut Microbes, 2022, 14(1): 2102878. doi:10.1080/19490976.2022.2102878 |
| 18 | 王 丽,张之豪,李燕春. 代谢综合征与肠道菌群关系及有氧运动干预效果机制[J]. 中国生物化学与分子生物学报, 2024, 40(11):1504-12. doi:10.13865/j.cnki.cjbmb.2024.08.1148 |
| 19 | Cani PD, Amar J, Iglesias MA, et al. Metabolic endotoxemia initiates obesity and insulin resistance[J]. Diabetes, 2007, 56(7): 1761-72. doi:10.2337/db06-1491 |
| 20 | 王家豪,花海兵,薛 昊,等. 古代经典名方温胆汤的研究进展及质量标志物的预测分析[J]. 世界科学技术-中医药现代化, 2024, 26(06): 1528-36. doi:10.11842/wst.20230302003 |
| 21 | Quiroga R, Nistal E, Estébanez B, et al. Exercise training modulates the gut microbiota profile and impairs inflammatory signaling pathways in obese children[J]. Exp Mol Med, 2020, 52(7): 1048-61. doi:10.1038/s12276-020-0459-0 |
| 22 | White BA, Lamed R, Bayer EA, et al. Biomass utilization by gut microbiomes[J]. Annu Rev Microbiol, 2014, 68: 279-96. doi:10.1146/annurev-micro-092412-155618 |
| 23 | Shin JH, Tillotson G, MacKenzie TN, et al. Bacteroides and related species: The keystone taxa of the human gut microbiota[J]. Anaerobe, 2024, 85: 102819. doi:10.1016/j.anaerobe.2024.102819 |
| 24 | Ma L, Ni Y, Wang Z, et al. Spermidine improves gut barrier integrity and gut microbiota function in diet-induced obese mice[J]. Gut Microbes, 2020, 12(1): 1-19. doi:10.1080/19490976.2020.1832857 |
| 25 | Wu C, Yang FM, Zhong HZ, et al. Obesity-enriched gut microbe degrades myo-inositol and promotes lipid absorption[J]. Cell Host Microbe, 2024, 32(8): 1301-14. e9. doi:10.1016/j.chom.2024.06.012 |
| 26 | Mandal RK, Mandal A, Denny JE, et al. Gut Bacteroides act in a microbial consortium to cause susceptibility to severe malaria[J]. Nat Commun, 2023, 14(1): 6465. doi:10.1038/s41467-023-42235-0 |
| 27 | Owen BM, Mangelsdorf DJ, Kliewer SA. Tissue-specific actions of the metabolic hormones FGF15/19 and FGF21[J]. Trends Endocrinol Metab, 2015, 26(1): 22-9. doi:10.1016/j.tem.2014.10.002 |
| 28 | Zhou X, Cao L, Jiang C, et al. PPARα-UGT axis activation represses intestinal FXR-FGF15 feedback signalling and exacerbates experimental colitis[J]. Nat Commun, 2014, 5: 4573. doi:10.1038/ncomms5573 |
| 29 | Zheng XJ, Chen TL, Jiang RQ, et al. Hyocholic acid species improve glucose homeostasis through a distinct TGR5 and FXR signaling mechanism[J]. Cell Metab, 2021, 33(4): 791-803.e7. doi:10.1016/j.cmet.2020.11.017 |
| 30 | Watanabe M, Fukiya S, Yokota A. Comprehensive evaluation of the bactericidal activities of free bile acids in the large intestine of humans and rodents[J]. J Lipid Res, 2017, 58(6): 1143-52. doi:10.1194/jlr.m075143 |
| 31 | 何 萍, 林以宁. 肠道菌群和胆汁酸在非酒精性脂肪肝性病中的交互作用[J]. 药学研究, 2021, 40(5): 316-8, 338. doi:10.13506/j.cnki.jpr.2021.05.007 |
| 32 | Wahlström A, Sayin SI, Marschall HU, et al. Intestinal crosstalk between bile acids and microbiota and its impact on host metabolism[J]. Cell Metab, 2016, 24(1): 41-50. doi:10.1016/j.cmet.2016.05.005 |
| Viewed | ||||||
|
Full text |
|
|||||
|
Abstract |
|
|||||