南方医科大学学报 ›› 2025, Vol. 45 ›› Issue (4): 711-717.doi: 10.12122/j.issn.1673-4254.2025.04.05
陈梅妹1,2( ), 王洋1,2, 雷黄伟1,2, 张斐1,2, 黄睿娜1,2, 杨朝阳1,2()
收稿日期:2024-12-10
出版日期:2025-04-20
发布日期:2025-04-28
通讯作者:
杨朝阳
E-mail:chenmeimei1984@163.com;yzy813@126.com
作者简介:陈梅妹,博士,副研究员,硕士生导师,E-mail: chenmeimei1984@163.com
基金资助:
Meimei CHEN1,2(), Yang WANG1,2, Huangwei LEI1,2, Fei ZHANG1,2, Ruina HUANG1,2, Zhaoyang YANG1,2()
Received:2024-12-10
Online:2025-04-20
Published:2025-04-28
Contact:
Zhaoyang YANG
E-mail:chenmeimei1984@163.com;yzy813@126.com
摘要:
目的 分析阈下抑郁组和正常组的语音情绪特征,并通过6种机器学习算法构建语音识别分类模型,为阈下抑郁辨识提供客观化依据,以提高早期诊断率。 方法 采集正常组和阈下抑郁组的朗读单词和文本的不同语音数据,每个语音段提取384维语音情绪特征变量,包括能量特征、梅尔频率倒谱系数、零交叉率特征、声音概率特征、基频特征、差分特征等多个维度。采用递归特征消除方法筛选语音特征变量,然后利用自适应增强算法(AdaBoost)、随机森林(RF)、线性判别分析(LDA)、逻辑回归、Lasso回归和支持向量机机器学习算法构建分类模型,并评估模型的性能。为评估模型泛化能力,采用真实世界的语音数据,对最佳阈下抑郁语音识别分类模型进行测试。 结果 AdaBoost、RF和LDA模型在单词朗读语音测试集上预测准确率为100%、100%和93.3%,展现出高准确率和稳定性;在单词文本语音测试集上,AdaBoost、RF和LDA模型的预测准确率为90%、80%和90%,其余3个算法模型的准确率均小于80%。阈下抑郁语音AdaBoost和RF分类模型对真实世界的朗读单词和文本语音数据的预测准确率仍然可以达到了91.7%和80.6%,86.1%和77.8%。 结论 通过分析语音情绪特征可以有效地识别阈下抑郁个体,AdaBoost和RF模型在阈下抑郁个体分类方面表现出色,是识别阈下抑郁的有力工具,可以为临床应用和研究提供参考。
陈梅妹, 王洋, 雷黄伟, 张斐, 黄睿娜, 杨朝阳. 基于多种机器学习算法和语音情绪特征的阈下抑郁辨识模型构建[J]. 南方医科大学学报, 2025, 45(4): 711-717.
Meimei CHEN, Yang WANG, Huangwei LEI, Fei ZHANG, Ruina HUANG, Zhaoyang YANG. Construction of recognition models for subthreshold depression based on multiple machine learning algorithms and vocal emotional characteristics[J]. Journal of Southern Medical University, 2025, 45(4): 711-717.
| Group | Case | Age (year) | CES-D (min) | HAM-D (min) |
|---|---|---|---|---|
| Health | 60 | 18-30 | 0-14 | 0-6 |
| Subthreshold depression | 50 | 18-30 | 16-19 | 7-17 |
表1 被试者信息
Tab.1 General information of the participants
| Group | Case | Age (year) | CES-D (min) | HAM-D (min) |
|---|---|---|---|---|
| Health | 60 | 18-30 | 0-14 | 0-6 |
| Subthreshold depression | 50 | 18-30 | 16-19 | 7-17 |
| Speech feature variable | Definition | Speech feature type | Variable selection order |
|---|---|---|---|
| pcm_RMSenergy_sma_amean | Mean of root mean square energy | Energy feature | 1 |
| pcm_RMSenergy_sma_linregc2 | Linear regression coefficient of Root Mean Square Energy, describing the long-term trend of energy | Energy feature | 2 |
| pcm_RMSenergy_sma_stddev | Standard deviation of Root Mean Square Energy, reflecting the degree of energy variation | Energy feature | 3 |
| pcm_zcr_sma_linregc1 | Linear regression coefficient of zero-crossing rate, reflecting the rate of change in the speech signal | Zero cross rate feature | 4 |
| pcm_zcr_sma_linregerrQ | Error of zero-crossing rate linear regression, reflecting the stability of signal changes | Zero cross rate feature | 5 |
| voiceProb_sma_linregc1 | Linear regression coefficient of speech probability, especially regarding changes in syllables and stress | Sound source feature | 6 |
| pcm_fftMag_mfcc_sma_de[ | Mean of the first dimension Mel-Frequency Cepstral Coefficients (MFCC), providing an overall description of the signal's spectral characteristics. | Spectral feature | 7 |
| pcm_fftMag_mfcc_sma_de[ | Linear regression coefficient 2 of the first dimension MFCC, reflecting the trend of spectral feature changes. | Spectral feature | 8 |
| pcm_zcr_sma_de_skewness | Skewness of zero-crossing rate, reflecting the transient characteristics of the signal. | Zero cross rate feature | 9 |
| pcm_zcr_sma_de_kurtosis | Kurtosis of zero-crossing rate, providing information about the sharpness of the signal. | Zero cross rate feature | 10 |
表2 RFE法筛选的单词朗读的阈下抑郁语音特征变量
Tab.2 Speech feature variables of subthreshold depression in word-reading selected by RFE method
| Speech feature variable | Definition | Speech feature type | Variable selection order |
|---|---|---|---|
| pcm_RMSenergy_sma_amean | Mean of root mean square energy | Energy feature | 1 |
| pcm_RMSenergy_sma_linregc2 | Linear regression coefficient of Root Mean Square Energy, describing the long-term trend of energy | Energy feature | 2 |
| pcm_RMSenergy_sma_stddev | Standard deviation of Root Mean Square Energy, reflecting the degree of energy variation | Energy feature | 3 |
| pcm_zcr_sma_linregc1 | Linear regression coefficient of zero-crossing rate, reflecting the rate of change in the speech signal | Zero cross rate feature | 4 |
| pcm_zcr_sma_linregerrQ | Error of zero-crossing rate linear regression, reflecting the stability of signal changes | Zero cross rate feature | 5 |
| voiceProb_sma_linregc1 | Linear regression coefficient of speech probability, especially regarding changes in syllables and stress | Sound source feature | 6 |
| pcm_fftMag_mfcc_sma_de[ | Mean of the first dimension Mel-Frequency Cepstral Coefficients (MFCC), providing an overall description of the signal's spectral characteristics. | Spectral feature | 7 |
| pcm_fftMag_mfcc_sma_de[ | Linear regression coefficient 2 of the first dimension MFCC, reflecting the trend of spectral feature changes. | Spectral feature | 8 |
| pcm_zcr_sma_de_skewness | Skewness of zero-crossing rate, reflecting the transient characteristics of the signal. | Zero cross rate feature | 9 |
| pcm_zcr_sma_de_kurtosis | Kurtosis of zero-crossing rate, providing information about the sharpness of the signal. | Zero cross rate feature | 10 |
| Model algorithm | Training set | Test set | ||||||
|---|---|---|---|---|---|---|---|---|
| Accuracy | Sensitivity | Specificity | ROC AUC | Accuracy | Sensitivity | Specificity | ROC AUC | |
| AdaBoost | 100% | 100% | 100% | 100% | 100% | 100% | 100% | 100% |
| RF | 100% | 100% | 100% | 100% | 100% | 100% | 100% | 100% |
| LDA | 95.2% | 96.7% | 93.8% | 97.8% | 93.3% | 85.7% | 100% | 87.5% |
| LRLasso | 82.3% | 96.7% | 68.8% | 79.5% | 93.3% | 100% | 87.5% | 98.2% |
| SVM | 82.3% | 96.7% | 68.8% | 75.8% | 86.7% | 100% | 75% | 91.1% |
| LR | 82.3% | 96.7% | 68.8% | 75.7% | 86.7% | 100% | 75% | 85.7% |
表3 基于单词朗读语音的阈下抑郁分类模型性能指标
Tab.3 Performance metrics of subthreshold depression classification models based on word-reading speech data
| Model algorithm | Training set | Test set | ||||||
|---|---|---|---|---|---|---|---|---|
| Accuracy | Sensitivity | Specificity | ROC AUC | Accuracy | Sensitivity | Specificity | ROC AUC | |
| AdaBoost | 100% | 100% | 100% | 100% | 100% | 100% | 100% | 100% |
| RF | 100% | 100% | 100% | 100% | 100% | 100% | 100% | 100% |
| LDA | 95.2% | 96.7% | 93.8% | 97.8% | 93.3% | 85.7% | 100% | 87.5% |
| LRLasso | 82.3% | 96.7% | 68.8% | 79.5% | 93.3% | 100% | 87.5% | 98.2% |
| SVM | 82.3% | 96.7% | 68.8% | 75.8% | 86.7% | 100% | 75% | 91.1% |
| LR | 82.3% | 96.7% | 68.8% | 75.7% | 86.7% | 100% | 75% | 85.7% |
| Speech feature variable | Definition | Speech feature type | Variable selection order |
|---|---|---|---|
| pcm_fftMag_mfcc_sma_skewness | Skewness of the 7th dimension Mel-Frequency Cepstral Coefficient (MFCC), reflecting the asymmetry of the spectrum. | Spectral feature | 1 |
| pcm_fftMag_mfcc_sma_amean | Mean of the 8th dimension MFCC, providing an overall description of the signal's spectral features. | Spectral feature | 2 |
| pcm_zcr_sma_linregc1 | Linear regression coefficient of zero-crossing rate, reflecting the rate of change in the speech signal | Zero cross rate feature | 3 |
| pcm_zcr_sma_linregerrQ | Error of zero-crossing rate linear regression, reflecting the stability of signal changes | Zero cross rate feature | 4 |
pcm_fftMag_mfcc_sma_de _amean | Mean of the 3rd dimension MFCC, providing an overall description of the signal's spectral features. | Spectral feature | 5 |
pcm_fftMag_mfcc_sma_de _linregc1 | Linear regression coefficient of the 7th dimension MFCC, reflecting the trend of changes in spectral features. | Spectral feature | 6 |
pcm_fftMag_mfcc_sma_de _linregc2 | Another linear regression coefficient of the 7th dimension MFCC, further analyzing the spectral features. | Spectral feature | 7 |
pcm_fftMag_mfcc_sma_de _maxPos | Position of the maximum value of the 11th dimension MFCC, indicating the sharpness of the spectral features. | Spectral feature | 8 |
pcm_fftMag_mfcc_sma_de _linregc2 | Linear regression coefficient of the 11th dimension MFCC, reflecting the trend of changes in spectral features. | Spectral feature | 9 |
| pcm_zcr_sma_de_skewness | Skewness of zero-crossing rate, reflecting the transient characteristics of the signal. | Zero cross rate feature | 10 |
表4 RFE法筛选的短文朗读的阈下抑郁语音特征变量
Tab.4 Speech feature variables of subthreshold depression in short text reading selected by RFE method
| Speech feature variable | Definition | Speech feature type | Variable selection order |
|---|---|---|---|
| pcm_fftMag_mfcc_sma_skewness | Skewness of the 7th dimension Mel-Frequency Cepstral Coefficient (MFCC), reflecting the asymmetry of the spectrum. | Spectral feature | 1 |
| pcm_fftMag_mfcc_sma_amean | Mean of the 8th dimension MFCC, providing an overall description of the signal's spectral features. | Spectral feature | 2 |
| pcm_zcr_sma_linregc1 | Linear regression coefficient of zero-crossing rate, reflecting the rate of change in the speech signal | Zero cross rate feature | 3 |
| pcm_zcr_sma_linregerrQ | Error of zero-crossing rate linear regression, reflecting the stability of signal changes | Zero cross rate feature | 4 |
pcm_fftMag_mfcc_sma_de _amean | Mean of the 3rd dimension MFCC, providing an overall description of the signal's spectral features. | Spectral feature | 5 |
pcm_fftMag_mfcc_sma_de _linregc1 | Linear regression coefficient of the 7th dimension MFCC, reflecting the trend of changes in spectral features. | Spectral feature | 6 |
pcm_fftMag_mfcc_sma_de _linregc2 | Another linear regression coefficient of the 7th dimension MFCC, further analyzing the spectral features. | Spectral feature | 7 |
pcm_fftMag_mfcc_sma_de _maxPos | Position of the maximum value of the 11th dimension MFCC, indicating the sharpness of the spectral features. | Spectral feature | 8 |
pcm_fftMag_mfcc_sma_de _linregc2 | Linear regression coefficient of the 11th dimension MFCC, reflecting the trend of changes in spectral features. | Spectral feature | 9 |
| pcm_zcr_sma_de_skewness | Skewness of zero-crossing rate, reflecting the transient characteristics of the signal. | Zero cross rate feature | 10 |
| Model algorithm | Training set | Test set | ||||||
|---|---|---|---|---|---|---|---|---|
| Accuracy | Sensitivity | Specificity | ROC AUC | Accuracy | Sensitivity | Specificity | AUC | |
| AdaBoost | 100% | 100% | 100% | 100% | 90% | 88.9% | 90.9% | 96% |
| RF | 100% | 100% | 100% | 100% | 80% | 77.8% | 81.8% | 80.8% |
| LDA | 89.4% | 91.2% | 88.1% | 92.7% | 90% | 100% | 81.8% | 87.9% |
| LRLasso | 79.0% | 82.4% | 76.2% | 80.1% | 80% | 77.8% | 81.8% | 74.8% |
| SVM | 77.6% | 76.5% | 78.6% | 80.3% | 80% | 77.8% | 81.8% | 73.7% |
| LR | 67.1% | 67.7% | 66.7% | 63.4% | 70% | 55.6% | 81.8% | 54.6% |
表5 基于文本朗读语音的阈下抑郁分类模型性能指标
Tab.5 Performance metrics of subthreshold depression classification model based on text-reading speech data
| Model algorithm | Training set | Test set | ||||||
|---|---|---|---|---|---|---|---|---|
| Accuracy | Sensitivity | Specificity | ROC AUC | Accuracy | Sensitivity | Specificity | AUC | |
| AdaBoost | 100% | 100% | 100% | 100% | 90% | 88.9% | 90.9% | 96% |
| RF | 100% | 100% | 100% | 100% | 80% | 77.8% | 81.8% | 80.8% |
| LDA | 89.4% | 91.2% | 88.1% | 92.7% | 90% | 100% | 81.8% | 87.9% |
| LRLasso | 79.0% | 82.4% | 76.2% | 80.1% | 80% | 77.8% | 81.8% | 74.8% |
| SVM | 77.6% | 76.5% | 78.6% | 80.3% | 80% | 77.8% | 81.8% | 73.7% |
| LR | 67.1% | 67.7% | 66.7% | 63.4% | 70% | 55.6% | 81.8% | 54.6% |
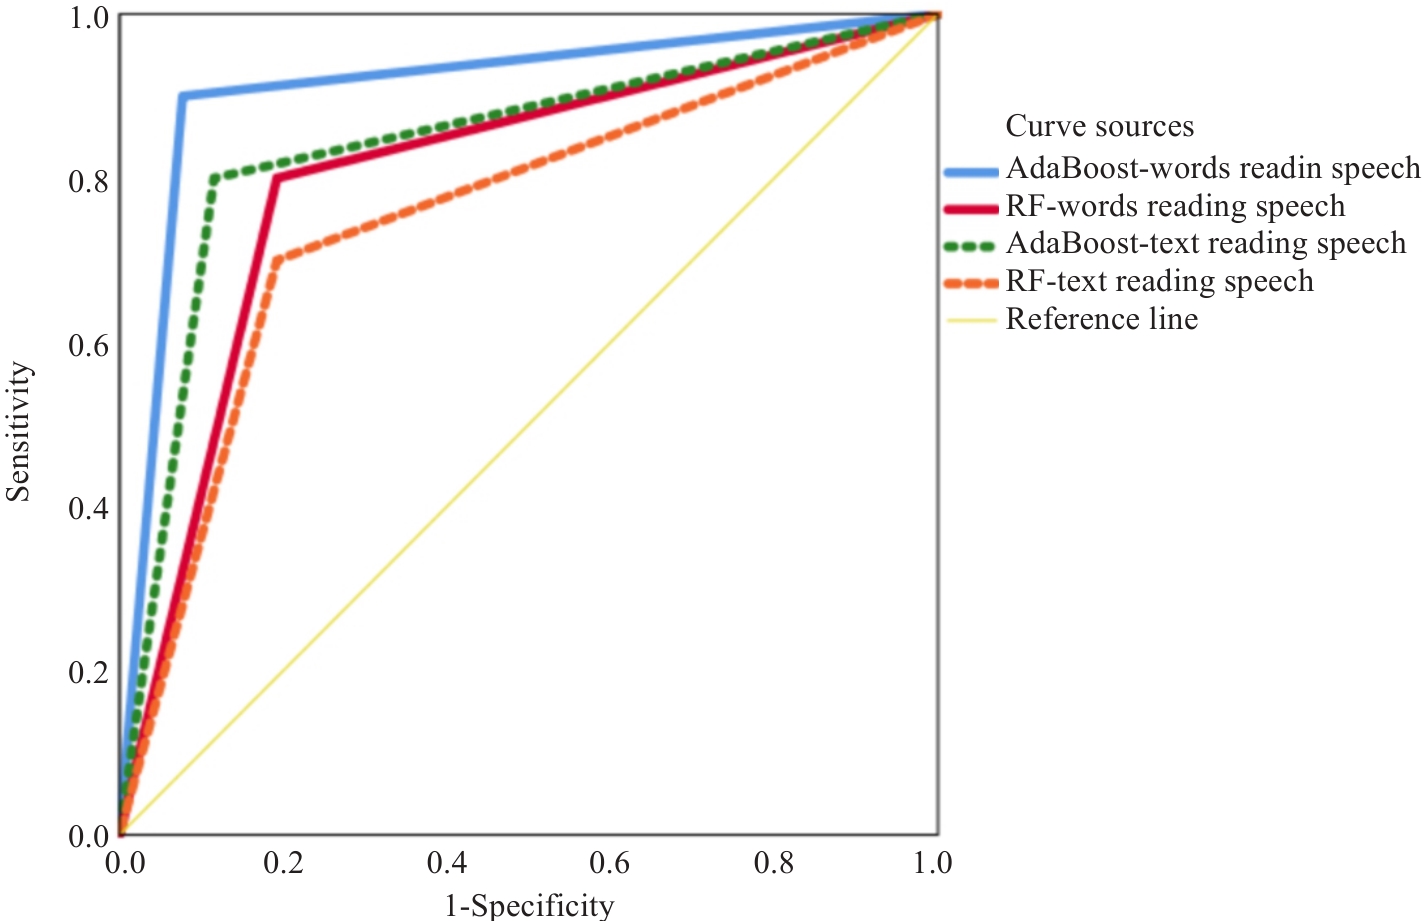
图1 朗读单词和文本语音情绪特征AdaBoost和RF分类模型对真实世界语音样本的阈下抑郁预测结果的ROC曲线分析图
Fig.1 ROC curve analysis of AdaBoost and RF classification models for predicting subthreshold depression in real-world speech samples based on emotion features from word and text reading speeches.
| 1 | 关 茜, 周小芳, 李福凤. 闻诊中医理论基础及现代化研究进展[J]. 中华中医药杂志, 2022, 37(4): 2134-6. |
| 2 | Yamamoto M, Takamiya A, Sawada K, et al. Using speech recognition technology to investigate the association between timing-related speech features and depression severity[J]. PLoS One, 2020, 15(9): e0238726. |
| 3 | Liang L, Wang Y, Ma H, et al. Enhanced classification and severity prediction of major depressive disorder using acoustic features and machine learning[J]. Front Psychiatry, 2024, 15: 1422020. |
| 4 | Zhao Q, Fan HZ, Li YL, et al. Vocal acoustic features as potential biomarkers for identifying/diagnosing depression: a cross-sectional study[J]. Front Psychiatry, 2022, 13: 815678. |
| 5 | König A, Tröger J, Mallick E, et al. Detecting subtle signs of depression with automated speech analysis in a non-clinical sample[J]. BMC Psychiatry, 2022, 22(1): 830. |
| 6 | Koops S, Brederoo SG, de Boer JN, et al. Speech as a biomarker for depression[J]. CNS Neurol Disord Drug Targets, 2023, 22(2): 152-60. |
| 7 | Little B, Alshabrawy O, Stow D, et al. Deep learning-based automated speech detection as a marker of social functioning in late-life depression[J]. Psychol Med, 2021, 51(9): 1441-50. |
| 8 | 袁钦湄, 王 星, 帅建伟, 等. 基于人工智能技术的抑郁症研究进展[J]. 中国临床心理学杂志, 2020, 28(1): 82-6. DOI: 10.16128/j.cnki.1005-3611.2020.01.019 |
| 9 | 罗德虎, 冉启武, 杨 超, 等. 语音情感识别研究综述[J]. 计算机工程与应用, 2022, 58(21): 40-52. DOI: 10.3778/j.issn.1002-8331.2206-0352 |
| 10 | Judd LL, Rapaport MH, Paulus MP, et al. Subsyndromal symptomatic depression: a new mood disorder[J]? J Clin Psychiatry, 1994, 55(): 18-28. |
| 11 | 沈渔邨. 精神病学[M]. 北京: 北京医科大学出版社, 2002. |
| 12 | 王一牛, 周立明, 罗跃嘉. 汉语情感词系统的初步编制及评定[J]. 中国心理卫生杂志, 2008, 22(8): 608-12. |
| 13 | Eyben F, Wöllmer M, Schuller B. Opensmile: the Munich versatile and fast open-source audio feature extractor[C]//Proceedings of the 18th ACM International Conference on Multimedia. Firenze Italy. ACM, 2010: 1459-1462. |
| 14 | Jeon H, Oh S. Hybrid-recursive feature elimination for efficient feature selection[J]. Appl Sci, 2020, 10(9): 3211. |
| 15 | Cervantes J, Garcia-Lamont F, Rodríguez-Mazahua L, et al. A comprehensive survey on support vector machine classification: Applications, challenges and trends[J]. Neurocomputing, 2020, 408: 189-215. |
| 16 | 向进勇, 王振华, 邓芸芸. 基于随机森林算法的机器学习分类研究综述[J]. 人工智能与机器人研究, 2024, 13(1): 143-52. |
| 17 | 奚丽婧, 郭昭艳, 杨雪珂, 等. LASSO及其拓展方法在回归分析变量筛选中的应用[J]. 中华预防医学杂志, 2023, 57(1): 107-11. |
| 18 | Song X, Liu XY, Liu F, et al. Comparison of machine learning and logistic regression models in predicting acute kidney injury: a systematic review and meta-analysis[J]. Int J Med Inform, 2021, 151: 104484. |
| 19 | Zhao SP, Zhang B, Yang J, et al. Linear discriminant analysis[J]. Nat Rev Meth Primers, 2024, 4: 70. |
| 20 | Taherkhani A, Cosma G, McGinnity TM. AdaBoost-CNN: an adaptive boosting algorithm for convolutional neural networks to classify multi-class imbalanced datasets using transfer learning[J]. Neurocomputing, 2020, 404: 351-66. |
| 21 | Rainio O, Teuho J, Klén R. Evaluation metrics and statistical tests for machine learning[J]. Sci Rep, 2024, 14: 6086. |
| 22 | Menne F, Dörr F, Schräder J, et al. The voice of depression: speech features as biomarkers for major depressive disorder[J]. BMC Psychiatry, 2024, 24(1): 794. |
| 23 | Di Y, Wang J, Liu X, et al. Combining polygenic risk score and voice features to detect major depressive disorders[J]. Front Genet, 2021, 12: 761141. |
| 24 | Di Y, Wang J, Li W, et al. Using i-vectors from voice features to identify major depressive disorder[J]. J Affect Disord, 2021, 288: 161-6. |
| 25 | 吴朝毅, 王 振. 抑郁症情绪失调的动态特征:情绪动力学的视角[J]. 心理科学进展, 2024, 32(2): 364-385. |
| 26 | 刘振焘, 向春妮, 刘陈陵, 等. 基于语音的抑郁检测研究综述[J]. 信号处理, 2023, 39(4): 616-31. |
| 27 | Rejaibi E, Komaty A, Meriaudeau F, et al. MFCC-based Recurrent Neural Network for automatic clinical depression recognition and assessment from speech[J]. Biomed Signal Process Contr, 2022, 71: 103107. |
| 28 | Yokota K, Ishikawa S, Takezaki K, et al. Numerical analysis and physical consideration of vocal fold vibration by modal analysis[J]. J Sound Vib, 2021, 514: 116442. |
| 29 | Ozdas A, Shiavi RG, Silverman SE, et al. Investigation of vocal jitter and glottal flow spectrum as possible cues for depression and near-term suicidal risk[J]. IEEE Trans Biomed Eng, 2004, 51(9): 1530-40. |
| 30 | Wang Y, Liang L, Zhang Z, et al. Fast and accurate assessment of depression based on voice acoustic features: a cross-sectional and longitudinal study[J]. Front Psychiatry, 2023, 14: 1195276. |
| 31 | Hammoud M, Getahun MN, Baldycheva A, et al. Machine learning-based infant crying interpretation[J]. Front Artif Intell, 2024, 7: 1337356. |
| [1] | 申采玉, 王帅, 周锐盈, 汪雨贺, 高琴, 陈兴智, 杨枢. 慢性心力衰竭合并肺部感染患者院内死亡风险预测:基于可解释性机器学习方法[J]. 南方医科大学学报, 2024, 44(6): 1141-1148. |
| [2] | 陈莉莉, 吴天宇, 张铭, 丁子夏, 张妍, 杨依清, 郑佳倩, 张小楠. 类风湿关节炎的潜在生物标志物及其免疫调控机制:基于GEO数据库[J]. 南方医科大学学报, 2024, 44(6): 1098-1108. |
| [3] | 左志威, 孟庆良, 崔家康, 郭克磊, 卞华. 基于硬皮病线粒体相关基因的人工神经网络模型的构建[J]. 南方医科大学学报, 2024, 44(5): 920-929. |
| [4] | 黄晓茵, 陈凤莲, 张煜, 梁淑君. 多参数多区域MRI影像组学特征与临床信息联合模型可有效预测脑胶质瘤患者生存期[J]. 南方医科大学学报, 2024, 44(10): 2004-2014. |
| [5] | 何慧珊, 郭二嘉, 蒙文仪, 王 彧, 王 雯, 何文乐, 吴元魁, 阳 维. 基于磁共振图像机器学习放射组学模型预测脑胶质瘤的强化[J]. 南方医科大学学报, 2024, 44(1): 194-200. |
| [6] | 罗 枭, 程 义, 吴 骋, 贺 佳. 预测重症缺血性脑卒中死亡风险的模型:基于内在可解释性机器学习方法[J]. 南方医科大学学报, 2023, 43(7): 1241-1247. |
| [7] | 高凯绩, 王一豪, 曹海坤, 贾建光. 机器学习模型和Cox回归模型预测食管胃结合部腺癌预后的效能[J]. 南方医科大学学报, 2023, 43(6): 952-963. |
| [8] | 曾彭归航, 唐秀晓, 吴庭芩, 田 奇, 李茫茫, 丁俊军. 潜在的胚胎干细胞自我更新与多能性的调控基因的鉴定:基于随机森林算法[J]. 南方医科大学学报, 2021, 41(8): 1234-1242. |
| [9] | 曹众平, 熊习安, 杨 群. 朴素贝叶斯分类器在化疗所致恶心呕吐风险预测模型上的应用[J]. 南方医科大学学报, 2021, 41(4): 607-612. |
| [10] | 王 啸, 黄 鉴, 吉 祥, 珠 珠. 人工智能在结肠息肉检测与分类中的应用[J]. 南方医科大学学报, 2021, 41(2): 310-312. |
| [11] | 刘幔利,孟雅婧,魏 巍,李 涛. 生物节律相关脑功能连接异常与双相情感障碍的相关性[J]. 南方医科大学学报, 2020, 40(06): 822-827. |
| [12] | 邓杰航,何冬冬,卓家鸿,赵 建,肖 成,康晓东,胡孙林,顾国生,刘 超. 复杂背景干扰下硅藻图像的深度网络识别与定位[J]. 南方医科大学学报, 2020, 40(02): 183-189. |
| [13] | 路浚齐,王珊,尹恝,吴珊,何彦,郑慧敏,盛华芳,周宏伟. 基于肠道菌群预测摄入胆碱后血氧化三甲胺的变化[J]. 南方医科大学学报, 2017, 37(03): 290-. |
| 阅读次数 | ||||||
|
全文 |
|
|||||
|
摘要 |
|
|||||