南方医科大学学报 ›› 2025, Vol. 45 ›› Issue (3): 443-452.doi: 10.12122/j.issn.1673-4254.2025.03.01
• • 下一篇
周莹1( ), 张丹阳2, 吴立凡3, 王桂杉1, 母杰丹1, 崔成文1, 石秀秀1, 董继革4, 王瑜2, 许王莉2, 李晓1()
收稿日期:2024-11-28
出版日期:2025-03-20
发布日期:2025-03-28
通讯作者:
李晓
E-mail:zhouying1018atnm@sina.com;lixiaoPLA@163.com
作者简介:周 莹,硕士,E-mail: zhouying1018atnm@sina.com
基金资助:
Ying ZHOU1(), Danyang ZHANG2, Lifan WU3, Guishan WANG1, Jiedan MU1, Chengwen CUI1, Xiuxiu SHI1, Jige DONG4, Yu WANG2, Wangli XU2, Xiao LI1()
Received:2024-11-28
Online:2025-03-20
Published:2025-03-28
Contact:
Xiao LI
E-mail:zhouying1018atnm@sina.com;lixiaoPLA@163.com
摘要:
目的 分析本中心DXA检查人群骨量分布及骨量的影响因素。 方法 收集2013年7月~2023年7月在本院行双能X线吸收法(DXA)骨密度检查的30 599例20岁以上汉族人群的骨密度结果,并收集其身高、体质量和性别等一般信息,使用R语言软件进行描述性和相关性统计学分析。 结果 本中心男性腰椎、股骨颈和全髋的骨量峰值分别为1.00±0.12 g/cm2、0.94±0.14 g/cm2、0.99±0.13 g/cm2,女性分别为0.99±0.12 g/cm2、0.79±0.11 g/cm2、0.88±0.11 g/cm2,男性显著高于女性(腰椎P=0.022,股骨颈P<0.001,全髋P<0.001);成年男性和女性腰椎、股骨骨密度(BMD)值在达到峰值后随着年龄增长而降低;男性和女性各个部位BMD值与体质量指数(BMI)之间存在正向相关关系;2013~2014年男性和女性患者腰椎、髋部、股骨颈BMD值均为近10年最低值,2015~2023年男性和女性患者腰椎、髋部、股骨颈BMD值呈上升趋势。 结论 不同人群的BMD值存在差异。未来需要采用更精准的BMD检测技术,开展多中心有代表性人群的临床研究,以探索人群BMD值随人口统计学的变化特征。
周莹, 张丹阳, 吴立凡, 王桂杉, 母杰丹, 崔成文, 石秀秀, 董继革, 王瑜, 许王莉, 李晓. 北京地区近10年骨质疏松症流行病学调查:一项单中心30 599例汉族人群双能X线吸收法骨密度检查结果分析[J]. 南方医科大学学报, 2025, 45(3): 443-452.
Ying ZHOU, Danyang ZHANG, Lifan WU, Guishan WANG, Jiedan MU, Chengwen CUI, Xiuxiu SHI, Jige DONG, Yu WANG, Wangli XU, Xiao LI. Epidemiological survey of osteoporosis in Beijing over the past decade: a single-center analysis of dual-energy X-ray absorptiometry scans from 30 599 individuals[J]. Journal of Southern Medical University, 2025, 45(3): 443-452.
| Characteristic | Total (n=30 599) | Men (n=11 228) | Women (n=19 371) | P |
|---|---|---|---|---|
| Age [year, n (%)] | <0.001 | |||
| ≤19 | 83 (0.3%) | 48 (0.4%) | 35 (0.2%) | |
| 20-24 | 663 (2.2%) | 503 (4.5%) | 160 (0.8%) | |
| 25-29 | 851 (2.8%) | 546 (4.9%) | 305 (1.6%) | |
| 30-34 | 1001 (3.3%) | 553 (4.9%) | 448 (2.3%) | |
| 35-39 | 1112 (3.6%) | 522 (4.6%) | 590 (3.0%) | |
| 40-44 | 1524 (5.0%) | 619 (5.5%) | 905 (4.7%) | |
| 45-49 | 2,403 (7.9%) | 876 (7.8%) | 1527 (7.9%) | |
| 50-54 | 3828 (13.0%) | 1175 (10.0%) | 2653 (14.0%) | |
| 55-59 | 4157 (14.0%) | 1206 (11.0%) | 2951 (15.0%) | |
| 60-64 | 4319 (14.0%) | 1370 (12.0%) | 2949 (15.0%) | |
| 65-69 | 3680 (12.0%) | 1218 (11.0%) | 2462 (13.0%) | |
| 70-74 | 2768 (9.0%) | 951 (8.5%) | 1817 (9.4%) | |
| 75-79 | 2227 (7.3%) | 780 (6.9%) | 1447 (7.5%) | |
| ≥80 | 1983 (6.5%) | 861 (7.7%) | 1122 (5.8%) | |
| BMI# [kg/m2, n (%)] | <0.001 | |||
| <18.5 | 1073 (3.5%) | 272 (2.4%) | 801 (4.2%) | |
| 18.5-23.9 | 13 545 (45%) | 4244 (38%) | 9301 (48%) | |
| 24-27.9 | 11 539 (38%) | 4807 (43%) | 6732 (35%) | |
| ≥28 | 4174 (14%) | 1803 (16%) | 2371 (12%) | |
| Year of BMD measurement | <0.001 | |||
| 2013 | 2633 (8.6%) | 724 (6.4%) | 1909 (9.9%) | |
| 2014 | 4041 (13%) | 1307 (12%) | 2734 (14%) | |
| 2015 | 3018 (9.9%) | 1017 (9.1%) | 2001 (10%) | |
| 2016 | 3073 (10%) | 1145 (10%) | 1928 (10.0%) | |
| 2017 | 2817 (9.2%) | 1130 (10%) | 1687 (8.7%) | |
| 2018 | 2715 (8.9%) | 1000 (8.9%) | 1715 (8.9%) | |
| 2019 | 2503 (8.2%) | 944 (8.4%) | 1559 (8.0%) | |
| 2020 | 1102 (3.6%) | 410 (3.7%) | 692 (3.6%) | |
| 2021 | 3488 (11%) | 1432 (13%) | 2056 (11%) | |
| 2022 | 3048 (10.0%) | 1212 (11%) | 1836 (9.5%) | |
| 2023 | 2161 (7.1%) | 907 (8.1%) | 1254 (6.5%) |
表1 受试者的一般信息
Tab.1 Demographic characteristics of the participants
| Characteristic | Total (n=30 599) | Men (n=11 228) | Women (n=19 371) | P |
|---|---|---|---|---|
| Age [year, n (%)] | <0.001 | |||
| ≤19 | 83 (0.3%) | 48 (0.4%) | 35 (0.2%) | |
| 20-24 | 663 (2.2%) | 503 (4.5%) | 160 (0.8%) | |
| 25-29 | 851 (2.8%) | 546 (4.9%) | 305 (1.6%) | |
| 30-34 | 1001 (3.3%) | 553 (4.9%) | 448 (2.3%) | |
| 35-39 | 1112 (3.6%) | 522 (4.6%) | 590 (3.0%) | |
| 40-44 | 1524 (5.0%) | 619 (5.5%) | 905 (4.7%) | |
| 45-49 | 2,403 (7.9%) | 876 (7.8%) | 1527 (7.9%) | |
| 50-54 | 3828 (13.0%) | 1175 (10.0%) | 2653 (14.0%) | |
| 55-59 | 4157 (14.0%) | 1206 (11.0%) | 2951 (15.0%) | |
| 60-64 | 4319 (14.0%) | 1370 (12.0%) | 2949 (15.0%) | |
| 65-69 | 3680 (12.0%) | 1218 (11.0%) | 2462 (13.0%) | |
| 70-74 | 2768 (9.0%) | 951 (8.5%) | 1817 (9.4%) | |
| 75-79 | 2227 (7.3%) | 780 (6.9%) | 1447 (7.5%) | |
| ≥80 | 1983 (6.5%) | 861 (7.7%) | 1122 (5.8%) | |
| BMI# [kg/m2, n (%)] | <0.001 | |||
| <18.5 | 1073 (3.5%) | 272 (2.4%) | 801 (4.2%) | |
| 18.5-23.9 | 13 545 (45%) | 4244 (38%) | 9301 (48%) | |
| 24-27.9 | 11 539 (38%) | 4807 (43%) | 6732 (35%) | |
| ≥28 | 4174 (14%) | 1803 (16%) | 2371 (12%) | |
| Year of BMD measurement | <0.001 | |||
| 2013 | 2633 (8.6%) | 724 (6.4%) | 1909 (9.9%) | |
| 2014 | 4041 (13%) | 1307 (12%) | 2734 (14%) | |
| 2015 | 3018 (9.9%) | 1017 (9.1%) | 2001 (10%) | |
| 2016 | 3073 (10%) | 1145 (10%) | 1928 (10.0%) | |
| 2017 | 2817 (9.2%) | 1130 (10%) | 1687 (8.7%) | |
| 2018 | 2715 (8.9%) | 1000 (8.9%) | 1715 (8.9%) | |
| 2019 | 2503 (8.2%) | 944 (8.4%) | 1559 (8.0%) | |
| 2020 | 1102 (3.6%) | 410 (3.7%) | 692 (3.6%) | |
| 2021 | 3488 (11%) | 1432 (13%) | 2056 (11%) | |
| 2022 | 3048 (10.0%) | 1212 (11%) | 1836 (9.5%) | |
| 2023 | 2161 (7.1%) | 907 (8.1%) | 1254 (6.5%) |
| Age group (year) | BMI (kg/m2) | Lumbar spine 1-4 BMD (g/cm2) | Total femur BMD (g/cm2) | Femoral neck BMD (g/cm2) |
|---|---|---|---|---|
| ≤19 | 21.42±3.45 | 0.90±0.15 | 0.86±0.17 | 0.79±0.16 |
| 20-24 | 22.69±3.42 | 0.98±0.11 | 0.96±0.14 | 0.90±0.15 |
| 25-29 | 22.84±3.66 | 0.99±0.12 | 0.94±0.15 | 0.87±0.15 |
| 30-34 | 23.63±3.82 | 0.98±0.12 | 0.91±0.13 | 0.83±0.13 |
| 35-39 | 24.00±3.85 | 0.99±0.12 | 0.90±0.12 | 0.81±0.13 |
| 40-44 | 24.26±3.59 | 0.99±0.12 | 0.90±0.12 | 0.80±0.12 |
| 45-49 | 24.42±3.45 | 0.98±0.14 | 0.90±0.13 | 0.79±0.12 |
| 50-54 | 24.47±3.41 | 0.95±0.14 | 0.87±0.13 | 0.76±0.12 |
| 55-59 | 24.60±3.38 | 0.90±0.15 | 0.84±0.13 | 0.73±0.12 |
| 60-64 | 24.55±3.31 | 0.89±0.16 | 0.82±0.13 | 0.70±0.12 |
| 65-69 | 24.73±3.34 | 0.88±0.18 | 0.80±0.14 | 0.69±0.13 |
| 70-74 | 24.52±3.45 | 0.88±0.19 | 0.78±0.14 | 0.66±0.12 |
| 75-79 | 24.00±3.42 | 0.88±0.19 | 0.75±0.14 | 0.63±0.13 |
| ≥80 | 23.50±3.36 | 0.91±0.21 | 0.74±0.15 | 0.62±0.13 |
表2 不同年龄组的BMI和BMD的分布
Tab.2 BMD values and BMI across the age groups (Mean±SD)
| Age group (year) | BMI (kg/m2) | Lumbar spine 1-4 BMD (g/cm2) | Total femur BMD (g/cm2) | Femoral neck BMD (g/cm2) |
|---|---|---|---|---|
| ≤19 | 21.42±3.45 | 0.90±0.15 | 0.86±0.17 | 0.79±0.16 |
| 20-24 | 22.69±3.42 | 0.98±0.11 | 0.96±0.14 | 0.90±0.15 |
| 25-29 | 22.84±3.66 | 0.99±0.12 | 0.94±0.15 | 0.87±0.15 |
| 30-34 | 23.63±3.82 | 0.98±0.12 | 0.91±0.13 | 0.83±0.13 |
| 35-39 | 24.00±3.85 | 0.99±0.12 | 0.90±0.12 | 0.81±0.13 |
| 40-44 | 24.26±3.59 | 0.99±0.12 | 0.90±0.12 | 0.80±0.12 |
| 45-49 | 24.42±3.45 | 0.98±0.14 | 0.90±0.13 | 0.79±0.12 |
| 50-54 | 24.47±3.41 | 0.95±0.14 | 0.87±0.13 | 0.76±0.12 |
| 55-59 | 24.60±3.38 | 0.90±0.15 | 0.84±0.13 | 0.73±0.12 |
| 60-64 | 24.55±3.31 | 0.89±0.16 | 0.82±0.13 | 0.70±0.12 |
| 65-69 | 24.73±3.34 | 0.88±0.18 | 0.80±0.14 | 0.69±0.13 |
| 70-74 | 24.52±3.45 | 0.88±0.19 | 0.78±0.14 | 0.66±0.12 |
| 75-79 | 24.00±3.42 | 0.88±0.19 | 0.75±0.14 | 0.63±0.13 |
| ≥80 | 23.50±3.36 | 0.91±0.21 | 0.74±0.15 | 0.62±0.13 |
| Age group (year) | BMI (kg/m2) | Lumbar spine 1-4 BMD (g/cm2) | Total femur BMD (g/cm2) | Femoral neck BMD (g/cm2) |
|---|---|---|---|---|
| ≤19 | 21.72±3.62 | 0.89±0.16 | 0.88±0.20 | 0.80±0.19 |
| 20-24 | 23.21±3.28 | 0.98±0.12 | 0.99±0.13 | 0.94±0.14 |
| 25-29 | 23.80±3.38 | 1.00±0.12 | 0.98±0.15 | 0.91±0.15 |
| 30-34 | 24.96±3.50 | 0.99±0.12 | 0.95±0.12 | 0.87±0.12 |
| 35-39 | 25.57±3.76 | 0.99±0.13 | 0.94±0.13 | 0.86±0.13 |
| 40-44 | 25.64±3.42 | 0.98±0.14 | 0.93±0.13 | 0.83±0.13 |
| 45-49 | 25.85±3.42 | 0.97±0.14 | 0.92±0.13 | 0.82±0.12 |
| 50-54 | 25.51±3.43 | 0.98±0.15 | 0.91±0.13 | 0.80±0.12 |
| 55-59 | 25.41±3.26 | 0.97±0.15 | 0.91±0.13 | 0.79±0.12 |
| 60-64 | 25.03±3.13 | 0.98±0.16 | 0.90±0.13 | 0.78±0.12 |
| 65-69 | 24.97±3.08 | 1.00±0.17 | 0.90±0.13 | 0.77±0.12 |
| 70-74 | 24.61±3.12 | 1.00±0.18 | 0.88±0.13 | 0.74±0.12 |
| 75-79 | 23.80±3.14 | 1.01±0.18 | 0.86±0.13 | 0.72±0.13 |
| ≥80 | 23.53±3.14 | 1.03±0.20 | 0.83±0.14 | 0.70±0.12 |
表3 男性不同年龄组的身高、体质量和BMI的分布
Tab.3 BMD values and BMI across the age groups in men (Mean±SD)
| Age group (year) | BMI (kg/m2) | Lumbar spine 1-4 BMD (g/cm2) | Total femur BMD (g/cm2) | Femoral neck BMD (g/cm2) |
|---|---|---|---|---|
| ≤19 | 21.72±3.62 | 0.89±0.16 | 0.88±0.20 | 0.80±0.19 |
| 20-24 | 23.21±3.28 | 0.98±0.12 | 0.99±0.13 | 0.94±0.14 |
| 25-29 | 23.80±3.38 | 1.00±0.12 | 0.98±0.15 | 0.91±0.15 |
| 30-34 | 24.96±3.50 | 0.99±0.12 | 0.95±0.12 | 0.87±0.12 |
| 35-39 | 25.57±3.76 | 0.99±0.13 | 0.94±0.13 | 0.86±0.13 |
| 40-44 | 25.64±3.42 | 0.98±0.14 | 0.93±0.13 | 0.83±0.13 |
| 45-49 | 25.85±3.42 | 0.97±0.14 | 0.92±0.13 | 0.82±0.12 |
| 50-54 | 25.51±3.43 | 0.98±0.15 | 0.91±0.13 | 0.80±0.12 |
| 55-59 | 25.41±3.26 | 0.97±0.15 | 0.91±0.13 | 0.79±0.12 |
| 60-64 | 25.03±3.13 | 0.98±0.16 | 0.90±0.13 | 0.78±0.12 |
| 65-69 | 24.97±3.08 | 1.00±0.17 | 0.90±0.13 | 0.77±0.12 |
| 70-74 | 24.61±3.12 | 1.00±0.18 | 0.88±0.13 | 0.74±0.12 |
| 75-79 | 23.80±3.14 | 1.01±0.18 | 0.86±0.13 | 0.72±0.13 |
| ≥80 | 23.53±3.14 | 1.03±0.20 | 0.83±0.14 | 0.70±0.12 |
| Age group (year) | BMI (kg/m2) | Lumbar spine 1-4 BMD (g/cm2) | Total femur BMD (g/cm2) | Femoral neck BMD (g/cm2) |
|---|---|---|---|---|
| ≤19 | 21.02±3.21 | 0.92±0.13 | 0.84±0.13 | 0.78±0.12 |
| 20-24 | 21.04±3.35 | 0.96±0.11 | 0.87±0.11 | 0.79±0.11 |
| 25-29 | 21.13±3.52 | 0.97±0.11 | 0.86±0.11 | 0.78±0.10 |
| 30-34 | 22.00±3.57 | 0.98±0.12 | 0.86±0.12 | 0.77±0.12 |
| 35-39 | 22.61±3.36 | 0.99±0.12 | 0.87±0.11 | 0.77±0.10 |
| 40-44 | 23.31±3.39 | 0.99±0.12 | 0.88±0.11 | 0.78±0.11 |
| 45-49 | 23.60±3.20 | 0.98±0.13 | 0.88±0.12 | 0.77±0.12 |
| 50-54 | 24.01±3.30 | 0.94±0.14 | 0.86±0.12 | 0.75±0.11 |
| 55-59 | 24.27±3.37 | 0.87±0.14 | 0.81±0.12 | 0.70±0.11 |
| 60-64 | 24.33±3.36 | 0.84±0.13 | 0.78±0.11 | 0.67±0.10 |
| 65-69 | 24.61±3.46 | 0.82±0.15 | 0.75±0.12 | 0.64±0.10 |
| 70-74 | 24.48±3.60 | 0.82±0.15 | 0.73±0.12 | 0.61±0.10 |
| 75-79 | 24.11±3.56 | 0.81±0.15 | 0.70±0.12 | 0.58±0.10 |
| ≥80 | 23.48±3.51 | 0.83±0.16 | 0.66±0.12 | 0.56±0.10 |
表4 女性不同年龄组的身高、体质量和BMI的分布
Tab.4 BMD values and BMI across the age groups in women
| Age group (year) | BMI (kg/m2) | Lumbar spine 1-4 BMD (g/cm2) | Total femur BMD (g/cm2) | Femoral neck BMD (g/cm2) |
|---|---|---|---|---|
| ≤19 | 21.02±3.21 | 0.92±0.13 | 0.84±0.13 | 0.78±0.12 |
| 20-24 | 21.04±3.35 | 0.96±0.11 | 0.87±0.11 | 0.79±0.11 |
| 25-29 | 21.13±3.52 | 0.97±0.11 | 0.86±0.11 | 0.78±0.10 |
| 30-34 | 22.00±3.57 | 0.98±0.12 | 0.86±0.12 | 0.77±0.12 |
| 35-39 | 22.61±3.36 | 0.99±0.12 | 0.87±0.11 | 0.77±0.10 |
| 40-44 | 23.31±3.39 | 0.99±0.12 | 0.88±0.11 | 0.78±0.11 |
| 45-49 | 23.60±3.20 | 0.98±0.13 | 0.88±0.12 | 0.77±0.12 |
| 50-54 | 24.01±3.30 | 0.94±0.14 | 0.86±0.12 | 0.75±0.11 |
| 55-59 | 24.27±3.37 | 0.87±0.14 | 0.81±0.12 | 0.70±0.11 |
| 60-64 | 24.33±3.36 | 0.84±0.13 | 0.78±0.11 | 0.67±0.10 |
| 65-69 | 24.61±3.46 | 0.82±0.15 | 0.75±0.12 | 0.64±0.10 |
| 70-74 | 24.48±3.60 | 0.82±0.15 | 0.73±0.12 | 0.61±0.10 |
| 75-79 | 24.11±3.56 | 0.81±0.15 | 0.70±0.12 | 0.58±0.10 |
| ≥80 | 23.48±3.51 | 0.83±0.16 | 0.66±0.12 | 0.56±0.10 |
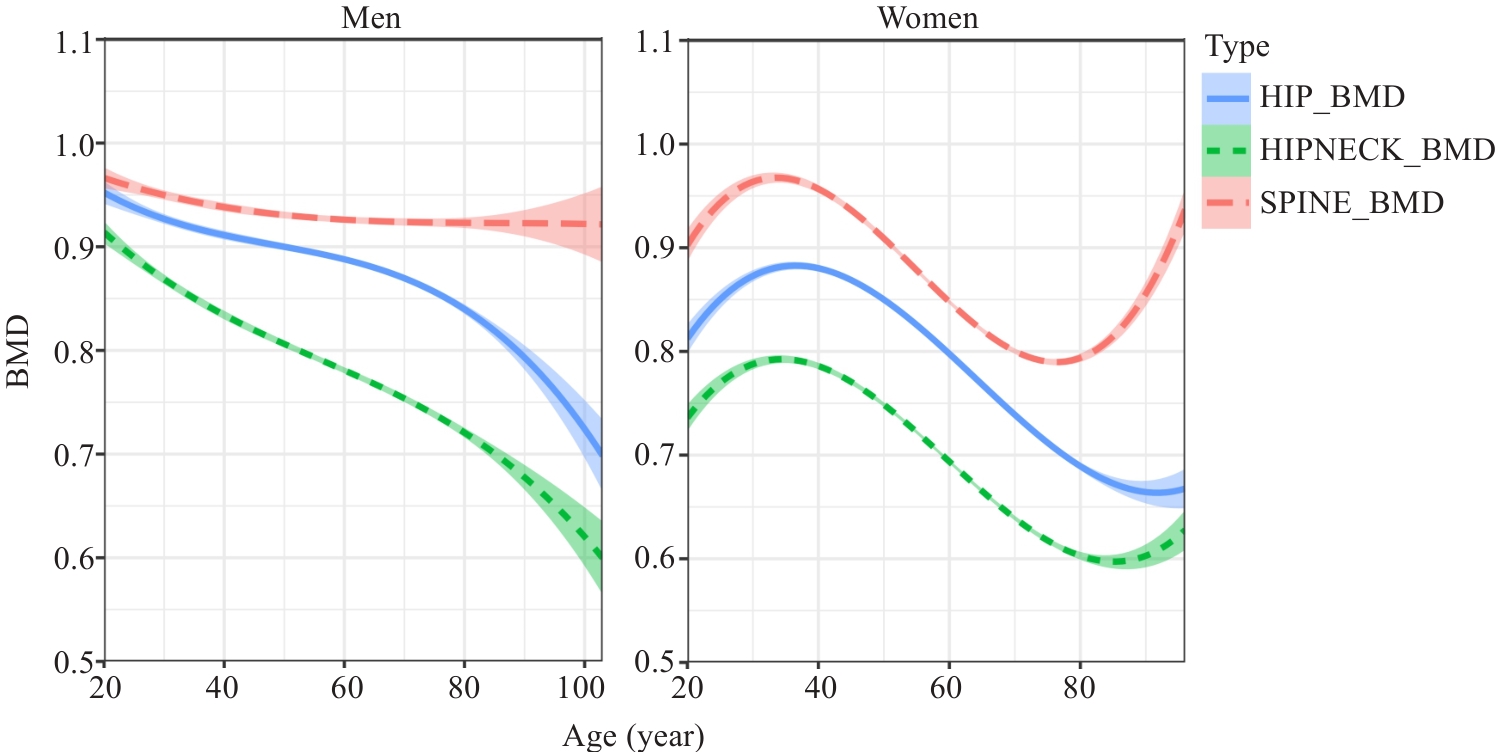
图1 男女性不同部位BMD随年龄分布情况
Fig.1 Cubic regression curves of BMD variation with age groups.
| BMI (kg/m2) | Lumbar spine 1-4 BMD (g/cm2) | Total femur BMD (g/cm2) | Femoral neck BMD (g/cm2) |
|---|---|---|---|
| Men | |||
| <18.5 | 0.76±0.13 | 0.87±0.16 | 0.67±0.13 |
| 18.5-23.9 | 0.87±0.13 | 0.96±0.15 | 0.77±0.14 |
| 24-27.9 | 0.92±0.13 | 1.01±0.15 | 0.81±0.13 |
| ≥28 | 0.97±0.13 | 1.05±0.16 | 0.85±0.13 |
| Women | |||
| <18.5 | 0.69±0.14 | 0.79±0.16 | 0.61±0.13 |
| 18.5-23.9 | 0.77±0.13 | 0.86±0.15 | 0.67±0.12 |
| 24-27.9 | 0.81±0.13 | 0.90±0.15 | 0.70±0.12 |
| ≥28 | 0.85±0.13 | 0.94±0.15 | 0.73±0.13 |
表5 男女性不同部位BMD随BMI分布情况
Tab.5 BMD values across the BMI groups in men and women
| BMI (kg/m2) | Lumbar spine 1-4 BMD (g/cm2) | Total femur BMD (g/cm2) | Femoral neck BMD (g/cm2) |
|---|---|---|---|
| Men | |||
| <18.5 | 0.76±0.13 | 0.87±0.16 | 0.67±0.13 |
| 18.5-23.9 | 0.87±0.13 | 0.96±0.15 | 0.77±0.14 |
| 24-27.9 | 0.92±0.13 | 1.01±0.15 | 0.81±0.13 |
| ≥28 | 0.97±0.13 | 1.05±0.16 | 0.85±0.13 |
| Women | |||
| <18.5 | 0.69±0.14 | 0.79±0.16 | 0.61±0.13 |
| 18.5-23.9 | 0.77±0.13 | 0.86±0.15 | 0.67±0.12 |
| 24-27.9 | 0.81±0.13 | 0.90±0.15 | 0.70±0.12 |
| ≥28 | 0.85±0.13 | 0.94±0.15 | 0.73±0.13 |
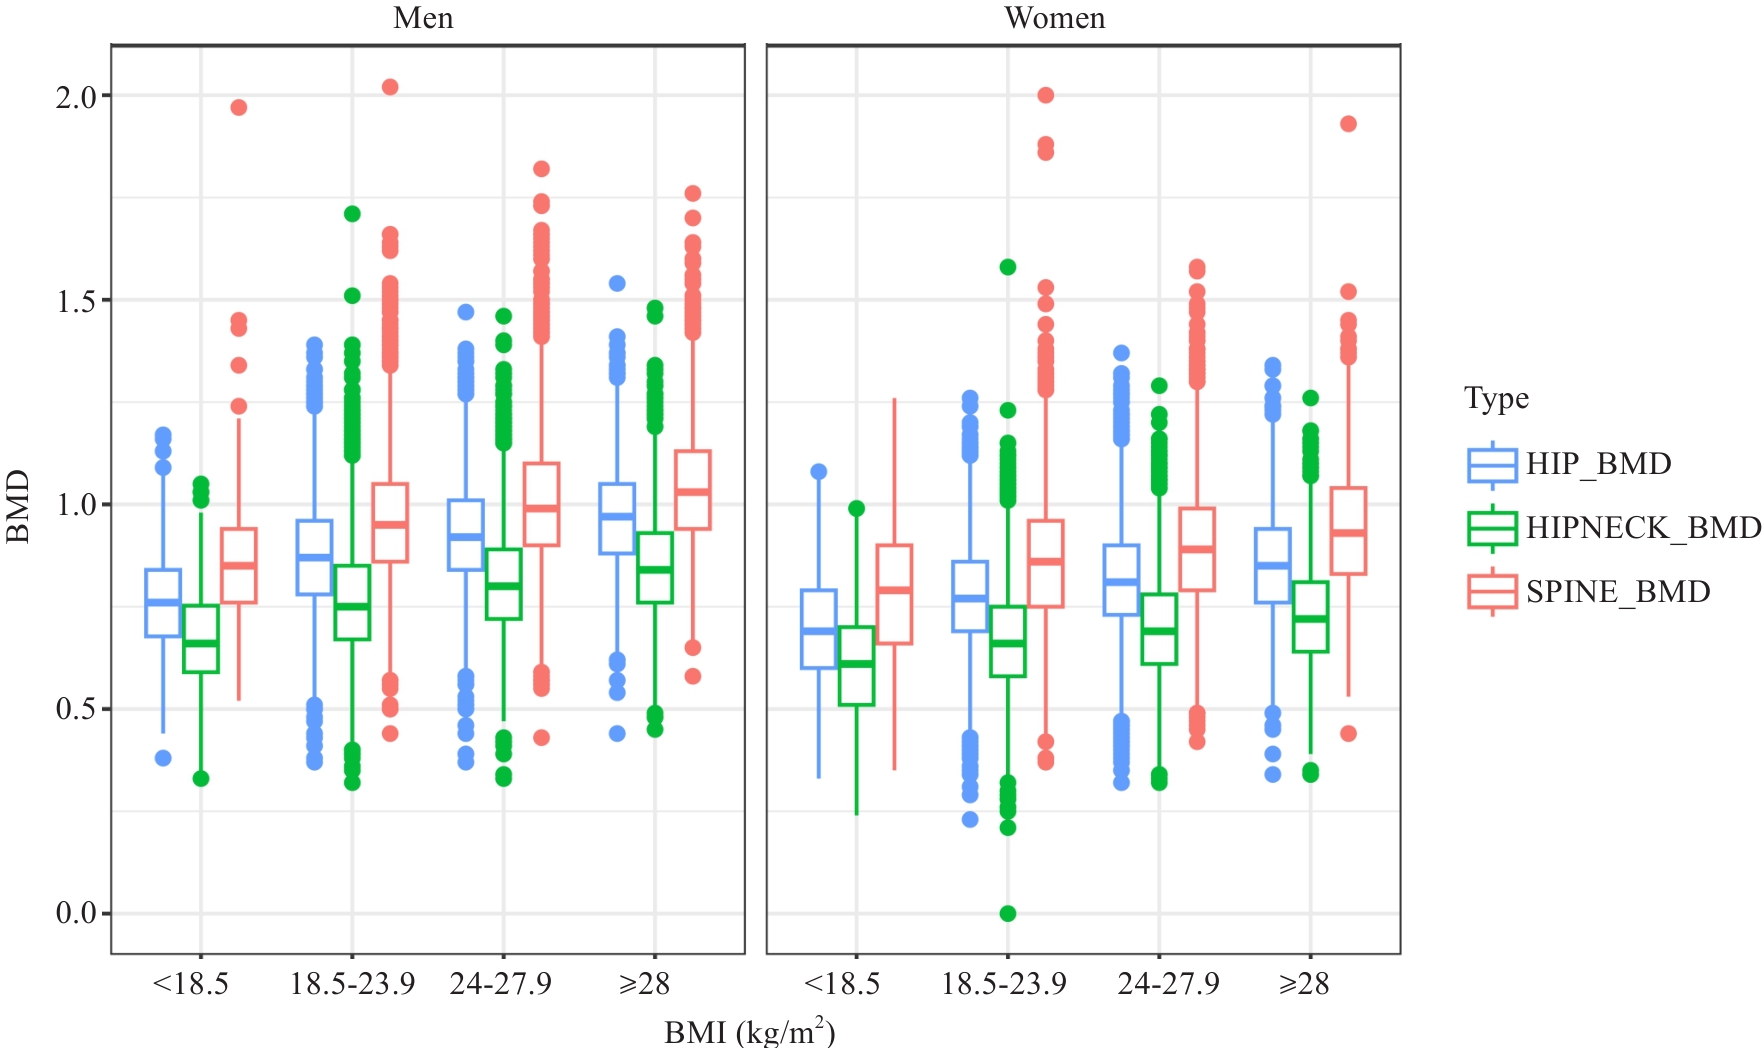
图2 男女性不同部位BMD随BMI分布情况
Fig. 2 Cubic regression curves of BMD variation with BMI groups.
| Variables | Total femur | Femoral neck | Lumbar spine 1-4 | ||||||
|---|---|---|---|---|---|---|---|---|---|
| β | SE | P | β | SE | P | β | SE | P | |
| Women | |||||||||
| Age groups (year) | |||||||||
| 20-24 | 0.025 | 0.021 | 0.238 | 0.014 | 0.019 | 0.487 | 0.026 | 0.025 | 0.295 |
| 25-29 | 0.001 | 0.020 | 0.955 | -0.016 | 0.019 | 0.405 | 0.014 | 0.024 | 0.557 |
| 30-34 | -0.026 | 0.020 | 0.183 | -0.038 | 0.018 | 0.040 | 0.000 | 0.024 | 0.991 |
| 35-39 | -0.038 | 0.020 | 0.051 | -0.054 | 0.018 | 0.003 | -0.017 | 0.024 | 0.459 |
| 40-44 | -0.045 | 0.020 | 0.022 | -0.065 | 0.018 | <0.001 | -0.041 | 0.024 | 0.078 |
| 45-49 | -0.054 | 0.020 | 0.006 | -0.071 | 0.018 | <0.001 | -0.057 | 0.024 | 0.015 |
| 50-54 | -0.078 | 0.020 | <0.001 | -0.096 | 0.019 | <0.001 | -0.097 | 0.024 | <0.001 |
| 55-59 | -0.128 | 0.020 | <0.001 | -0.140 | 0.019 | <0.001 | -0.159 | 0.024 | <0.001 |
| 60-64 | -0.176 | 0.020 | <0.001 | -0.186 | 0.019 | <0.001 | -0.214 | 0.025 | <0.001 |
| 65-69 | -0.224 | 0.021 | <0.001 | -0.228 | 0.019 | <0.001 | -0.257 | 0.025 | <0.001 |
| 70-74 | -0.264 | 0.021 | <0.001 | -0.265 | 0.020 | <0.001 | -0.280 | 0.026 | <0.001 |
| 75-79 | -0.305 | 0.022 | <0.001 | -0.304 | 0.020 | <0.001 | -0.307 | 0.026 | <0.001 |
| ≥80 | -0.347 | 0.022 | <0.001 | -0.337 | 0.021 | <0.001 | -0.309 | 0.027 | <0.001 |
| BMI (kg/m2) | |||||||||
| 18.5-23.9 | 0.046 | 0.004 | <0.001 | 0.038 | 0.004 | <0.001 | 0.035 | 0.005 | <0.001 |
| 24-27.9 | 0.070 | 0.006 | <0.001 | 0.061 | 0.005 | <0.001 | 0.043 | 0.007 | <0.001 |
| ≥28 | 0.071 | 0.008 | <0.001 | 0.064 | 0.007 | <0.001 | 0.039 | 0.010 | <0.001 |
| Age×BMI | 0.000 | 0.000 | <0.001 | 0.000 | 0.000 | <0.001 | 0.000 | 0.000 | <0.001 |
| Menopause | -0.051 | 0.003 | <0.001 | -0.044 | 0.003 | <0.001 | -0.082 | 0.004 | <0.001 |
| Men | |||||||||
| Age groups (year) | |||||||||
| 20-24 | 0.082 | 0.019 | <0.001 | 0.108 | 0.019 | <0.001 | 0.061 | 0.023 | 0.008 |
| 25-29 | 0.054 | 0.019 | 0.005 | 0.070 | 0.019 | <0.001 | 0.053 | 0.023 | 0.020 |
| 30-34 | -0.005 | 0.019 | 0.816 | 0.005 | 0.019 | 0.799 | 0.000 | 0.023 | 0.996 |
| 35-39 | -0.035 | 0.020 | 0.074 | -0.029 | 0.019 | 0.129 | -0.030 | 0.023 | 0.201 |
| 40-44 | -0.074 | 0.020 | <0.001 | -0.071 | 0.019 | <0.001 | -0.068 | 0.024 | 0.004 |
| 45-49 | -0.104 | 0.020 | <0.001 | -0.102 | 0.020 | <0.001 | -0.105 | 0.024 | <0.001 |
| 50-54 | -0.126 | 0.021 | <0.001 | -0.125 | 0.020 | <0.001 | -0.125 | 0.025 | <0.001 |
| 55-59 | -0.149 | 0.021 | <0.001 | -0.153 | 0.021 | <0.001 | -0.160 | 0.025 | <0.001 |
| 60-64 | -0.169 | 0.022 | <0.001 | -0.169 | 0.021 | <0.001 | -0.163 | 0.026 | <0.001 |
| 65-69 | -0.191 | 0.023 | <0.001 | -0.191 | 0.022 | <0.001 | -0.173 | 0.027 | <0.001 |
| 70-74 | -0.222 | 0.023 | <0.001 | -0.233 | 0.023 | <0.001 | -0.190 | 0.028 | <0.001 |
| 75-79 | -0.249 | 0.024 | <0.001 | -0.257 | 0.023 | <0.001 | -0.196 | 0.029 | <0.001 |
| ≥80 | -0.292 | 0.025 | <0.001 | -0.293 | 0.024 | <0.001 | -0.205 | 0.030 | <0.001 |
| BMI (kg/m2) | |||||||||
| 18.5-23.9 | 0.070 | 0.009 | <0.001 | 0.063 | 0.008 | <0.001 | 0.039 | 0.010 | <0.001 |
| 24-27.9 | 0.098 | 0.010 | <0.001 | 0.090 | 0.010 | <0.001 | 0.047 | 0.012 | <0.001 |
| ≥28 | 0.092 | 0.013 | <0.001 | 0.088 | 0.012 | <0.001 | 0.037 | 0.015 | 0.015 |
| Age×BMI | 0.000 | 0.000 | <0.001 | 0.000 | 0.000 | <0.001 | 0.000 | 0.000 | <0.001 |
表6 BMD值与人口学指标之间的多变量回归分析
Tab.6 Multivariate regression analyses of associations between BMD values and demographic variables
| Variables | Total femur | Femoral neck | Lumbar spine 1-4 | ||||||
|---|---|---|---|---|---|---|---|---|---|
| β | SE | P | β | SE | P | β | SE | P | |
| Women | |||||||||
| Age groups (year) | |||||||||
| 20-24 | 0.025 | 0.021 | 0.238 | 0.014 | 0.019 | 0.487 | 0.026 | 0.025 | 0.295 |
| 25-29 | 0.001 | 0.020 | 0.955 | -0.016 | 0.019 | 0.405 | 0.014 | 0.024 | 0.557 |
| 30-34 | -0.026 | 0.020 | 0.183 | -0.038 | 0.018 | 0.040 | 0.000 | 0.024 | 0.991 |
| 35-39 | -0.038 | 0.020 | 0.051 | -0.054 | 0.018 | 0.003 | -0.017 | 0.024 | 0.459 |
| 40-44 | -0.045 | 0.020 | 0.022 | -0.065 | 0.018 | <0.001 | -0.041 | 0.024 | 0.078 |
| 45-49 | -0.054 | 0.020 | 0.006 | -0.071 | 0.018 | <0.001 | -0.057 | 0.024 | 0.015 |
| 50-54 | -0.078 | 0.020 | <0.001 | -0.096 | 0.019 | <0.001 | -0.097 | 0.024 | <0.001 |
| 55-59 | -0.128 | 0.020 | <0.001 | -0.140 | 0.019 | <0.001 | -0.159 | 0.024 | <0.001 |
| 60-64 | -0.176 | 0.020 | <0.001 | -0.186 | 0.019 | <0.001 | -0.214 | 0.025 | <0.001 |
| 65-69 | -0.224 | 0.021 | <0.001 | -0.228 | 0.019 | <0.001 | -0.257 | 0.025 | <0.001 |
| 70-74 | -0.264 | 0.021 | <0.001 | -0.265 | 0.020 | <0.001 | -0.280 | 0.026 | <0.001 |
| 75-79 | -0.305 | 0.022 | <0.001 | -0.304 | 0.020 | <0.001 | -0.307 | 0.026 | <0.001 |
| ≥80 | -0.347 | 0.022 | <0.001 | -0.337 | 0.021 | <0.001 | -0.309 | 0.027 | <0.001 |
| BMI (kg/m2) | |||||||||
| 18.5-23.9 | 0.046 | 0.004 | <0.001 | 0.038 | 0.004 | <0.001 | 0.035 | 0.005 | <0.001 |
| 24-27.9 | 0.070 | 0.006 | <0.001 | 0.061 | 0.005 | <0.001 | 0.043 | 0.007 | <0.001 |
| ≥28 | 0.071 | 0.008 | <0.001 | 0.064 | 0.007 | <0.001 | 0.039 | 0.010 | <0.001 |
| Age×BMI | 0.000 | 0.000 | <0.001 | 0.000 | 0.000 | <0.001 | 0.000 | 0.000 | <0.001 |
| Menopause | -0.051 | 0.003 | <0.001 | -0.044 | 0.003 | <0.001 | -0.082 | 0.004 | <0.001 |
| Men | |||||||||
| Age groups (year) | |||||||||
| 20-24 | 0.082 | 0.019 | <0.001 | 0.108 | 0.019 | <0.001 | 0.061 | 0.023 | 0.008 |
| 25-29 | 0.054 | 0.019 | 0.005 | 0.070 | 0.019 | <0.001 | 0.053 | 0.023 | 0.020 |
| 30-34 | -0.005 | 0.019 | 0.816 | 0.005 | 0.019 | 0.799 | 0.000 | 0.023 | 0.996 |
| 35-39 | -0.035 | 0.020 | 0.074 | -0.029 | 0.019 | 0.129 | -0.030 | 0.023 | 0.201 |
| 40-44 | -0.074 | 0.020 | <0.001 | -0.071 | 0.019 | <0.001 | -0.068 | 0.024 | 0.004 |
| 45-49 | -0.104 | 0.020 | <0.001 | -0.102 | 0.020 | <0.001 | -0.105 | 0.024 | <0.001 |
| 50-54 | -0.126 | 0.021 | <0.001 | -0.125 | 0.020 | <0.001 | -0.125 | 0.025 | <0.001 |
| 55-59 | -0.149 | 0.021 | <0.001 | -0.153 | 0.021 | <0.001 | -0.160 | 0.025 | <0.001 |
| 60-64 | -0.169 | 0.022 | <0.001 | -0.169 | 0.021 | <0.001 | -0.163 | 0.026 | <0.001 |
| 65-69 | -0.191 | 0.023 | <0.001 | -0.191 | 0.022 | <0.001 | -0.173 | 0.027 | <0.001 |
| 70-74 | -0.222 | 0.023 | <0.001 | -0.233 | 0.023 | <0.001 | -0.190 | 0.028 | <0.001 |
| 75-79 | -0.249 | 0.024 | <0.001 | -0.257 | 0.023 | <0.001 | -0.196 | 0.029 | <0.001 |
| ≥80 | -0.292 | 0.025 | <0.001 | -0.293 | 0.024 | <0.001 | -0.205 | 0.030 | <0.001 |
| BMI (kg/m2) | |||||||||
| 18.5-23.9 | 0.070 | 0.009 | <0.001 | 0.063 | 0.008 | <0.001 | 0.039 | 0.010 | <0.001 |
| 24-27.9 | 0.098 | 0.010 | <0.001 | 0.090 | 0.010 | <0.001 | 0.047 | 0.012 | <0.001 |
| ≥28 | 0.092 | 0.013 | <0.001 | 0.088 | 0.012 | <0.001 | 0.037 | 0.015 | 0.015 |
| Age×BMI | 0.000 | 0.000 | <0.001 | 0.000 | 0.000 | <0.001 | 0.000 | 0.000 | <0.001 |
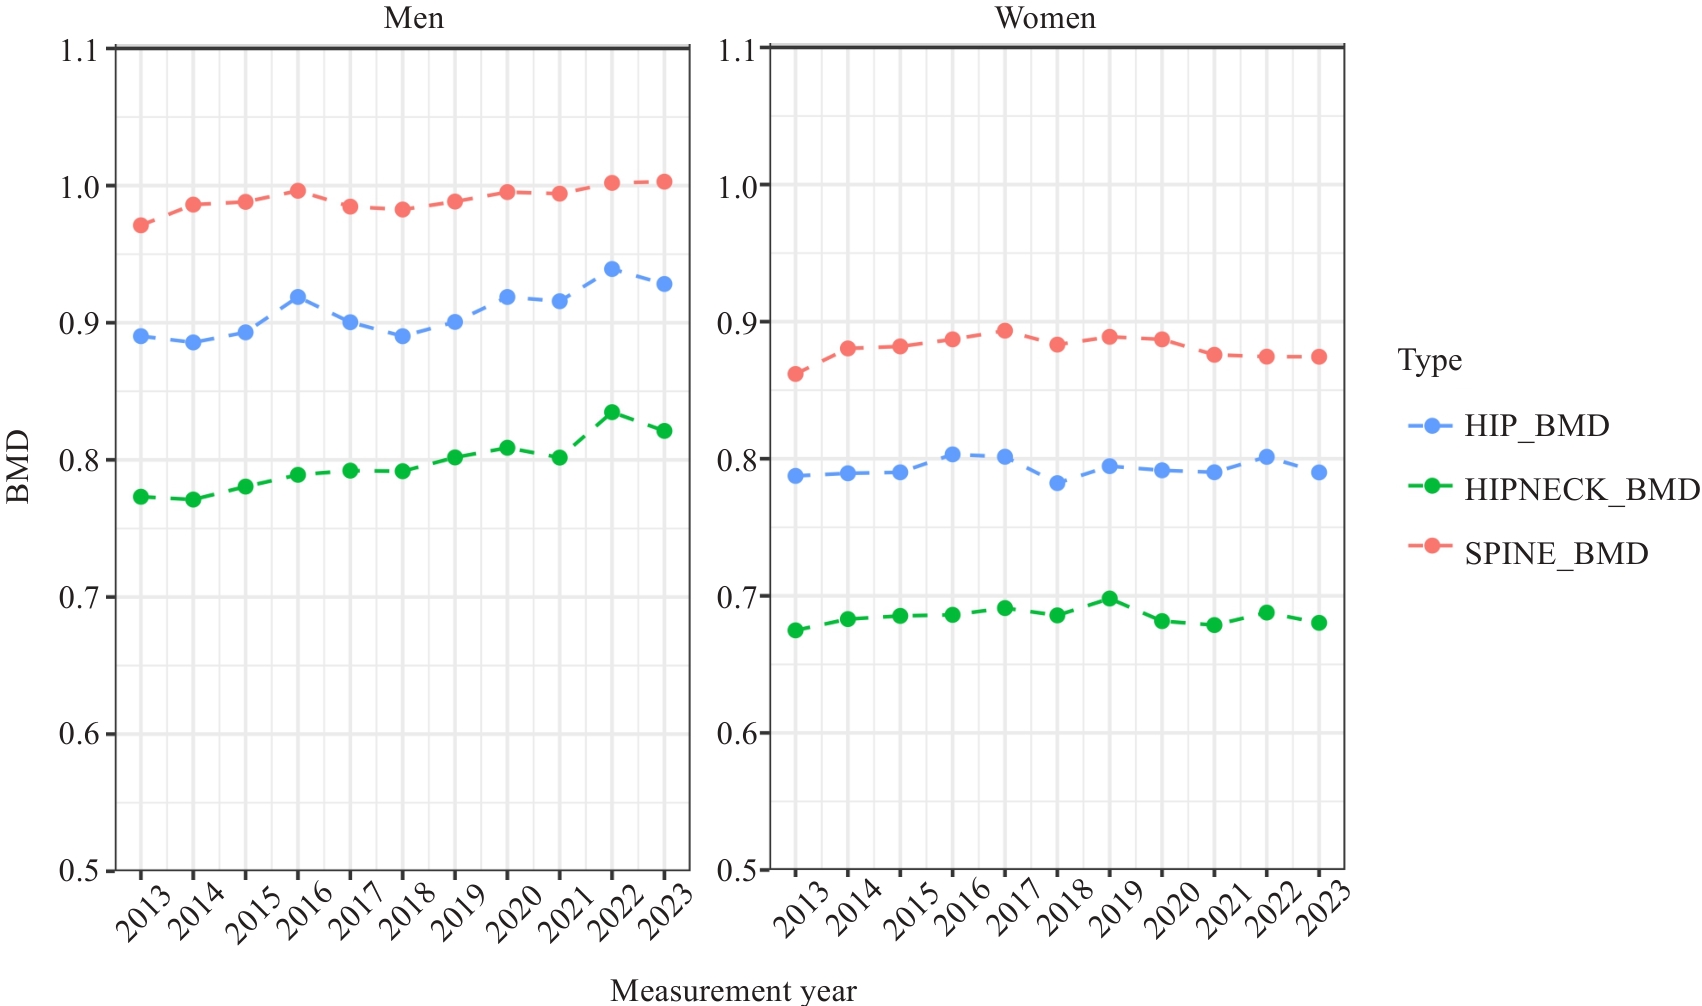
图3 不同部位BMD随测量年份的分布情况
Fig.3 BMD values across the year of measurements.
| BMD | 2013 | 2014 | 2015 | 2016 | 2017 | 2018 | 2019 | 2020 | 2021 | 2022 | 2023 |
|---|---|---|---|---|---|---|---|---|---|---|---|
| n | 2633 | 4041 | 3018 | 3073 | 2817 | 2715 | 2503 | 1102 | 3488 | 3048 | 2161 |
Lumbar spine 1-4 BMD(g/cm2) | 0.89±0.16 | 0.92±0.16 | 0.92±0.16 | 0.93±0.16 | 0.93±0.16 | 0.92±0.17 | 0.93±0.17 | 0.93±0.16 | 0.93±0.17 | 0.93±0.17 | 0.93±0.17 |
Total femur BMD(g/cm2) | 0.82±0.14 | 0.82±0.14 | 0.83±0.14 | 0.85±0.15 | 0.84±0.15 | 0.82±0.15 | 0.83±0.15 | 0.84±0.15 | 0.84±0.15 | 0.86±0.15 | 0.85±0.15 |
Femoral neck BMD(g/cm2) | 0.70±0.13 | 0.71±0.13 | 0.72±0.14 | 0.73±0.14 | 0.73±0.14 | 0.73±0.14 | 0.74±0.14 | 0.73±0.15 | 0.73±0.15 | 0.75±0.16 | 0.74±0.15 |
表7 不同部位BMD岁测量年份的分布情况
Tab.7 BMD values across the year of measurement (Mean±SD)
| BMD | 2013 | 2014 | 2015 | 2016 | 2017 | 2018 | 2019 | 2020 | 2021 | 2022 | 2023 |
|---|---|---|---|---|---|---|---|---|---|---|---|
| n | 2633 | 4041 | 3018 | 3073 | 2817 | 2715 | 2503 | 1102 | 3488 | 3048 | 2161 |
Lumbar spine 1-4 BMD(g/cm2) | 0.89±0.16 | 0.92±0.16 | 0.92±0.16 | 0.93±0.16 | 0.93±0.16 | 0.92±0.17 | 0.93±0.17 | 0.93±0.16 | 0.93±0.17 | 0.93±0.17 | 0.93±0.17 |
Total femur BMD(g/cm2) | 0.82±0.14 | 0.82±0.14 | 0.83±0.14 | 0.85±0.15 | 0.84±0.15 | 0.82±0.15 | 0.83±0.15 | 0.84±0.15 | 0.84±0.15 | 0.86±0.15 | 0.85±0.15 |
Femoral neck BMD(g/cm2) | 0.70±0.13 | 0.71±0.13 | 0.72±0.14 | 0.73±0.14 | 0.73±0.14 | 0.73±0.14 | 0.74±0.14 | 0.73±0.15 | 0.73±0.15 | 0.75±0.16 | 0.74±0.15 |
| Variables | Lumbar spine 1-4 | Femoral neck | Total femur | |||
|---|---|---|---|---|---|---|
| Age group (year) | BMD value | Age group (year) | BMD value | Age group (year) | BMD value | |
| Men | 25-29 | 1.00±0.12 | 20-24 | 0.94±0.14 | 20-24 | 0.99±0.13 |
| Women | 40-44 | 0.99±0.12 | 40-44 | 0.79±0.11 | 20-24 | 0.88±0.11 |
| P | 0.022 | <0.001 | <0.001 | |||
表8 年龄分层的峰值BMD值
Tab.8 The peak BMD values among all the age groups
| Variables | Lumbar spine 1-4 | Femoral neck | Total femur | |||
|---|---|---|---|---|---|---|
| Age group (year) | BMD value | Age group (year) | BMD value | Age group (year) | BMD value | |
| Men | 25-29 | 1.00±0.12 | 20-24 | 0.94±0.14 | 20-24 | 0.99±0.13 |
| Women | 40-44 | 0.99±0.12 | 40-44 | 0.79±0.11 | 20-24 | 0.88±0.11 |
| P | 0.022 | <0.001 | <0.001 | |||
Year of Measure-ment | Prevalence of osteoporosis | Prevalence of osteopenia | ||||||||||
|---|---|---|---|---|---|---|---|---|---|---|---|---|
| Men | Women | All | Men | Women | All | |||||||
| n | % | n | % | n | % | n | % | n | % | n | % | |
| 2013 | 138 | 19.38% | 709 | 37.47% | 847 | 32.53% | 545 | 76.54% | 1570 | 82.98% | 2115 | 81.22% |
| 2014 | 222 | 17.24% | 886 | 32.83% | 1108 | 27.79% | 941 | 73.06% | 2158 | 79.96% | 3099 | 77.73% |
| 2015 | 159 | 15.88% | 640 | 32.54% | 799 | 26.92% | 717 | 71.63% | 1563 | 79.46% | 2280 | 76.82% |
| 2016 | 162 | 14.25% | 603 | 31.52% | 765 | 25.08% | 798 | 70.18% | 1520 | 79.46% | 2318 | 76.00% |
| 2017 | 172 | 15.33% | 523 | 31.19% | 695 | 24.83% | 792 | 70.59% | 1300 | 77.52% | 2092 | 74.74% |
| 2018 | 161 | 16.16% | 560 | 32.88% | 721 | 26.71% | 715 | 71.79% | 1358 | 79.74% | 2073 | 76.81% |
| 2019 | 156 | 16.58% | 481 | 30.93% | 637 | 25.52% | 642 | 68.23% | 1198 | 77.04% | 1840 | 73.72% |
| 2020 | 70 | 17.11% | 210 | 30.48% | 280 | 25.50% | 271 | 66.26% | 549 | 79.68% | 820 | 74.68% |
| 2021 | 209 | 14.76% | 701 | 34.50% | 910 | 26.39% | 980 | 69.21% | 1643 | 80.86% | 2623 | 76.07% |
| 2022 | 149 | 12.42% | 638 | 34.86% | 787 | 25.97% | 755 | 62.92% | 1445 | 78.96% | 2200 | 72.61% |
| 2023 | 119 | 13.16% | 443 | 35.50% | 562 | 26.12% | 583 | 64.49% | 1006 | 80.61% | 1589 | 73.84% |
表9 不同年份不同性别骨质疏松和骨量低下的患病情况
Tab.9 Prevalence of osteoporosis and osteopenia across the year of measurement
Year of Measure-ment | Prevalence of osteoporosis | Prevalence of osteopenia | ||||||||||
|---|---|---|---|---|---|---|---|---|---|---|---|---|
| Men | Women | All | Men | Women | All | |||||||
| n | % | n | % | n | % | n | % | n | % | n | % | |
| 2013 | 138 | 19.38% | 709 | 37.47% | 847 | 32.53% | 545 | 76.54% | 1570 | 82.98% | 2115 | 81.22% |
| 2014 | 222 | 17.24% | 886 | 32.83% | 1108 | 27.79% | 941 | 73.06% | 2158 | 79.96% | 3099 | 77.73% |
| 2015 | 159 | 15.88% | 640 | 32.54% | 799 | 26.92% | 717 | 71.63% | 1563 | 79.46% | 2280 | 76.82% |
| 2016 | 162 | 14.25% | 603 | 31.52% | 765 | 25.08% | 798 | 70.18% | 1520 | 79.46% | 2318 | 76.00% |
| 2017 | 172 | 15.33% | 523 | 31.19% | 695 | 24.83% | 792 | 70.59% | 1300 | 77.52% | 2092 | 74.74% |
| 2018 | 161 | 16.16% | 560 | 32.88% | 721 | 26.71% | 715 | 71.79% | 1358 | 79.74% | 2073 | 76.81% |
| 2019 | 156 | 16.58% | 481 | 30.93% | 637 | 25.52% | 642 | 68.23% | 1198 | 77.04% | 1840 | 73.72% |
| 2020 | 70 | 17.11% | 210 | 30.48% | 280 | 25.50% | 271 | 66.26% | 549 | 79.68% | 820 | 74.68% |
| 2021 | 209 | 14.76% | 701 | 34.50% | 910 | 26.39% | 980 | 69.21% | 1643 | 80.86% | 2623 | 76.07% |
| 2022 | 149 | 12.42% | 638 | 34.86% | 787 | 25.97% | 755 | 62.92% | 1445 | 78.96% | 2200 | 72.61% |
| 2023 | 119 | 13.16% | 443 | 35.50% | 562 | 26.12% | 583 | 64.49% | 1006 | 80.61% | 1589 | 73.84% |
| 1 | Alejandro P, Constantinescu F. A review of osteoporosis in the older adult[J]. Rheum Dis Clin N Am, 2018, 44(3): 437-51. |
| 2 | Willers C, Norton N, Harvey NC, et al. Osteoporosis in Europe: a compendium of country-specific reports[J]. Arch Osteoporos, 2022, 17(1): 23. |
| 3 | Chen ZN, Wen Y, Qiu ML, et al. The pattern and trends of disease burden due to low bone mineral density from 1990 to 2019 in China: findings from the Global Burden of Disease Study 2019[J]. Arch Osteoporos, 2022, 17(1): 39. |
| 4 | Dong YM, Kang HL, Peng RP, et al. Global, regional, and national burden of low bone mineral density from 1990 to 2019: results from the global burden of disease study 2019[J]. Front Endocrinol, 2022, 13: 870905. |
| 5 | Fuggle NR, Beaudart C, Bruyère O, et al. Evidence-Based Guideline for the management of osteoporosis in men[J]. Nat Rev Rheumatol, 2024, 20(4): 241-51. |
| 6 | Ensrud KE, Crandall CJ. Osteoporosis[J]. Ann Intern Med, 2024, 177(1): ITC1-ITC16. |
| 7 | Wáng YXJ. Estimation of osteoporosis prevalence among a population is reasonable only after the concerned reference bone mineral density database and cutpoint T-score have been validated[J]. Osteoporos Int, 2023, 34(2): 417-8. |
| 8 | 王 亮, 马远征, 张 妍, 等. 北京地区9103例体检人群骨密度流行病学调查研究[J]. 中国骨质疏松杂志, 2014, 20(8): 952-5. |
| 9 | 罗 薇, 刘 珍, 刘海丹, 等. 北京地区3859名体检人群骨密度调查及骨量异常患病率分析[J]. 中国骨质疏松杂志, 2020, 26(5): 719-22. |
| 10 | 张娅惠, 薛秋艳, 谷 洁, 等. 北京海淀部分人群骨质疏松流行病学及相关危险因素研究[J]. 现代生物医学进展, 2020, 20(13): 2545-50. |
| 11 | 刘 宁, 张国强, 兰雅智. 北京某社区60岁以上老年人群骨质疏松症发病特点及影响因素分析[J]. 中国骨与关节损伤杂志, 2022, 37(12): 1327-30. |
| 12 | Cui P, Wang W, Wang Z, et al. The association between body mass index and bone mineral density in older adults: a cross-sectional study of community population in Beijing[J]. BMC Musculoskelet Disord, 2024, 25(1): 655. |
| 13 | 姚立彬, 张林华, 李百战, 等. 邢台山区老年人骨质疏松症流行病学调查及危险因素分析[J]. 解放军预防医学杂志, 2020, 38(2): 58-60. |
| 14 | Canbek U, Rosberg DBH, Rosberg HE, et al. The effect of age, BMI, and bone mineral density on the various lumbar vertebral measurements in females[J]. Surg Radiol Anat, 2021, 43(1): 101-8. |
| 15 | Zeng Q, Li N, Wang QQ, et al. The prevalence of osteoporosis in China, a nationwide, multicenter DXA survey[J]. J Bone Miner Res, 2019, 34(10): 1789-97. |
| 16 | Cherukuri L, Kinninger A, Birudaraju D, et al. Effect of body mass index on bone mineral density is age-specific[J]. Nutr Metab Cardiovasc Dis, 2021, 31(6): 1767-73. |
| 17 | Eghbali P, Becce F, Goetti P, et al. Age- and sex-specific normative values of bone mineral density in the adult glenoid[J]. J Orthop Res, 2023, 41(2): 263-70. |
| 18 | 中华人民共和国国家卫生健康委员会医政司. 肥胖症中国诊疗指南(2024年版) [J/OL]. 协和医学杂志, 1-60[2025-01-09]. |
| 19 | 中华医学会骨质疏松和骨矿盐疾病分会. 原发性骨质疏松症诊疗指南(2022)[J]. 中华骨质疏松和骨矿盐疾病杂志, 2022, 15(6): 573-611. |
| 20 | Tang YC, Peng B, Liu JM, et al. Systemic immune-inflammation index and bone mineral density in postmenopausal women: a cross-sectional study of the national health and nutrition examination survey (NHANES) 2007-2018[J]. Front Immunol, 2022, 13: 975400. |
| 21 | Kojima A, Kamiya K, Kajita E, et al. Association between dairy product intake and risk of osteoporotic fractures in postmenopausal Japanese women: secondary analysis of 15-year follow-up data from the Japanese population-based osteoporosis (JPOS) cohort study[J]. J Nutr Health Aging, 2023, 27(3): 228-37. |
| 22 | Wang LH, Yu W, Yin XJ, et al. Prevalence of osteoporosis and fracture in China: the China osteoporosis prevalence study[J]. JAMA Netw Open, 2021, 4(8): e2121106. |
| 23 | Schultz K, Wolf JM. Emerging technologies in osteoporosis diagnosis[J]. J Hand Surg Am, 2019, 44(3): 240-3. |
| 24 | Ichchou L, Allali F, Rostom S, et al. Relationship between spine osteoarthritis, bone mineral density and bone turn over markers in post menopausal women[J]. BMC Womens Health, 2010, 10: 25. |
| 25 | Yoshimura N, Iidaka T, Horii C, et al. Trends in osteoporosis prevalence over a 10-year period in Japan: the ROAD study 2005-2015[J]. J Bone Miner Metab, 2022, 40(5): 829-38. |
| 26 | Rathnayake H, Lekamwasam S, Wickramatilake C, et al. Trabecular bone score and bone mineral density reference data for women aged 20-70 years and the effect of local reference data on the prevalence of postmenopausal osteoporosis: a cross-sectional study from Sri Lanka [J]. Arch Osteoporos, 2019, 14(1): 91. |
| 27 | Wáng YXJ, Chan WP, Yu W, et al. Quantitative CT lumbar spine BMD cutpoint value for classifying osteoporosis among older Chinese men can be the same as that of older Chinese women, both much lower than the value for Caucasians[J]. Skeletal Radiol, 2025, 54(2): 193-8. |
| 28 | Lloyd JT, Alley DE, Hawkes WG, et al. Body mass index is positively associated with bone mineral density in US older adults[J]. Arch Osteoporos, 2014, 9: 175. |
| 29 | Glinkowski WM, Narloch J. Bone Density at the Entry Point Correlates With the Trabecular Bone of the Thoracolumbar Vertebral Bodies-Quantitative Computed Tomography Study[J]. Clin Densitom, 2019, 22(3): 367-73. |
| 30 | Ng AC, Joseph Melton L 3rd, Atkinson EJ, et al. Relationship of adiposity to bone volumetric density and microstructure in men and women across the adult lifespan[J]. Bone, 2013, 55(1): 119-25. |
| 31 | Wang LJ, You XL, Zhang LL, et al. Mechanical regulation of bone remodeling[J]. Bone Res, 2022, 10(1): 16. |
| 32 | Farley A, Gnyubkin V, Vanden-Bossche A, et al. Unloading-induced cortical bone loss is exacerbated by low-dose irradiation during a simulated deep space exploration mission[J]. Calcif Tissue Int, 2020, 107(2): 170-9. |
| 33 | Agostini F, de Sire A, Sveva V, et al. Rehabilitative good clinical practice in the treatment of osteoporosis: a comprehensive review of clinical evidences[J]. Disabil Rehabil, 2024: 1-15. |
| 34 | Izquierdo M, de Souto Barreto P, Arai H, et al. Global consensus on optimal exercise recommendations for enhancing healthy longevity in older adults (ICFSR)[J]. J Nutr Health Aging, 2025, 29(1): 100401. |
| 35 | Chen P, Li ZZ, Hu YH. Prevalence of osteoporosis in China: a meta-analysis and systematic review[J]. BMC Public Health, 2016, 16(1): 1039. |
| 36 | Qian Y, Mao JC. The association between night shift work and osteoporosis risk in adults: a cross-sectional analysis using NHANES[J]. Heliyon, 2024, 10(6): e28240. |
| 37 | Rubæk M, Hitz MF, Holmberg T, et al. Effectiveness of patient education for patients with osteoporosis: a systematic review[J]. Osteoporos Int, 2022, 33(5): 959-77. |
| 38 | Hejazi K, Askari R, Hofmeister M. Effects of physical exercise on bone mineral density in older postmenopausal women: a systematic review and meta-analysis of randomized controlled trials[J]. Arch Osteoporos, 2022, 17(1): 102. |
| 39 | 黄宏兴, 晁爱军, 程 群.中国健康促进基金会医疗机构骨质疏松专科建设专家共识委员会.医疗机构骨质疏松专科建设专家共识[J].中国骨质疏松杂志, 2024, 30(6): 781-9. |
| 40 | 刘功稳, 朱柯雨, 陆政峰.骨质疏松症和骨质疏松性骨折防治的现状及挑战[J]. 中华骨质疏松和骨矿盐疾病杂志, 2024, 17(5): 409-18. |
| [1] | 董振翔, 郭义昊, 刘蔷, 张益哲, 丘倩怡, 张晓东, 冯衍秋. 基于双极读出梯度的单重复时间腰椎定量磁化率成像[J]. 南方医科大学学报, 2025, 45(6): 1336-1342. |
| [2] | 陈远程, 吴文, 许翎, 邓海鸥, 王瑞雪, 黄倩雯, 禤立平, 陈雪莹, 智喜梅. 地舒单抗治疗的原发性骨质疏松症患者血钙及骨代谢标志物的动态变化[J]. 南方医科大学学报, 2025, 45(4): 760-764. |
| [3] | 罗彩珠, 陈金香, 张 群, 于学钊, 张书勤. 聚乳酸/羟基磷灰石/磷钙锌石复合支架促进大鼠骨质疏松性骨缺损愈合[J]. 南方医科大学学报, 2024, 44(2): 370-380. |
| [4] | 陈梓锋, 李胜发, 张祐鸣, 杨婉雯, 王 婷. 脂质运载蛋白2自限性抑制间充质干细胞的成骨细胞分化[J]. 南方医科大学学报, 2023, 43(8): 1339-1344. |
| [5] | 吴秀华, 范应静, 叶永浓, 李 萍, 朱青安, 陈泽森, 李 博, 王 文, 郑 磊. 生酮饮食导致小鼠骨质疏松的转录组学[J]. 南方医科大学学报, 2023, 43(8): 1440-1446. |
| [6] | 张佳豪, 杨若男, 贺舒凝, 袁 萍. 2016~2020年中国猩红热发病的空间聚集性分析[J]. 南方医科大学学报, 2023, 43(4): 644-648. |
| [7] | 阮红良, 佘冬梅, 孙绍裘. 六味地黄丸减轻绝经后骨质疏松症及疲劳的作用机制:基于抑制表观调控分子BRD4通路[J]. 南方医科大学学报, 2023, 43(12): 1998-2005. |
| [8] | 金晓丽, 许 嘉, 陈煊威, 陈 瑾, 黄 慧, 张 婷, 任 军, 许 健. 冬凌草甲素逆转硫代乙酰胺对破骨和成骨细胞分化的机制研究[J]. 南方医科大学学报, 2023, 43(11): 1892-1900. |
| [9] | 侯 甜, 秦雅芝, 张 妍, 温国琛, 戚孟春, 董 伟. 特立帕肽通过cAMP/PKA/CREB信号通路调控高糖微环境下的成骨细胞分化[J]. 南方医科大学学报, 2023, 43(1): 39-45. |
| [10] | 冯苑仪, 羊冬梅, 智喜梅, 邓海鸥, 张伟杰, 王瑞雪, 吴 文. 活性氧与铁死亡通路相互作用在丙酮醛引起的小鼠胚胎成骨细胞损伤中起重要作用[J]. 南方医科大学学报, 2022, 42(1): 108-115. |
| [11] | 成东亮, 冯红梅, 文 戈, 刘健萍, 洪居陆, 高明勇. 基于磁共振脂肪定量技术IDEAL-IQ的列线图模型在预测早期骨量丢失中的价值[J]. 南方医科大学学报, 2021, 41(11): 1707-1711. |
| [12] | 章 坤, 时哲敏, 任 怡, 韩晓辉, 王敬朝, 洪 伟. 长链非编码RNA Kcnq1ot1促进成骨细胞分化和抑制破骨细胞分化[J]. 南方医科大学学报, 2021, 41(1): 31-38. |
| [13] | 李明翰,何友华,童国军,杨德鸿. 连续应用特立帕肽对正常和去势小鼠骨代谢的影响[J]. 南方医科大学学报, 2019, 39(09): 1045-. |
| [14] | 金健,金大地. 利塞膦酸钠抑制大鼠骨髓内脂肪细胞分化及脂肪细胞核因子κB受体活化因子配体蛋白的表达[J]. 南方医科大学学报, 2019, 39(08): 987-. |
| [15] | 周雪娟,夏颖,赵岩岩,古文清,肖潇,白晓春,刘俊,李明. 雌二醇显著上调骨质疏松大鼠成骨细胞内抗氧化酶的表达[J]. 南方医科大学学报, 2018, 38(04): 402-. |
| 阅读次数 | ||||||
|
全文 |
|
|||||
|
摘要 |
|
|||||