
南方医科大学学报 ›› 2026, Vol. 46 ›› Issue (9): 2091-2100.doi: 10.12122/j.issn.1673-4254.2026.09.09
• • 上一篇
陈翠妍1,2( ), 张文娴1,2, 蔡依琳1,2, 欧阳媚1,2, 梁叶2,3, 梁铭标2, 梁会营1,2()
收稿日期:2026-02-13
出版日期:2026-09-20
发布日期:2026-09-30
通讯作者:
梁会营
E-mail:17675629838@163.com;lianghuiying@gdph.org.cn
作者简介:陈翠妍,在读硕士研究生,E-mail: 17675629838@163.com
基金资助:
Cuiyan CHEN1,2(), Wenxian ZHANG1,2, Yilin CAI1,2, Mei OUYANG1,2, Ye LIANG2,3, Mingbiao LIANG2, Huiying LIANG1,2()
Received:2026-02-13
Online:2026-09-20
Published:2026-09-30
Contact:
Huiying LIANG
E-mail:17675629838@163.com;lianghuiying@gdph.org.cn
摘要:
目的 利用常规临床资料,构建接受度强、普适性广的肺功能智能评估模型,为老年患者肺功能异常的早期识别与诊疗提供参考。 方法 选取2020年9月1日~2024年12月31日于广东省人民医院完成肺功能检查(PFT)的7720例老年患者,整合临床资料,经单因素分析及LASSO回归筛选变量,按8∶2比例随机分为训练集(n=6176)和测试集(n=1544),分别构建线性回归、随机森林、极端梯度提升(XGBoost)、梯度提升机及支持向量回归模型以预测用力肺活量(FVC)和1秒用力呼气量(FEV1),采用Pearson相关系数(r)、组内相关系数(ICC)等评估性能,确定最优模型。结合沙普利加性解释方法分析特征贡献,并评估模型对呼吸高危人群的分类性能。 结果 XGBoost为最优模型,FVC和FEV1的r值分别为0.733、0.711,ICC为0.694、0.668。性别与年龄为核心预测变量,男性与低龄对肺功能指标呈正向效应,女性与高龄呈负向效应。FVC%、FEV1%最佳截断值分别为82.93%、85.46%,AUC为0.700、0.706。 结论 本研究构建的模型简便易行、适用性强,可辅助老年患者肺功能评估,具备良好的临床应用前景。
陈翠妍, 张文娴, 蔡依琳, 欧阳媚, 梁叶, 梁铭标, 梁会营. 基于机器学习算法构建老年患者肺功能智能评估模型[J]. 南方医科大学学报, 2026, 46(9): 2091-2100.
Cuiyan CHEN, Wenxian ZHANG, Yilin CAI, Mei OUYANG, Ye LIANG, Mingbiao LIANG, Huiying LIANG. Development of a machine learning-based model for assessing pulmonary function in elderly patients[J]. Journal of Southern Medical University, 2026, 46(9): 2091-2100.
| Variable | Missing (%) | Variable | Missing (%) |
|---|---|---|---|
| FT4 | 47.14 (deleted) | Number of hospitalizations | 0.99 |
| D-Dimer | 37.98 (deleted) | TT | 0.69 |
| CK | 37.11 (deleted) | APTT | 0.69 |
| Mg | 35.85 (deleted) | FIB | 0.69 |
| Drinking | 27.82 | K | 0.33 |
| Smoking | 27.72 | Glu | 0.28 |
| PT | 18.85 | RDW-SD | 0.27 |
| Cl | 18.10 | NEUT% | 0.15 |
| Ca | 18.10 | EOS% | 0.15 |
| Na | 18.10 | RDW-CV | 0.15 |
| LDH | 17.75 | RBC | 0.15 |
| HCT | 17.73 | Marriage | 0.14 |
| HGB | 17.73 | BMI | 0.05 |
| P-LCR | 12.13 | ||
| FT4: Free thyroxine; CK: Creatine kinase; PT: Prothrombin time; LDH: Lactate dehydrogenase; HCT: Hematocrit; HGB: Hemoglobin; P-LCR: Platelet-large cell ratio; TT: Thrombin time; APTT: Activated partial thromboplastin time; FIB: Fibrinogen; Glu: Glucose; RDW-SD: Red cell distribution width-standard deviation; PLT: Platelets; NEUT%: Neutrophil percentage; EOS%: Eosinophil percentage; RDW-CV: Red cell distribution width-coefficient of variation; RBC: Red blood cell count; BMI: Body mass index. | |||
表1 变量缺失情况统计
Tab.1 Statistics of missing values of the variables
| Variable | Missing (%) | Variable | Missing (%) |
|---|---|---|---|
| FT4 | 47.14 (deleted) | Number of hospitalizations | 0.99 |
| D-Dimer | 37.98 (deleted) | TT | 0.69 |
| CK | 37.11 (deleted) | APTT | 0.69 |
| Mg | 35.85 (deleted) | FIB | 0.69 |
| Drinking | 27.82 | K | 0.33 |
| Smoking | 27.72 | Glu | 0.28 |
| PT | 18.85 | RDW-SD | 0.27 |
| Cl | 18.10 | NEUT% | 0.15 |
| Ca | 18.10 | EOS% | 0.15 |
| Na | 18.10 | RDW-CV | 0.15 |
| LDH | 17.75 | RBC | 0.15 |
| HCT | 17.73 | Marriage | 0.14 |
| HGB | 17.73 | BMI | 0.05 |
| P-LCR | 12.13 | ||
| FT4: Free thyroxine; CK: Creatine kinase; PT: Prothrombin time; LDH: Lactate dehydrogenase; HCT: Hematocrit; HGB: Hemoglobin; P-LCR: Platelet-large cell ratio; TT: Thrombin time; APTT: Activated partial thromboplastin time; FIB: Fibrinogen; Glu: Glucose; RDW-SD: Red cell distribution width-standard deviation; PLT: Platelets; NEUT%: Neutrophil percentage; EOS%: Eosinophil percentage; RDW-CV: Red cell distribution width-coefficient of variation; RBC: Red blood cell count; BMI: Body mass index. | |||
| Variable | Overall | Q1 | Q2 | Q3 | Q4 | P |
|---|---|---|---|---|---|---|
| Sample (n) | 7720 | 1968 | 1911 | 1937 | 1904 | |
| FVC (L) | 2.45±0.69 | 1.6±0.28 | 2.19±0.13 | 2.66±0.15 | 3.36±0.34 | <0.001 |
| Age (year) | 68.56±6.27 | 71.25±6.83 | 68.68±6.20 | 68.01±5.76 | 66.22±5.03 | <0.001 |
| Gender (men) | 4197 (54.4%) | 354 (18.0%) | 688 (36.0%) | 1339 (69.1%) | 1816 (95.4%) | <0.001 |
| BMI (kg/m2) | 25.09±7.38 | 25.1±7.63 | 25.17±7.65 | 25.04±7.15 | 25.04±7.09 | 0.94 |
| Smoking | 1762 (22.8%) | 171 (8.7%) | 324 (17%) | 546 (28.2%) | 721 (37.9%) | <0.001 |
| Drinking | 551 (7.1%) | 46 (2.3%) | 97 (5.1%) | 158 (8.2%) | 250 (13.1%) | <0.001 |
| Marital status | <0.001 | |||||
| Never married | 43 (0.6%) | 15 (0.8%) | 13 (0.7%) | 8 (0.4%) | 7 (0.4%) | |
| Married | 7127 (92.3%) | 1708 (86.8%) | 1751 (91.6%) | 1829 (94.4%) | 1839 (96.6%) | |
| Divorced/seperated/widowed | 550 (7.1%) | 245 (12.4%) | 147 (7.7%) | 100 (5.2%) | 58 (3.0%) | |
| Number of hospitalizations | 1.81±2.37 | 1.81±2.22 | 1.73±1.98 | 1.89±2.93 | 1.81±2.22 | 0.22 |
| Disease of respiratory system | 626( 8.1%) | 157 (8.0%) | 135 (7.1%) | 152 (7.8%) | 182 (9.6%) | 0.04 |
| Hypertention | 2559 (33.1%) | 731 (37.1%) | 622 (32.5%) | 644 (33.2%) | 562 (29.5%) | <0.001 |
| Diabetes | 1189 (15.4%) | 339 (17.2%) | 286 (15.0%) | 301 (15.5%) | 263 (13.8%) | 0.03 |
| Stroke | 392 (5.1%) | 137 (7.0%) | 86 (4.5%) | 100 (5.2%) | 69 (3.6%) | <0.001 |
| Pulmonary arterial hypertension | 271 (3.5%) | 158 (8.0%) | 57 (3.0%) | 35 (1.8%) | 21 (1.1%) | <0.001 |
| CAD | 837 (10.8%) | 236 (12.0%) | 199 (10.4%) | 209 (10.8%) | 193 (10.1%) | 0.26 |
| NEUT (%) | 70.47±8.52 | 71.2±9.04 | 70.84±8.1 | 70.08±8.64 | 69.73±8.16 | <0.001 |
| LDH (U/L) | 243.67±412.54 | 269.88±303.08 | 237.51±249.84 | 236.37±430.66 | 230.19±585.7 | 0.01 |
| PT (s) | 14.32±2.55 | 15.11±3.56 | 14.16±2.25 | 14.04±1.97 | 13.96±1.85 | <0.001 |
| TT (s) | 18.6±8.47 | 19.93±11.69 | 18.29±7.56 | 18.31±7.32 | 17.83±5.95 | <0.001 |
| EOS (%) | 2.1±2.03 | 1.92±1.93 | 1.92±1.83 | 2.24±2.34 | 2.33±1.94 | <0.001 |
| P-LCR (%) | 27.64±24.86 | 28.19±9.05 | 28.44±47.8 | 26.95±8.08 | 26.96±7.81 | 0.12 |
| Cl(mmol/L) | 105.09±2.98 | 104.92±3.21 | 105.29±3.01 | 105.09±2.82 | 105.05±2.86 | 0.002 |
| APTT (s) | 38.9±7.35 | 40.27±9.51 | 38.3±6.85 | 38.55±6.39 | 38.43±5.87 | <0.001 |
| RDW-CV | 0.14±0.02 | 0.14±0.03 | 0.14±0.02 | 0.14±0.02 | 0.14±0.02 | <0.001 |
| RDW-SD (fl) | 44.9±5.62 | 45.68±6.18 | 44.57±5.58 | 44.76±5.25 | 44.58±5.33 | <0.001 |
| HCT (%) | 36.27±5.05 | 34.55±5.00 | 35.78±4.76 | 36.79±4.92 | 38.01±4.86 | <0.001 |
| RBC (×1012/L) | 4.03±0.64 | 3.87±0.64 | 3.99±0.62 | 4.08±0.64 | 4.19±0.63 | <0.001 |
| Glu (mmol/L) | 6.3±1.85 | 6.54±2.02 | 6.33±1.82 | 6.22±1.81 | 6.08±1.69 | <0.001 |
| PLT (×109/L) | 212.03±71.58 | 212.43±75.93 | 215.59±73.07 | 212.8±70.48 | 207.24±66.14 | 0.004 |
| FIB (g/L) | 3.74±1.00 | 3.87±0.99 | 3.75±0.99 | 3.73±1.00 | 3.6±0.98 | <0.001 |
| HGB (g/L) | 119.59±17.28 | 113.18±16.87 | 117.71±16.14 | 121.49±16.8 | 126.17±16.57 | <0.001 |
| Ca (mmol/L) | 2.23±0.12 | 2.23±0.12 | 2.23±0.12 | 2.23±0.11 | 2.22±0.12 | 0.04 |
| Na (mmol/L) | 139.21±3.19 | 139.36±3.25 | 139.34±3.36 | 139.17±2.95 | 138.97±3.15 | <0.001 |
| K (mmol/L) | 3.85±0.46 | 3.87±0.40 | 3.83±0.44 | 3.83±0.39 | 3.86±0.59 | 0.007 |
| FVC: Forced vital capacity; BMI: Body mass index; NEUT%: Neutrophil percentage; LDH: Lactate dehydrogenase; PT: Prothrombin time; TT: Thrombin time; EOS%: Eosimophil; P-LCR: Platelet-large cell ratio; Cl: Chloride; APTT: Activated partialthromboplastin time; RDW-CV: Red cell distribution width-coefficient of variation; RDW-SD: Red cell distribution width-standard deviation; HCT: Hematocrit; RBC: Red blood cell count; Glu: Glucose; PLT: Platelets; FIB: Fibrinogen; HGB: Hemoglobin; Ca: Calcium; Na: Sodium; K: Kalium | ||||||
表2 根据FVC四分位数划分的基线特征
Tab.2 Baseline characteristics of the participants stratified by the quartiles of forced vital capacity (FVC)
| Variable | Overall | Q1 | Q2 | Q3 | Q4 | P |
|---|---|---|---|---|---|---|
| Sample (n) | 7720 | 1968 | 1911 | 1937 | 1904 | |
| FVC (L) | 2.45±0.69 | 1.6±0.28 | 2.19±0.13 | 2.66±0.15 | 3.36±0.34 | <0.001 |
| Age (year) | 68.56±6.27 | 71.25±6.83 | 68.68±6.20 | 68.01±5.76 | 66.22±5.03 | <0.001 |
| Gender (men) | 4197 (54.4%) | 354 (18.0%) | 688 (36.0%) | 1339 (69.1%) | 1816 (95.4%) | <0.001 |
| BMI (kg/m2) | 25.09±7.38 | 25.1±7.63 | 25.17±7.65 | 25.04±7.15 | 25.04±7.09 | 0.94 |
| Smoking | 1762 (22.8%) | 171 (8.7%) | 324 (17%) | 546 (28.2%) | 721 (37.9%) | <0.001 |
| Drinking | 551 (7.1%) | 46 (2.3%) | 97 (5.1%) | 158 (8.2%) | 250 (13.1%) | <0.001 |
| Marital status | <0.001 | |||||
| Never married | 43 (0.6%) | 15 (0.8%) | 13 (0.7%) | 8 (0.4%) | 7 (0.4%) | |
| Married | 7127 (92.3%) | 1708 (86.8%) | 1751 (91.6%) | 1829 (94.4%) | 1839 (96.6%) | |
| Divorced/seperated/widowed | 550 (7.1%) | 245 (12.4%) | 147 (7.7%) | 100 (5.2%) | 58 (3.0%) | |
| Number of hospitalizations | 1.81±2.37 | 1.81±2.22 | 1.73±1.98 | 1.89±2.93 | 1.81±2.22 | 0.22 |
| Disease of respiratory system | 626( 8.1%) | 157 (8.0%) | 135 (7.1%) | 152 (7.8%) | 182 (9.6%) | 0.04 |
| Hypertention | 2559 (33.1%) | 731 (37.1%) | 622 (32.5%) | 644 (33.2%) | 562 (29.5%) | <0.001 |
| Diabetes | 1189 (15.4%) | 339 (17.2%) | 286 (15.0%) | 301 (15.5%) | 263 (13.8%) | 0.03 |
| Stroke | 392 (5.1%) | 137 (7.0%) | 86 (4.5%) | 100 (5.2%) | 69 (3.6%) | <0.001 |
| Pulmonary arterial hypertension | 271 (3.5%) | 158 (8.0%) | 57 (3.0%) | 35 (1.8%) | 21 (1.1%) | <0.001 |
| CAD | 837 (10.8%) | 236 (12.0%) | 199 (10.4%) | 209 (10.8%) | 193 (10.1%) | 0.26 |
| NEUT (%) | 70.47±8.52 | 71.2±9.04 | 70.84±8.1 | 70.08±8.64 | 69.73±8.16 | <0.001 |
| LDH (U/L) | 243.67±412.54 | 269.88±303.08 | 237.51±249.84 | 236.37±430.66 | 230.19±585.7 | 0.01 |
| PT (s) | 14.32±2.55 | 15.11±3.56 | 14.16±2.25 | 14.04±1.97 | 13.96±1.85 | <0.001 |
| TT (s) | 18.6±8.47 | 19.93±11.69 | 18.29±7.56 | 18.31±7.32 | 17.83±5.95 | <0.001 |
| EOS (%) | 2.1±2.03 | 1.92±1.93 | 1.92±1.83 | 2.24±2.34 | 2.33±1.94 | <0.001 |
| P-LCR (%) | 27.64±24.86 | 28.19±9.05 | 28.44±47.8 | 26.95±8.08 | 26.96±7.81 | 0.12 |
| Cl(mmol/L) | 105.09±2.98 | 104.92±3.21 | 105.29±3.01 | 105.09±2.82 | 105.05±2.86 | 0.002 |
| APTT (s) | 38.9±7.35 | 40.27±9.51 | 38.3±6.85 | 38.55±6.39 | 38.43±5.87 | <0.001 |
| RDW-CV | 0.14±0.02 | 0.14±0.03 | 0.14±0.02 | 0.14±0.02 | 0.14±0.02 | <0.001 |
| RDW-SD (fl) | 44.9±5.62 | 45.68±6.18 | 44.57±5.58 | 44.76±5.25 | 44.58±5.33 | <0.001 |
| HCT (%) | 36.27±5.05 | 34.55±5.00 | 35.78±4.76 | 36.79±4.92 | 38.01±4.86 | <0.001 |
| RBC (×1012/L) | 4.03±0.64 | 3.87±0.64 | 3.99±0.62 | 4.08±0.64 | 4.19±0.63 | <0.001 |
| Glu (mmol/L) | 6.3±1.85 | 6.54±2.02 | 6.33±1.82 | 6.22±1.81 | 6.08±1.69 | <0.001 |
| PLT (×109/L) | 212.03±71.58 | 212.43±75.93 | 215.59±73.07 | 212.8±70.48 | 207.24±66.14 | 0.004 |
| FIB (g/L) | 3.74±1.00 | 3.87±0.99 | 3.75±0.99 | 3.73±1.00 | 3.6±0.98 | <0.001 |
| HGB (g/L) | 119.59±17.28 | 113.18±16.87 | 117.71±16.14 | 121.49±16.8 | 126.17±16.57 | <0.001 |
| Ca (mmol/L) | 2.23±0.12 | 2.23±0.12 | 2.23±0.12 | 2.23±0.11 | 2.22±0.12 | 0.04 |
| Na (mmol/L) | 139.21±3.19 | 139.36±3.25 | 139.34±3.36 | 139.17±2.95 | 138.97±3.15 | <0.001 |
| K (mmol/L) | 3.85±0.46 | 3.87±0.40 | 3.83±0.44 | 3.83±0.39 | 3.86±0.59 | 0.007 |
| FVC: Forced vital capacity; BMI: Body mass index; NEUT%: Neutrophil percentage; LDH: Lactate dehydrogenase; PT: Prothrombin time; TT: Thrombin time; EOS%: Eosimophil; P-LCR: Platelet-large cell ratio; Cl: Chloride; APTT: Activated partialthromboplastin time; RDW-CV: Red cell distribution width-coefficient of variation; RDW-SD: Red cell distribution width-standard deviation; HCT: Hematocrit; RBC: Red blood cell count; Glu: Glucose; PLT: Platelets; FIB: Fibrinogen; HGB: Hemoglobin; Ca: Calcium; Na: Sodium; K: Kalium | ||||||
| Variable | Overall | Q1 | Q2 | Q3 | Q4 | P |
|---|---|---|---|---|---|---|
| Sample | 7720 | 1971 | 1932 | 1904 | 1913 | |
| FEV1 (L) | 1.99±0.54 | 1.32±0.24 | 1.8±0.1 | 2.16±0.11 | 2.69±0.26 | <0.001 |
| Age (year) | 68.56±6.27 | 71.82±6.75 | 68.82±6.17 | 67.59±5.56 | 65.91±4.83 | <0.001 |
| Gender (men) | 4197 (54.4%) | 474(24%) | 728 (37.7%) | 1193 (62.7%) | 1802 (94.2%) | <0.001 |
| BMI (kg/m2) | 25.09±7.38 | 24.81±7.5 | 25.1±7.42 | 25.23±7.48 | 25.22±7.12 | 0.24 |
| Smoking | 1762 (22.8%) | 254 (12.9%) | 379(19.6%) | 462 (24.3%) | 667 (34.9%) | <0.001 |
| Drinking | 551 (7.1%) | 63 (3.2%) | 100 (5.2%) | 132 (6.9%) | 256 (13.4%) | <0.001 |
| Marital status | <0.001 | |||||
| Never married | 43 (0.6%) | 16 (0.8%) | 13 (0.7%) | 4 (0.2%) | 10 (0.5%) | |
| Married | 7127 (92.3%) | 1716 (87.1%) | 1759 (91%) | 1799 (94.5%) | 1853 (96.9%) | |
| Divorced/seperated/widowed | 550 (7.1%) | 239 (12.1%) | 160 (8.3%) | 101 (5.3%) | 50 (2.6%) | |
| Number of hospitalizations | 1.81±2.37 | 1.87±2.23 | 1.77±2.13 | 1.84±2.53 | 1.76±2.56 | 0.43 |
| Disease of respiratory system | 626 (8.1%) | 212 (10.8%) | 151 (7.8%) | 125 (6.6%) | 138 (7.2%) | <0.001 |
| Hypertention | 2559 (33.1%) | 713 (36.2%) | 645 (33.4%) | 621 (32.6%) | 580 (30.3%) | 0.002 |
| Diabetes | 1189 (15.4%) | 317 (16.1%) | 295( 15.3%) | 294 (15.4%) | 283 (14.8%) | 0.74 |
| Stroke | 392 (5.1%) | 132 (6.7%) | 98 (5.1%) | 98 (5.1%) | 64 (3.3%) | <0.001 |
| Pulmonary arterial hypertension | 271 (3.5%) | 150 (7.6%) | 67 (3.5%) | 30 (1.6%) | 24 (1.3%) | <0.001 |
| CAD | 837 (10.8%) | 238 (12.1%) | 205 (10.6%) | 200 (10.5%) | 194 (10.1%) | 0.22 |
| NEUT (%) | 70.47±8.52 | 71.11±9 | 70.74±8.48 | 70.26±8.39 | 69.73±8.1 | <0.001 |
| LDH(U/L) | 243.67±412.54 | 269.32±327.14 | 251.35±393.6 | 225.9±301.33 | 227.18±573.27 | 0.002 |
| PT (s) | 14.32±2.55 | 15.03±3.5 | 14.22±2.33 | 13.99±1.93 | 14.02±1.94 | <0.001 |
| TT (s) | 18.6±8.47 | 19.73±11.39 | 18.24±6.98 | 18.37±7.93 | 18.03±6.52 | <0.001 |
| EOS (%) | 2.1±2.03 | 2.05±2.04 | 1.95±2.2 | 2.11±1.88 | 2.3±1.96 | <0.001 |
| P-LCR (%) | 27.64±24.86 | 29.14±47.23 | 26.98±8.07 | 27.14±8.15 | 27.25±7.86 | 0.02 |
| Cl (mmol/L) | 105.09±2.98 | 104.84±3.2 | 105.25±3.04 | 105.18±2.78 | 105.09±2.88 | <0.001 |
| APTT (s) | 38.9±7.35 | 40.38±9.38 | 38.4±6.8 | 38.35±6.37 | 38.41±6.11 | <0.001 |
| RDW-CV | 0.14±0.02 | 0.14±0.03 | 0.14±0.02 | 0.14±0.02 | 0.14±0.02 | <0.001 |
| RDW-SD (fl) | 44.9±5.62 | 45.86±6.32 | 44.72±5.56 | 44.62±5.19 | 44.4±5.19 | <0.001 |
| HCT (%) | 36.27±5.05 | 34.59±5.08 | 35.77±4.85 | 36.73±4.88 | 38.06±4.73 | <0.001 |
| RBC (×1012/L) | 4.03±0.64 | 3.86±0.65 | 4±0.64 | 4.06±0.62 | 4.21±0.62 | <0.001 |
| Glu (mmol/L) | 6.3±1.85 | 6.46±1.99 | 6.4±1.82 | 6.18±1.8 | 6.14±1.76 | <0.001 |
| PLT (×109/L) | 212.03±71.58 | 212.39±77.02 | 218.53±74.39 | 212.34±67.7 | 204.77±65.79 | <0.001 |
| FIB (g/L) | 3.74±1 | 3.88±0.99 | 3.79±1.02 | 3.7±0.97 | 3.58±0.98 | <0.001 |
| HGB (g/L) | 119.59±17.28 | 113.27±17.11 | 117.66±16.38 | 121.39±16.72 | 126.26±16.17 | <0.001 |
| Ca (mmol/L) | 2.23±0.12 | 2.23±0.12 | 2.23±0.11 | 2.23±0.12 | 2.22±0.11 | 0.29 |
| Na (mmol/L) | 139.21±3.19 | 139.22±3.18 | 139.36±3.42 | 139.23±2.9 | 139.03±3.22 | 0.01 |
| K (mmol/L) | 3.85±0.46 | 3.87±0.4 | 3.83±0.4 | 3.83±0.42 | 3.86±0.6 | 0.01 |
| FEV1: Forced expiratory volume in the first second; BMI: Body mass index; NEUT%: Neutrophil percentage; LDH: Lactate dehydrogenase; PT: Prothrombin time; TT: Thrombin time; EOS%: Eosimophil; P-LCR: Platelet-large cell ratio; Cl: chloride; APTT: Activated partialthromboplastin time; RDW-CV: Red cell distribution width-coefficient of variation; RDW-SD: Red cell distribution width-standard deviation; HCT: Hematocrit; RBC: Red blood cell count; Glu: Glucose; PLT: Platelets; FIB: Fibrinogen; HGB: Hemoglobin; Ca: Calcium; Na: Sodium; K: Kalium. | ||||||
表3 根据FEV1四分位数划分的基线特征表
Tab.3 Baseline characteristics of the participants stratified by the quartiles of forced expiratory volume in 1 second (FEV1)
| Variable | Overall | Q1 | Q2 | Q3 | Q4 | P |
|---|---|---|---|---|---|---|
| Sample | 7720 | 1971 | 1932 | 1904 | 1913 | |
| FEV1 (L) | 1.99±0.54 | 1.32±0.24 | 1.8±0.1 | 2.16±0.11 | 2.69±0.26 | <0.001 |
| Age (year) | 68.56±6.27 | 71.82±6.75 | 68.82±6.17 | 67.59±5.56 | 65.91±4.83 | <0.001 |
| Gender (men) | 4197 (54.4%) | 474(24%) | 728 (37.7%) | 1193 (62.7%) | 1802 (94.2%) | <0.001 |
| BMI (kg/m2) | 25.09±7.38 | 24.81±7.5 | 25.1±7.42 | 25.23±7.48 | 25.22±7.12 | 0.24 |
| Smoking | 1762 (22.8%) | 254 (12.9%) | 379(19.6%) | 462 (24.3%) | 667 (34.9%) | <0.001 |
| Drinking | 551 (7.1%) | 63 (3.2%) | 100 (5.2%) | 132 (6.9%) | 256 (13.4%) | <0.001 |
| Marital status | <0.001 | |||||
| Never married | 43 (0.6%) | 16 (0.8%) | 13 (0.7%) | 4 (0.2%) | 10 (0.5%) | |
| Married | 7127 (92.3%) | 1716 (87.1%) | 1759 (91%) | 1799 (94.5%) | 1853 (96.9%) | |
| Divorced/seperated/widowed | 550 (7.1%) | 239 (12.1%) | 160 (8.3%) | 101 (5.3%) | 50 (2.6%) | |
| Number of hospitalizations | 1.81±2.37 | 1.87±2.23 | 1.77±2.13 | 1.84±2.53 | 1.76±2.56 | 0.43 |
| Disease of respiratory system | 626 (8.1%) | 212 (10.8%) | 151 (7.8%) | 125 (6.6%) | 138 (7.2%) | <0.001 |
| Hypertention | 2559 (33.1%) | 713 (36.2%) | 645 (33.4%) | 621 (32.6%) | 580 (30.3%) | 0.002 |
| Diabetes | 1189 (15.4%) | 317 (16.1%) | 295( 15.3%) | 294 (15.4%) | 283 (14.8%) | 0.74 |
| Stroke | 392 (5.1%) | 132 (6.7%) | 98 (5.1%) | 98 (5.1%) | 64 (3.3%) | <0.001 |
| Pulmonary arterial hypertension | 271 (3.5%) | 150 (7.6%) | 67 (3.5%) | 30 (1.6%) | 24 (1.3%) | <0.001 |
| CAD | 837 (10.8%) | 238 (12.1%) | 205 (10.6%) | 200 (10.5%) | 194 (10.1%) | 0.22 |
| NEUT (%) | 70.47±8.52 | 71.11±9 | 70.74±8.48 | 70.26±8.39 | 69.73±8.1 | <0.001 |
| LDH(U/L) | 243.67±412.54 | 269.32±327.14 | 251.35±393.6 | 225.9±301.33 | 227.18±573.27 | 0.002 |
| PT (s) | 14.32±2.55 | 15.03±3.5 | 14.22±2.33 | 13.99±1.93 | 14.02±1.94 | <0.001 |
| TT (s) | 18.6±8.47 | 19.73±11.39 | 18.24±6.98 | 18.37±7.93 | 18.03±6.52 | <0.001 |
| EOS (%) | 2.1±2.03 | 2.05±2.04 | 1.95±2.2 | 2.11±1.88 | 2.3±1.96 | <0.001 |
| P-LCR (%) | 27.64±24.86 | 29.14±47.23 | 26.98±8.07 | 27.14±8.15 | 27.25±7.86 | 0.02 |
| Cl (mmol/L) | 105.09±2.98 | 104.84±3.2 | 105.25±3.04 | 105.18±2.78 | 105.09±2.88 | <0.001 |
| APTT (s) | 38.9±7.35 | 40.38±9.38 | 38.4±6.8 | 38.35±6.37 | 38.41±6.11 | <0.001 |
| RDW-CV | 0.14±0.02 | 0.14±0.03 | 0.14±0.02 | 0.14±0.02 | 0.14±0.02 | <0.001 |
| RDW-SD (fl) | 44.9±5.62 | 45.86±6.32 | 44.72±5.56 | 44.62±5.19 | 44.4±5.19 | <0.001 |
| HCT (%) | 36.27±5.05 | 34.59±5.08 | 35.77±4.85 | 36.73±4.88 | 38.06±4.73 | <0.001 |
| RBC (×1012/L) | 4.03±0.64 | 3.86±0.65 | 4±0.64 | 4.06±0.62 | 4.21±0.62 | <0.001 |
| Glu (mmol/L) | 6.3±1.85 | 6.46±1.99 | 6.4±1.82 | 6.18±1.8 | 6.14±1.76 | <0.001 |
| PLT (×109/L) | 212.03±71.58 | 212.39±77.02 | 218.53±74.39 | 212.34±67.7 | 204.77±65.79 | <0.001 |
| FIB (g/L) | 3.74±1 | 3.88±0.99 | 3.79±1.02 | 3.7±0.97 | 3.58±0.98 | <0.001 |
| HGB (g/L) | 119.59±17.28 | 113.27±17.11 | 117.66±16.38 | 121.39±16.72 | 126.26±16.17 | <0.001 |
| Ca (mmol/L) | 2.23±0.12 | 2.23±0.12 | 2.23±0.11 | 2.23±0.12 | 2.22±0.11 | 0.29 |
| Na (mmol/L) | 139.21±3.19 | 139.22±3.18 | 139.36±3.42 | 139.23±2.9 | 139.03±3.22 | 0.01 |
| K (mmol/L) | 3.85±0.46 | 3.87±0.4 | 3.83±0.4 | 3.83±0.42 | 3.86±0.6 | 0.01 |
| FEV1: Forced expiratory volume in the first second; BMI: Body mass index; NEUT%: Neutrophil percentage; LDH: Lactate dehydrogenase; PT: Prothrombin time; TT: Thrombin time; EOS%: Eosimophil; P-LCR: Platelet-large cell ratio; Cl: chloride; APTT: Activated partialthromboplastin time; RDW-CV: Red cell distribution width-coefficient of variation; RDW-SD: Red cell distribution width-standard deviation; HCT: Hematocrit; RBC: Red blood cell count; Glu: Glucose; PLT: Platelets; FIB: Fibrinogen; HGB: Hemoglobin; Ca: Calcium; Na: Sodium; K: Kalium. | ||||||
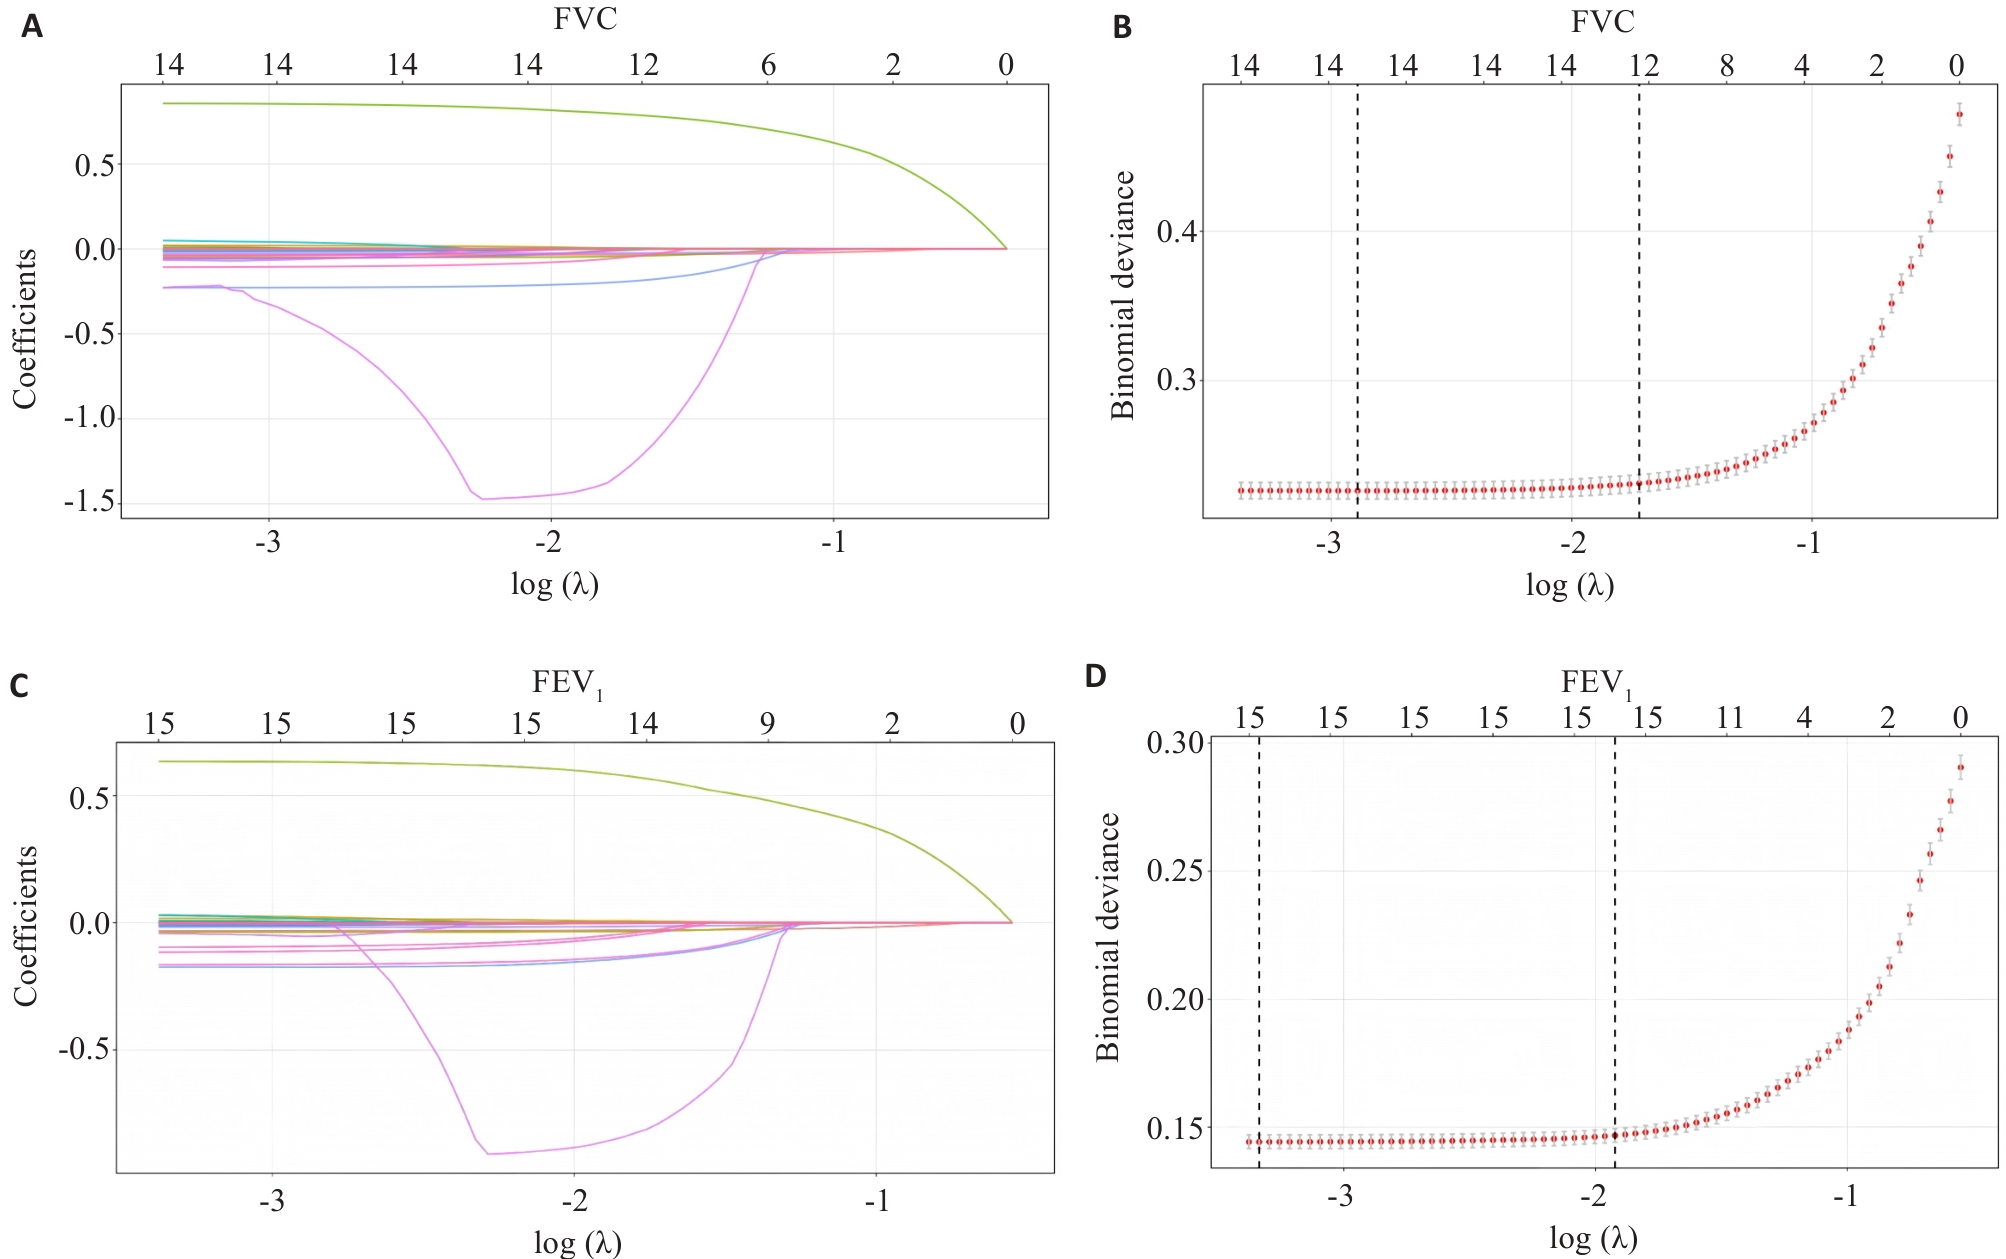
图1 预测变量的LASSO回归筛选过程和最佳参数λ的选择
Fig.1 LASSO regression screening of predictive variables and selection of the optimal parameters λ. A: LASSO regression coefficient trajectory plot for FVC. B: Binomial deviance plot for optimal λ selection in LASSO regression (FVC). C: LASSO regression coefficient trajectory plot for FEV1. D: Binomial deviance plot for optimal λ selection in LASSO regression (FEV1).
| Model | r | ICC | MSE | RMSE | MAE |
|---|---|---|---|---|---|
| FVC | |||||
| LR | 0.728 | 0.695 | 0.212 | 0.461 | 0.365 |
| RF | 0.727 | 0.691 | 0.213 | 0.462 | 0.366 |
| XGBoost | 0.733 | 0.694 | 0.210 | 0.459 | 0.364 |
| GBM | 0.728 | 0.692 | 0.211 | 0.460 | 0.364 |
| SVR | 0.721 | 0.694 | 0.218 | 0.467 | 0.368 |
| FEV1 | |||||
| LR | 0.709 | 0.666 | 0.141 | 0.376 | 0.292 |
| RF | 0.701 | 0.659 | 0.140 | 0.374 | 0.293 |
| XGBoost | 0.711 | 0.668 | 0.136 | 0.369 | 0.291 |
| GBM | 0.708 | 0.665 | 0.142 | 0.380 | 0.296 |
| SVR | 0.688 | 0.662 | 0.146 | 0.382 | 0.297 |
| ICC: Intraclass correlation coefficient; MSE: Mean squared error; RMSE: Root mean square error; MAE: Mean absolute error; LR: Linear regression; RF: Random forest; XGBoost: Extreme gradient boosting; GBM: Gradient boosting machine; SVR: Support vector regression. | |||||
表4 5种模型预测FVC和FEV1的性能比较(插补后数据集)
Tab.4 Performance comparison of the 5 models for predicting FVC and FEV1 (imputed dataset)
| Model | r | ICC | MSE | RMSE | MAE |
|---|---|---|---|---|---|
| FVC | |||||
| LR | 0.728 | 0.695 | 0.212 | 0.461 | 0.365 |
| RF | 0.727 | 0.691 | 0.213 | 0.462 | 0.366 |
| XGBoost | 0.733 | 0.694 | 0.210 | 0.459 | 0.364 |
| GBM | 0.728 | 0.692 | 0.211 | 0.460 | 0.364 |
| SVR | 0.721 | 0.694 | 0.218 | 0.467 | 0.368 |
| FEV1 | |||||
| LR | 0.709 | 0.666 | 0.141 | 0.376 | 0.292 |
| RF | 0.701 | 0.659 | 0.140 | 0.374 | 0.293 |
| XGBoost | 0.711 | 0.668 | 0.136 | 0.369 | 0.291 |
| GBM | 0.708 | 0.665 | 0.142 | 0.380 | 0.296 |
| SVR | 0.688 | 0.662 | 0.146 | 0.382 | 0.297 |
| ICC: Intraclass correlation coefficient; MSE: Mean squared error; RMSE: Root mean square error; MAE: Mean absolute error; LR: Linear regression; RF: Random forest; XGBoost: Extreme gradient boosting; GBM: Gradient boosting machine; SVR: Support vector regression. | |||||
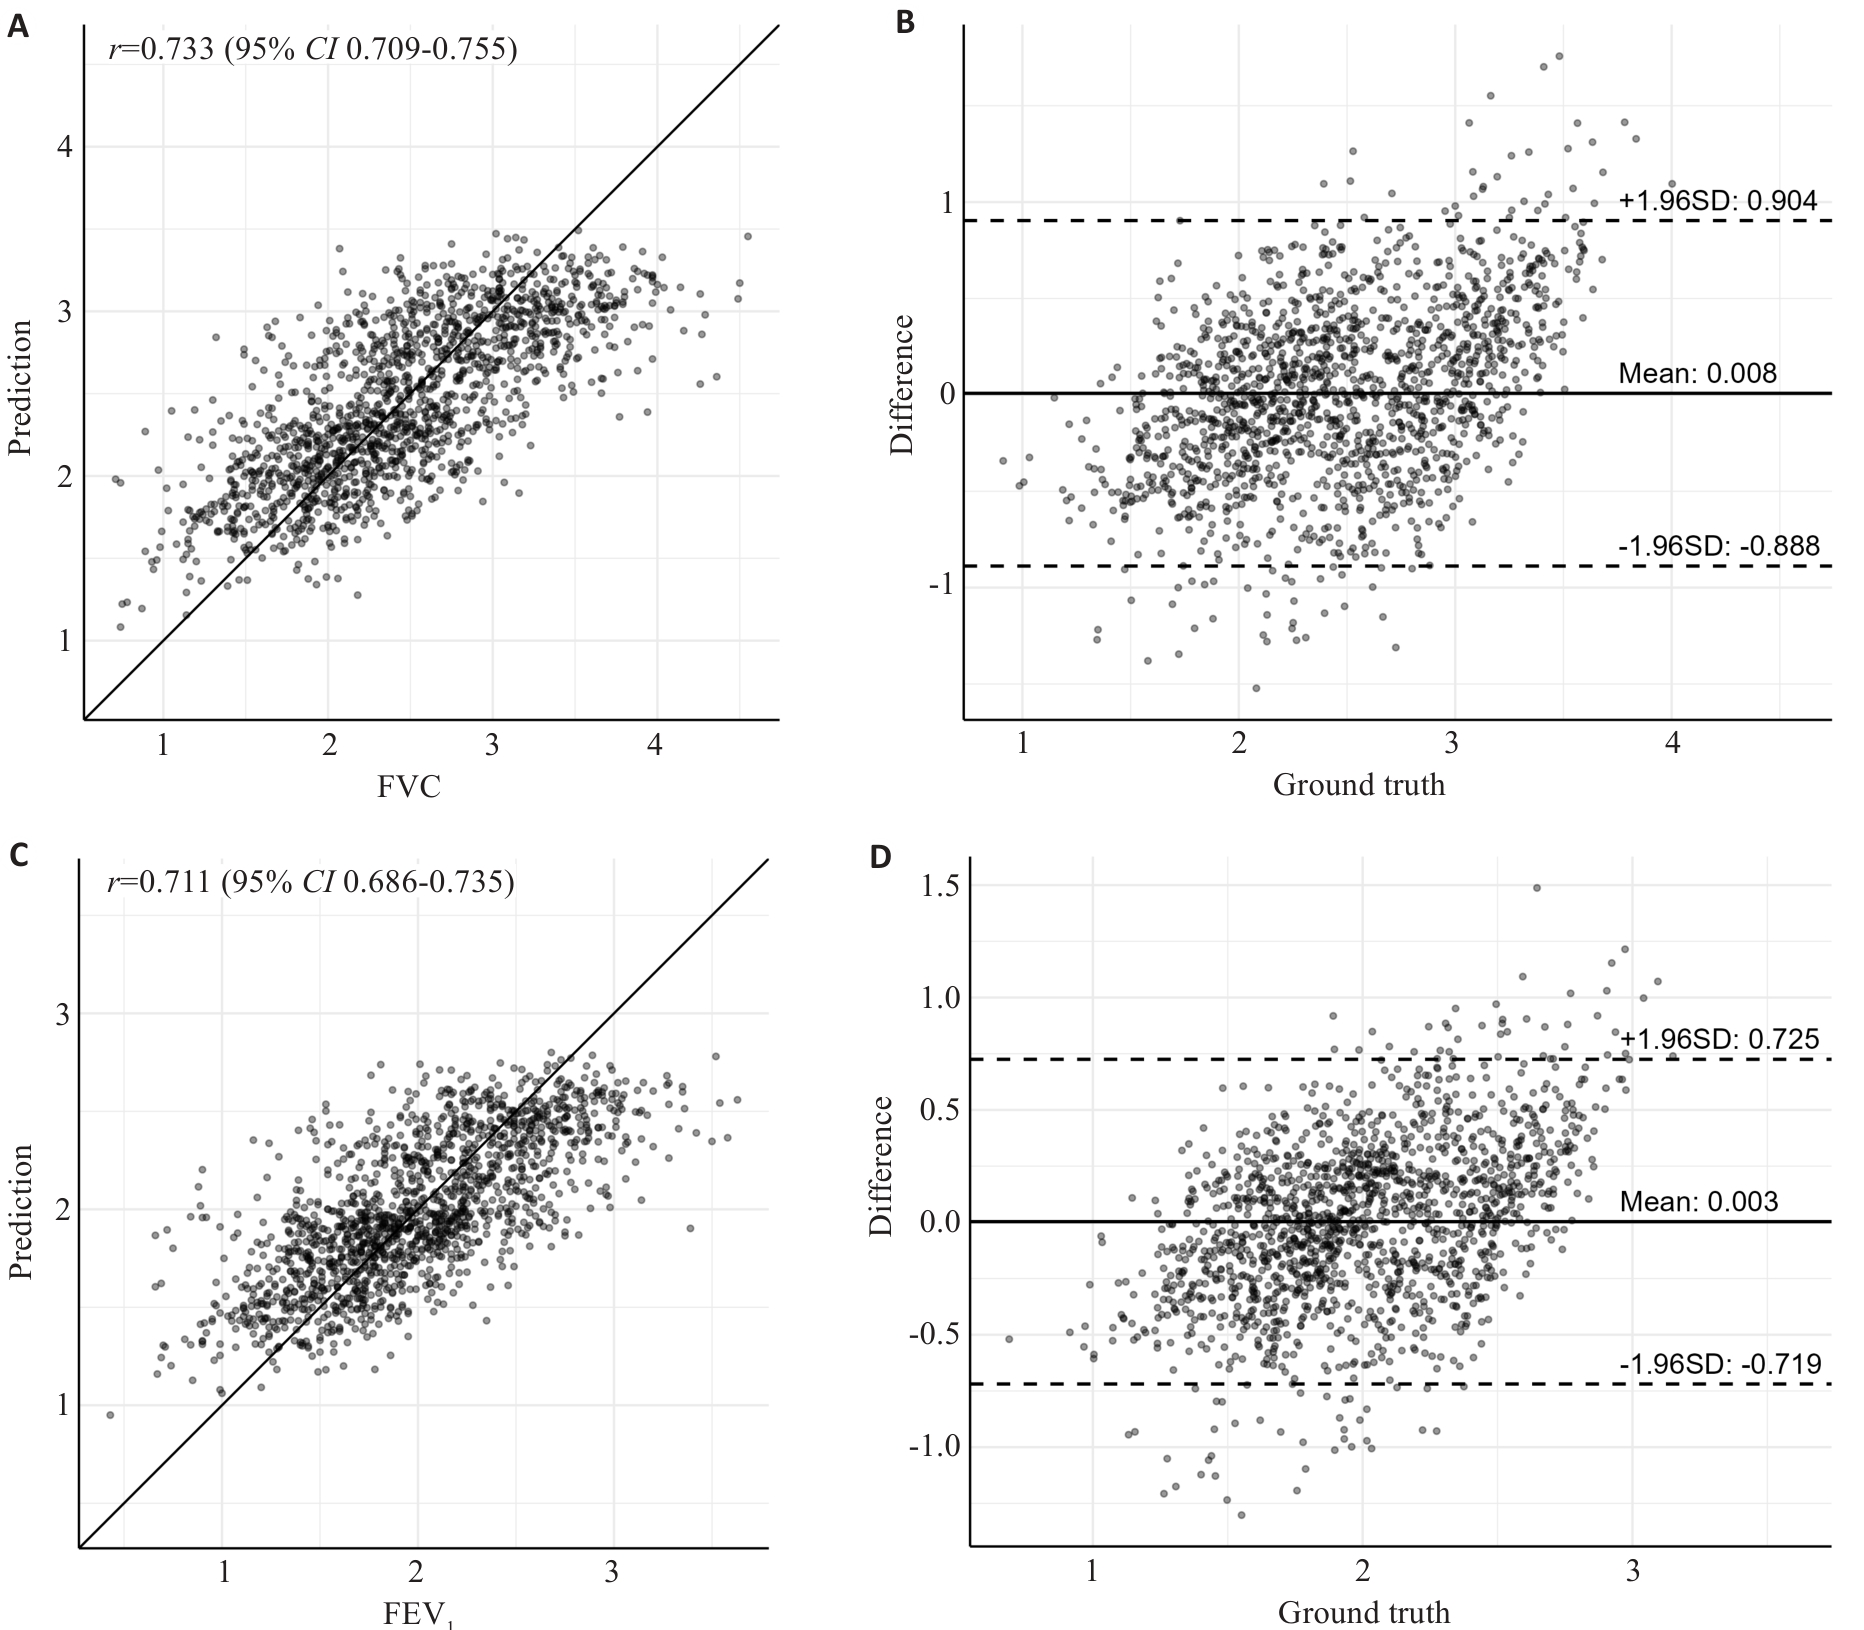
图2 XGBoost预测FVC和FEV1的性能
Fig.2 Performance of XGBoost model for predicting FVC and FEV1. A: Scatter plot of predicted vs measured FVC. B: Bland-Altman plot of FVC predictions. C: Scatter plot of predicted vs measured FEV1. D: Bland-Altman plot of FEV1 predictions.
| Model | r | ICC | MSE | RMSE | MAE |
|---|---|---|---|---|---|
| FVC | |||||
| LR | 0.677 | 0.639 | 0.264 | 0.514 | 0.399 |
| RF | 0.674 | 0.595 | 0.268 | 0.518 | 0.403 |
| XGBoost | 0.668 | 0.621 | 0.269 | 0.519 | 0.403 |
| GBM | 0.671 | 0.628 | 0.268 | 0.517 | 0.402 |
| SVR | 0.659 | 0.636 | 0.281 | 0.530 | 0.410 |
| FEV1 | |||||
| LR | 0.695 | 0.655 | 0.149 | 0.386 | 0.304 |
| RF | 0.679 | 0.634 | 0.155 | 0.394 | 0.312 |
| XGBoost | 0.683 | 0.633 | 0.154 | 0.39 | 0.311 |
| GBM | 0.685 | 0.639 | 0.153 | 0.391 | 0.308 |
| SVR | 0.700 | 0.668 | 0.147 | 0.384 | 0.304 |
| FVC: Forced vital capacity; FEV1: Forced expiratory volume in the first second; ICC: Intraclass correlation coefficient; MSE: Mean squared error;RMSE: Root mean square error; MAE: Mean absolute error; LR: Linear regression; RF: Random forest; XGBoost: eXtreme gradient boosting; GBM: Gradient boosting machine; SVR: Support vector regression. | |||||
表5 5种模型预测FVC和FEV1的性能比较(完整数据集)
Tab.5 Performance comparison of the 5 models for predicting FVC and FEV1 (complete dataset)
| Model | r | ICC | MSE | RMSE | MAE |
|---|---|---|---|---|---|
| FVC | |||||
| LR | 0.677 | 0.639 | 0.264 | 0.514 | 0.399 |
| RF | 0.674 | 0.595 | 0.268 | 0.518 | 0.403 |
| XGBoost | 0.668 | 0.621 | 0.269 | 0.519 | 0.403 |
| GBM | 0.671 | 0.628 | 0.268 | 0.517 | 0.402 |
| SVR | 0.659 | 0.636 | 0.281 | 0.530 | 0.410 |
| FEV1 | |||||
| LR | 0.695 | 0.655 | 0.149 | 0.386 | 0.304 |
| RF | 0.679 | 0.634 | 0.155 | 0.394 | 0.312 |
| XGBoost | 0.683 | 0.633 | 0.154 | 0.39 | 0.311 |
| GBM | 0.685 | 0.639 | 0.153 | 0.391 | 0.308 |
| SVR | 0.700 | 0.668 | 0.147 | 0.384 | 0.304 |
| FVC: Forced vital capacity; FEV1: Forced expiratory volume in the first second; ICC: Intraclass correlation coefficient; MSE: Mean squared error;RMSE: Root mean square error; MAE: Mean absolute error; LR: Linear regression; RF: Random forest; XGBoost: eXtreme gradient boosting; GBM: Gradient boosting machine; SVR: Support vector regression. | |||||
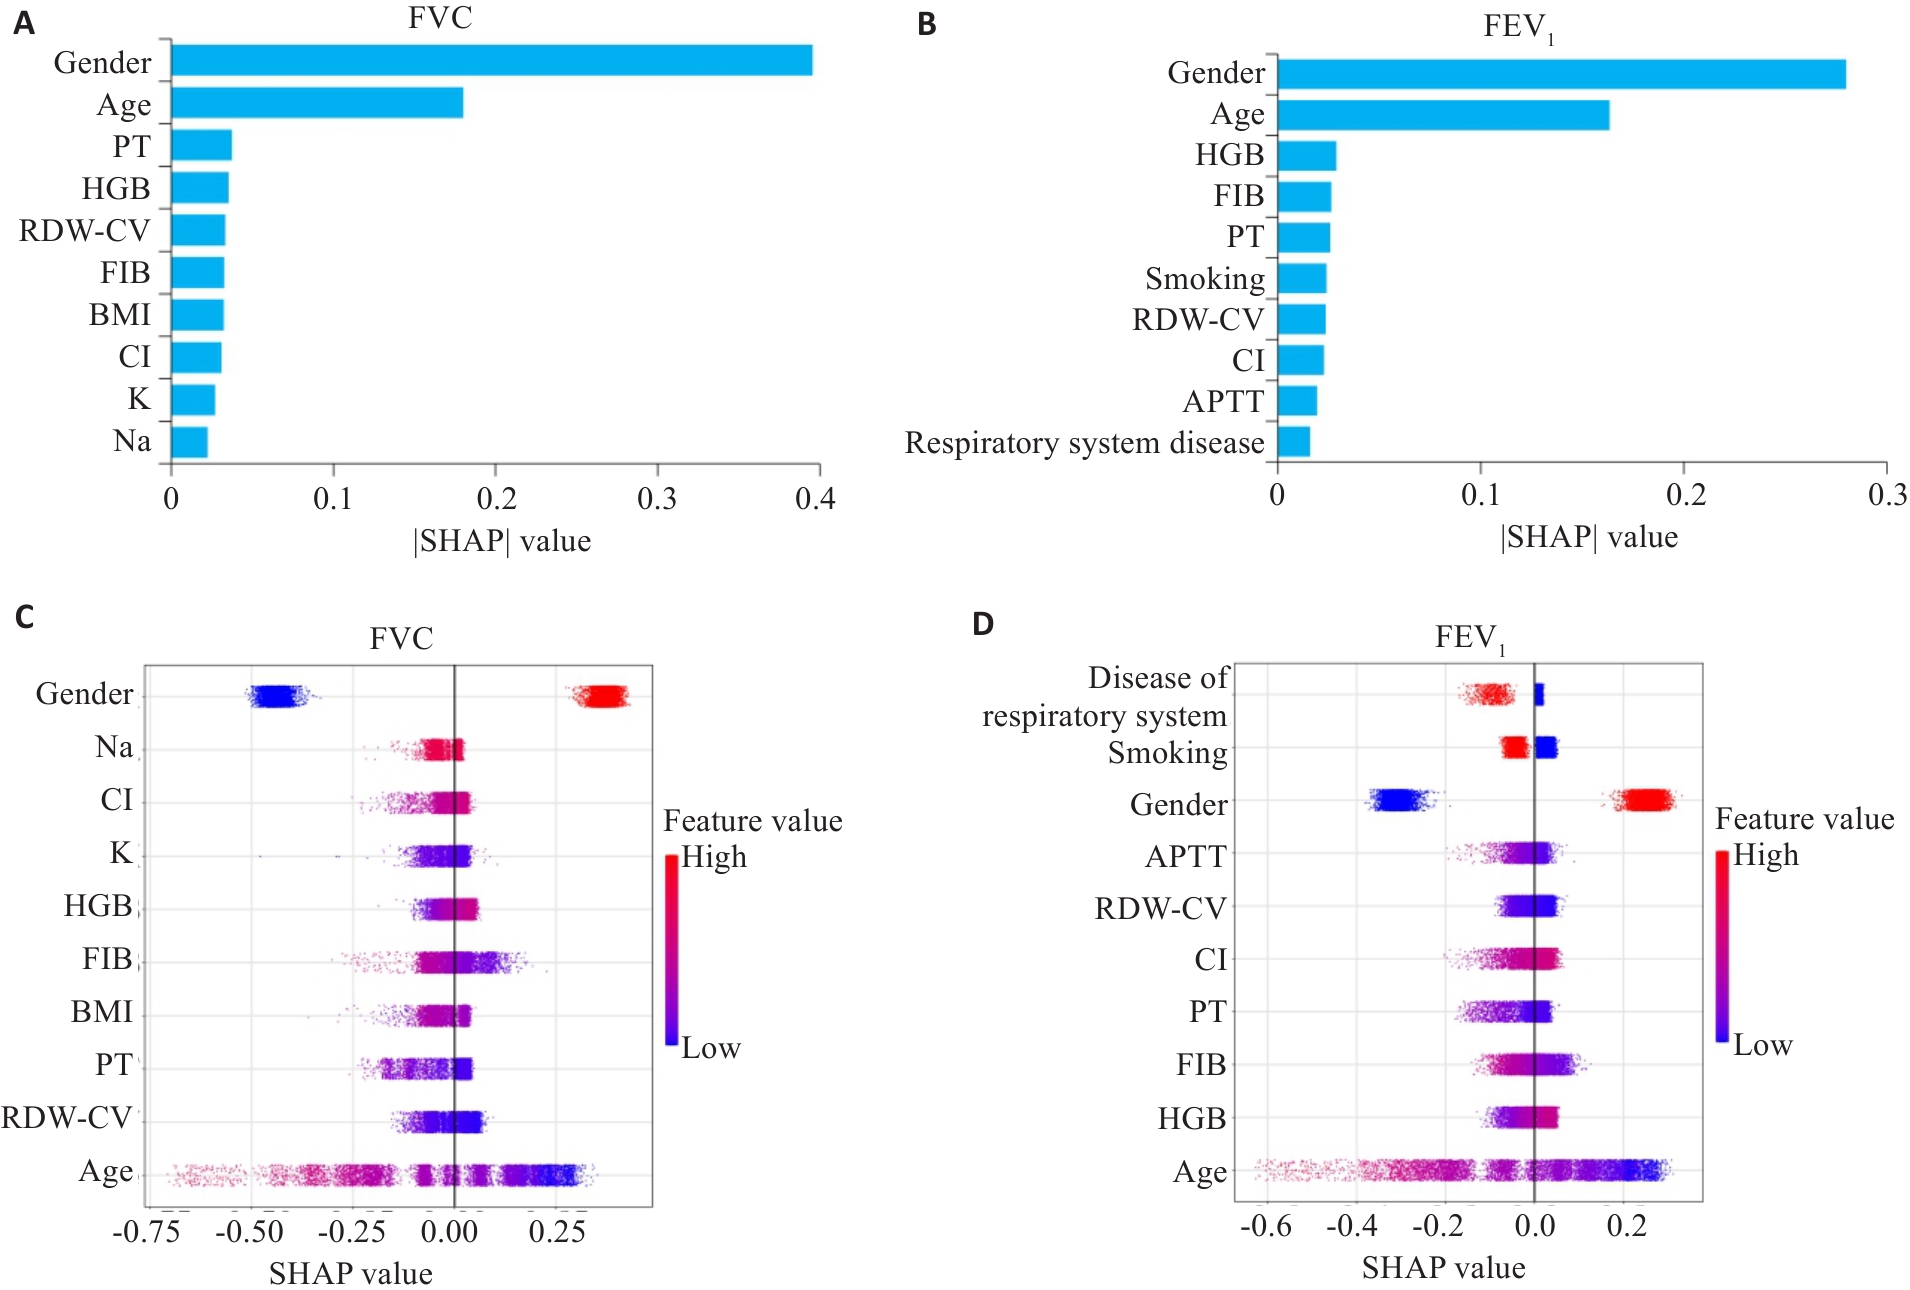
图3 XGBoost模型的特征重要性及蜂群图
Fig.3 Feature importance and beeswarm plots of the XGBoost model. A: Feature importance bar plot of FVC. B: Feature importance bar plot of FEV1. C: Beeswarm plots of FVC. D: Beeswarm plots of FEV1.
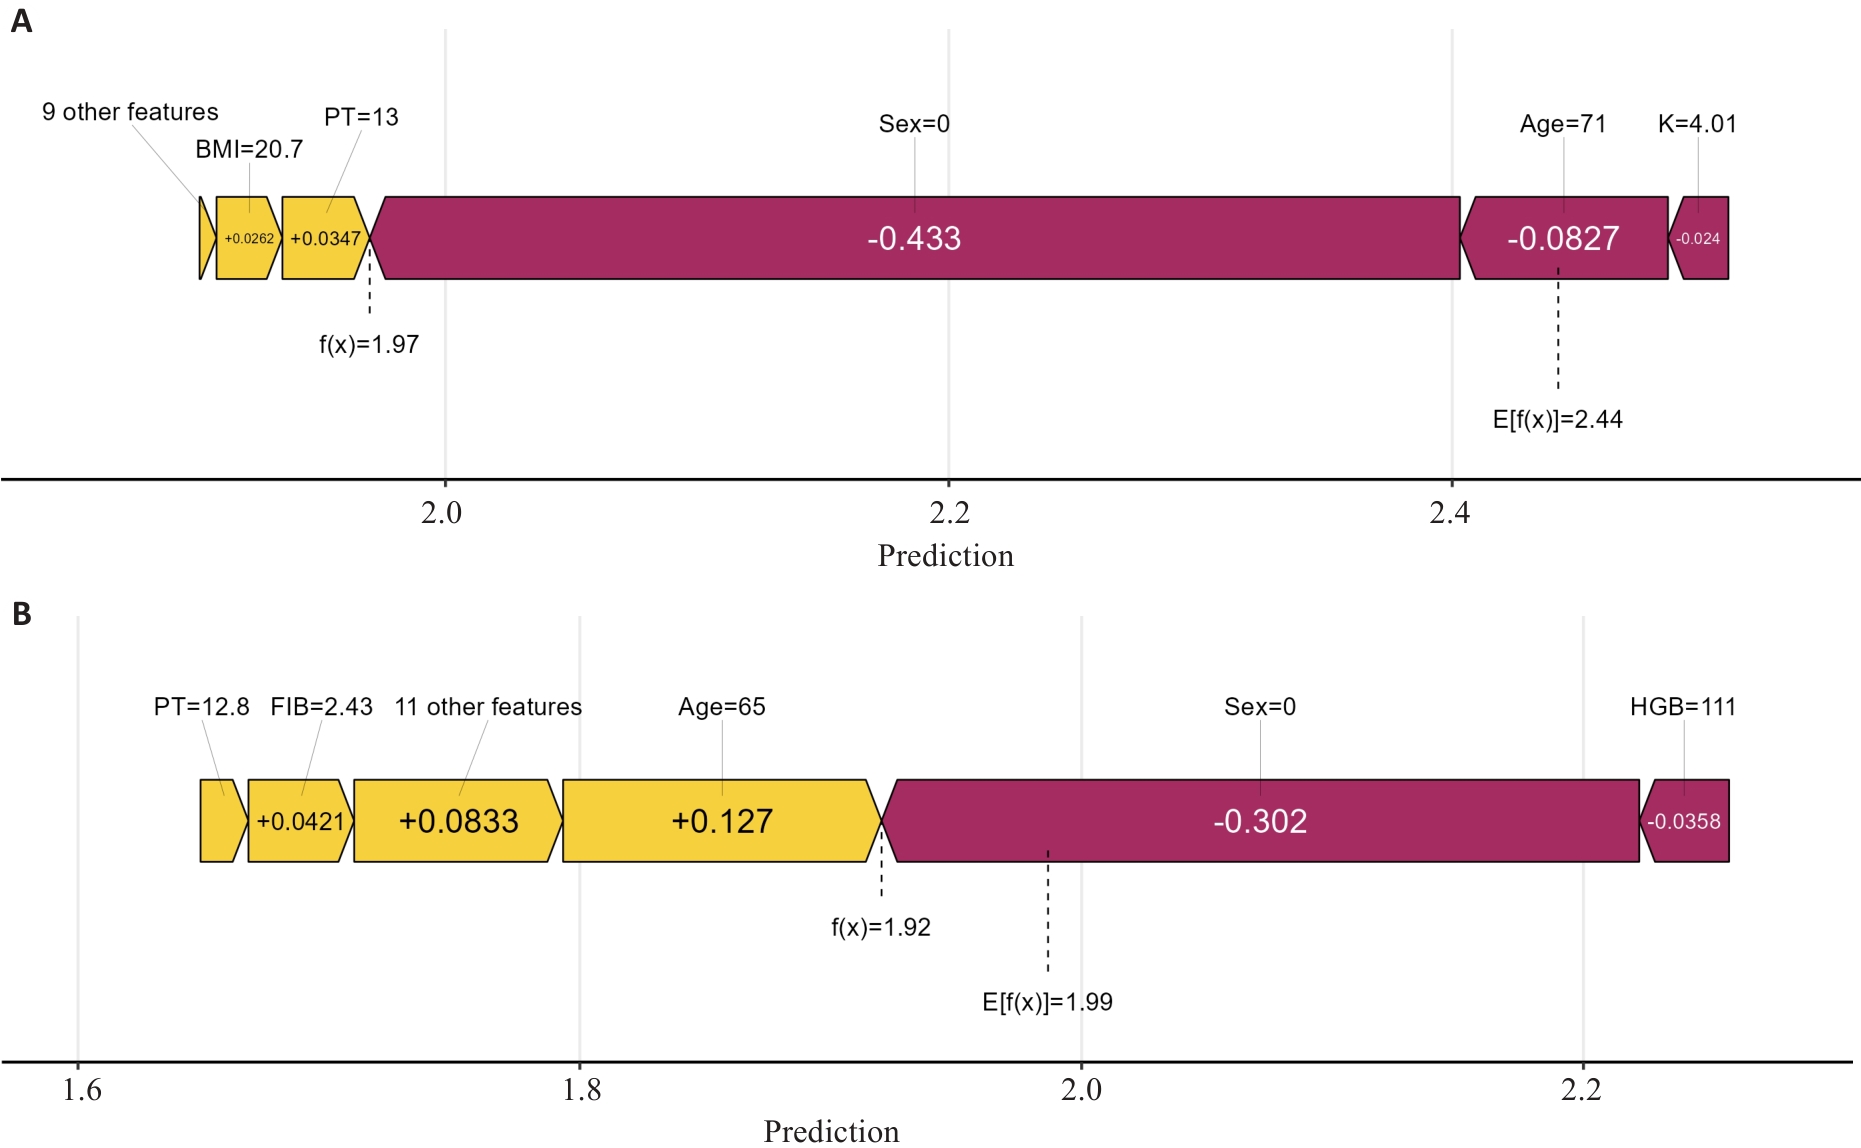
图4 XGBoost模型预测FVC和FEV1的SHAP力图(单个样本解释)
Fig.4 SHAP force plot of XGBoost model for predicting FVC and FEV1 (single sample explanation). A: SHAP contribution decomposition for FVC prediction. B: SHAP contribution decomposition for FEV1 prediction.
| Index | Cut-off values (%) | Sensitivity | Specificity | AUC |
|---|---|---|---|---|
| Clinical cut-off value | ||||
| FVC% | 80 | 0.540 | 0.740 | 0.688 |
| FEV1% | 80 | 0.440 | 0.809 | 0.688 |
| Model cut-off value | ||||
| FVC% | 82.93 | 0.645 | 0.645 | 0.700 |
| FEV1% | 85.46 | 0.651 | 0.651 | 0.706 |
表6 XGBoost的风险预测性能
Tab.6 Risk prediction performance of XGBoost
| Index | Cut-off values (%) | Sensitivity | Specificity | AUC |
|---|---|---|---|---|
| Clinical cut-off value | ||||
| FVC% | 80 | 0.540 | 0.740 | 0.688 |
| FEV1% | 80 | 0.440 | 0.809 | 0.688 |
| Model cut-off value | ||||
| FVC% | 82.93 | 0.645 | 0.645 | 0.700 |
| FEV1% | 85.46 | 0.651 | 0.651 | 0.706 |
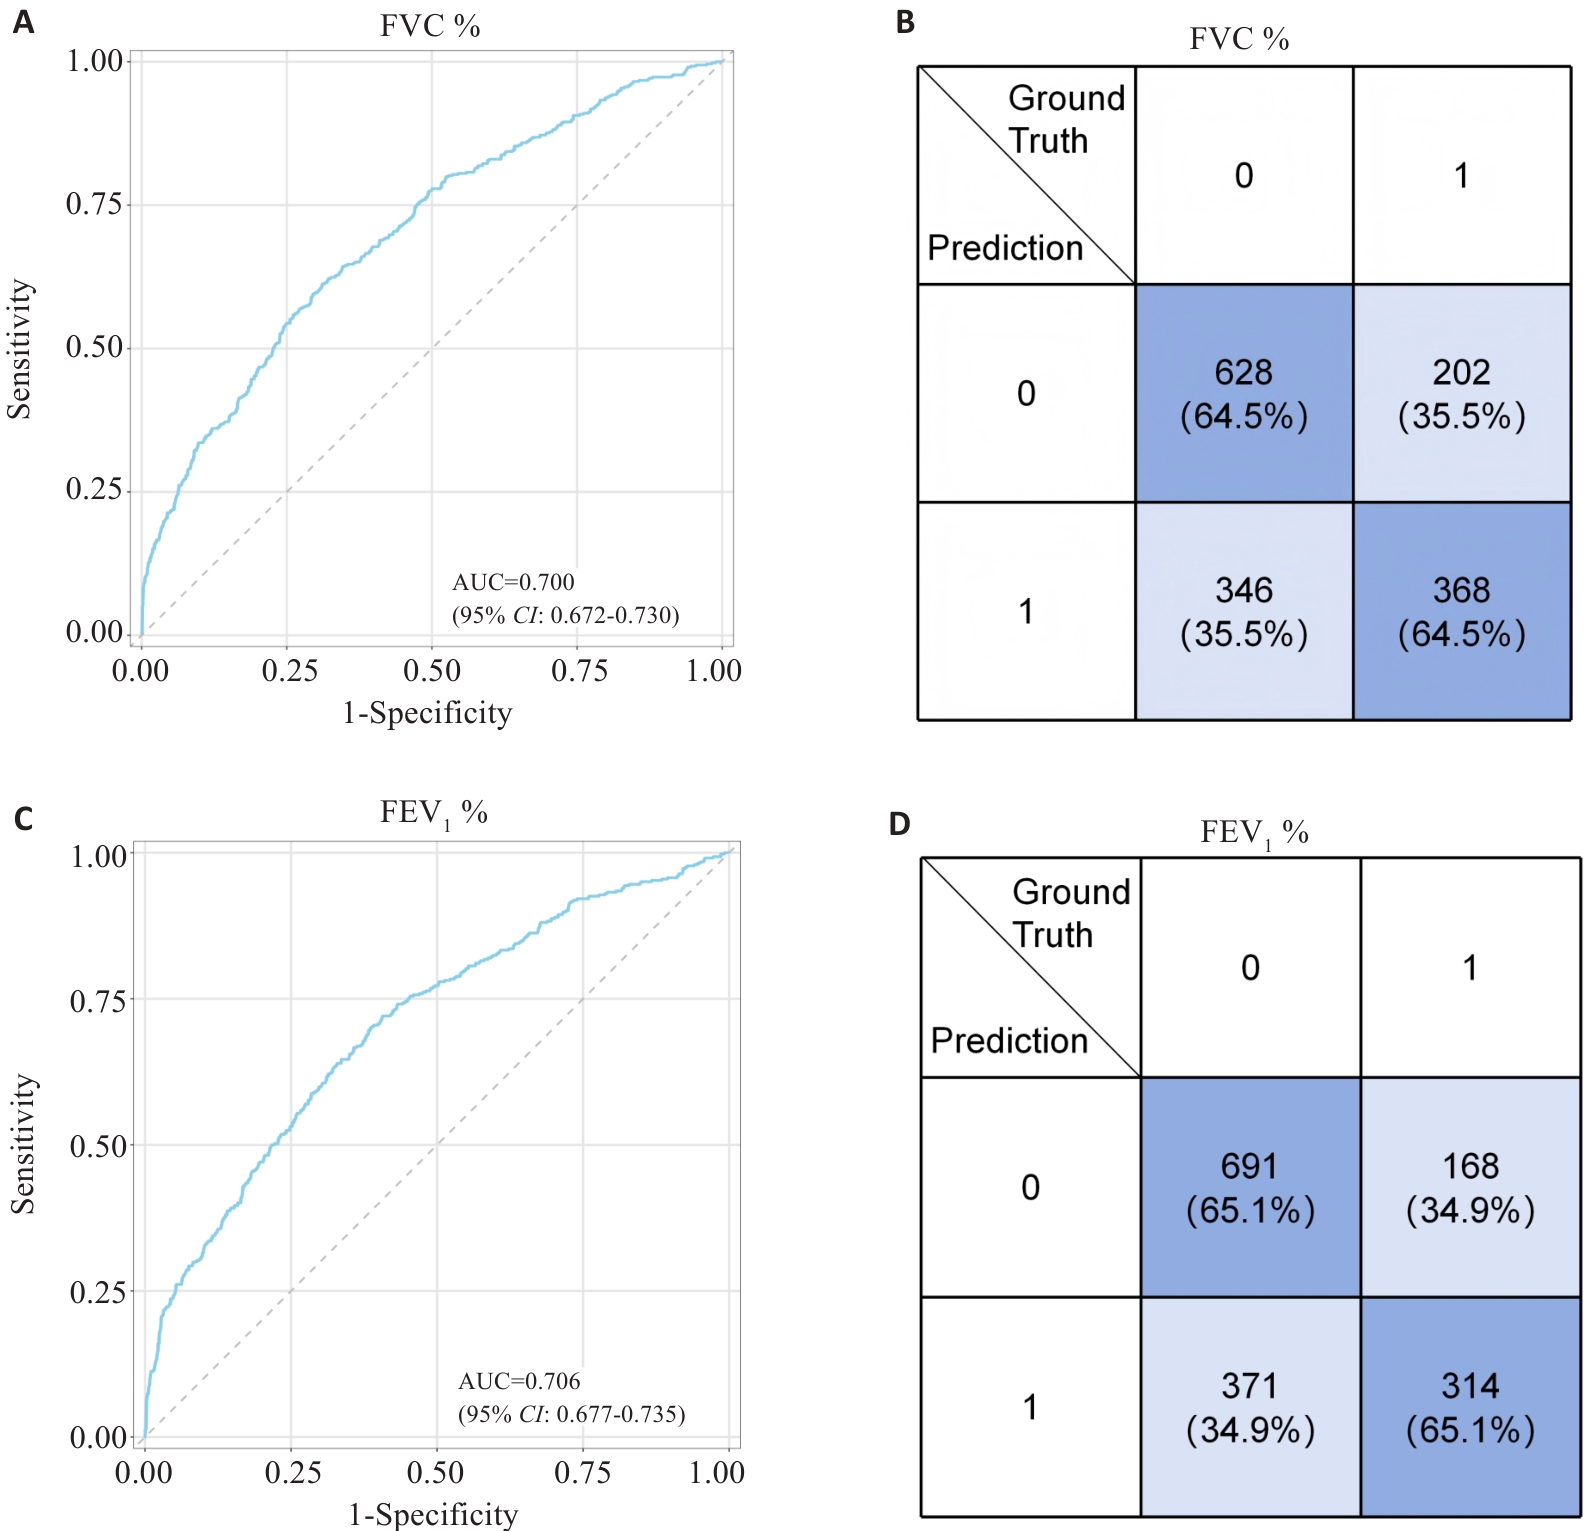
图5 基于XGBoost的ROC曲线和混淆矩阵
Fig.5 ROC and Confusion matrix based on XGBoost. A: ROC of FVC%. B: Confusion matrix of FVC%. C: ROC of FEV1%. D: Confusion matrix of FEV1%.
| [1] | 国家统计局,国务院第七次全国人口普查领导小组办公室. 第七次全国人口普查公报(第五号)[EB/OL].(2021-05-11)[2025-01-08] [Z]. |
| [2] | Ding YQ, Hu JC, Yu CQ, et al. Spirometric pattern and cardiovascular risk: a prospective study of 0.3 million Chinese never-smokers [J]. Lancet Reg Health West Pac, 2025, 54: 101274. |
| [3] | Grande G, Li YJ, Trevisan C, et al. Lung function in relation to brain aging and cognitive transitions in older adults: a population-based cohort study[J]. Alzheimers Dement, 2024, 20(8): 5662-73. doi:10.1002/alz.14079 |
| [4] | Backman H, Sawalha S, Nilsson U, et al. All-cause and cause-specific mortality by spirometric pattern and sex–a population-based cohort study[J]. Ther Adv Respir Dis, 2024, 18: 17534666241232768. doi:10.1177/17534666241232768 |
| [5] | Kokkinos P, Faselis C, Samuel IBH, et al. Cardiorespiratory fitness and mortality risk across the spectra of age, race, and sex[J]. J Am Coll Cardiol, 2022, 80(6): 598-609. doi:10.1016/j.jacc.2022.05.031 |
| [6] | Dehondt V, Vauterin D, Derom E, et al. Association of timely spirometry with lower all-cause mortality a nationwide obstructive cohort study[J]. CHEST, 2025, 168(3): 602-12. doi:10.1016/j.chest.2025.03.018 |
| [7] | 中华医学会健康管理学分会, 中华健康管理学杂志编委会. 健康管理概念与学科体系的中国专家初步共识[J]. 中华健康管理学杂志, 2009, 3(3): 141-7. |
| [8] | Maheshwari R, Singh A, Chaudhari PS, et al. Impulse oscillometry: an adjunct or alternative to spirometry in the diagnosis of obstructive airway disease. Results from an observational study[J]. Indian J Tuberc, 2026, 73(1): 21-4. doi:10.1016/j.ijtb.2025.01.007 |
| [9] | Lynch CJ, Liston C. New machine-learning technologies for computer-aided diagnosis[J]. Nat Med, 2018, 24(9): 1304-5. doi:10.1038/s41591-018-0178-4 |
| [10] | Zhang BY, Sun D, Niu HT, et al. Development of a prediction model to identify undiagnosed chronic obstructive pulmonary disease patients in primary care settings in China[J]. Chin Med J, 2023, 136(6): 676-82. doi:10.1097/cm9.0000000000002448 |
| [11] | Wu XN, Yin CS, Chen XQ, et al. Idiopathic pulmonary fibrosis mortality risk prediction based on artificial intelligence: the CTPF model[J]. Front Pharmacol, 2022, 13: 878764. doi:10.3389/fphar.2022.878764 |
| [12] | 中华医学会呼吸病学分会肺功能专业组. 肺功能检查指南(第二部分)––肺量计检查[J]. 中华结核和呼吸杂志, 2014, 37(07): 481-6. doi:10.3760/cma.j.issn.1001-0939.2014.07.001 |
| [13] | Graham BL, Steenbruggen I, Miller MR, et al. Standardization of spirometry 2019 update. an official American thoracic society and European respiratory society technical statement[J]. Am J Respir Crit Care Med, 2019, 200(8): e70-88. doi:10.1164/rccm.201908-1590st |
| [14] | Global Initiative for Chronic Obstructive Lung Disease. Global Strategy for the Diagnosis, Management, and Prevention of Chronic Obstructive Pulmonary Disease: 2026 Report [R]. Global Initiative for Chronic Obstructive Lung Disease, 2025. |
| [15] | Fernández-Blázquez MA, Ruiz-Sánchez de León JM, Sanz-Blasco R, et al. XGBoost models based on non imaging features for the prediction of mild cognitive impairment in older adults[J]. Sci Rep, 2025, 15(1): 29732. doi:10.1038/s41598-025-14832-0 |
| [16] | Inoue T, Ichikawa D, Ueno T, et al. XGBoost, a machine learning method, predicts neurological recovery in patients with cervical spinal cord injury[J]. Neurotrauma Rep, 2020, 1(1): 8-16. doi:10.1089/neur.2020.0009 |
| [17] | Schindele A, Krebold A, Heiß U, et al. Interpretable machine learning for thyroid cancer recurrence predicton: Leveraging XGBoost and SHAP analysis[J]. Eur J Radiol, 2025, 186: 112049. doi:10.1016/j.ejrad.2025.112049 |
| [18] | Dominelli PB, Molgat-Seon Y. Sex, gender and the pulmonary physiology of exercise[J]. Eur Respir Rev, 2022, 31(163): 210074. doi:10.1183/16000617.0074-2021 |
| [19] | Wang C, Xu JY, Yang L, et al. Prevalence and risk factors of chronic obstructive pulmonary disease in China (the China Pulmonary Health [CPH] study): a national cross-sectional study[J]. Lancet, 2018, 391(10131): 1706-17. doi:10.1016/s0140-6736(18)30841-9 |
| [20] | Chen SM, Kuhn M, Prettner K, et al. The global economic burden of chronic obstructive pulmonary disease for 204 countries and territories in 2020-50: a health-augmented macroeconomic modelling study[J]. Lancet Glob Health, 2023, 11(8): e1183-93. doi:10.1016/s2214-109x(23)00217-6 |
| [21] | Adeloye D, Song PG, Zhu YJ, et al. Global, regional, and national prevalence of, and risk factors for, chronic obstructive pulmonary disease (COPD) in 2019: a systematic review and modelling analysis[J]. Lancet Respir Med, 2022, 10(5): 447-58. doi:10.1016/s2213-2600(21)00511-7 |
| [22] | 刘 领, 吴文杰, 杨 霁, 等. 慢性阻塞性肺疾病患者凝血状态临床观察[J]. 中国医药科学, 2016, 6(2): 176-9. |
| [23] | 左晓红, 李庆红. 老年慢性阻塞性肺疾病急性加重期患者凝血功能的监测[J]. 血栓与止血学, 2017, 23(1): 89-91, 94. |
| [24] | 李一龙, 景小莹. 支气管哮喘患者血清LXA4水平及凝血功能与肺功能及哮喘病程的相关性研究[J]. 河北医药, 2019, 41(8): 1200-3. |
| [25] | 肉克亚木汗·艾尔肯. 支气管哮喘患者凝血功能与肺功能的相关性研究[D]. 乌鲁木齐: 新疆医科大学, 2022. |
| [26] | Díez-Sierra J, Medina-Gallardo JF, Muñoz-Sánchez B, et al. FEV(1) decline and clinical predictors in asthma after 10 Years of follow-up: BMI as a modifiable risk factor[J]. Respir Med, 2025, 246: 108247. doi:10.1016/j.rmed.2025.108247 |
| [27] | Lange P, Celli B, Agustí A, et al. Lung-function trajectories leading to chronic obstructive pulmonary disease[J]. N Engl J Med, 2015, 373(2): 111-22. doi:10.1056/nejmoa1411532 |
| [1] | 李壮, 石欢, 陈洁婷, 梁欲琪, 吴迎朝, 左谦, 陈前军. 芍药苷靶向EZH2/CCNE1调控细胞周期与炎症微环境改善乳腺癌化疗期癌因性疲乏[J]. 南方医科大学学报, 2026, 46(8): 1835-1849. |
| [2] | 史士恒, 花代平, 项尚, 孙兰婷, 宣巧玉, 杨文明, 汪瀚. 基于机器学习的Wilson病脂肪肝预测模型的开发与验证[J]. 南方医科大学学报, 2026, 46(8): 1861-1869. |
| [3] | 朱梦欣, 刘晓, 赵珊, 张新, 刘超, 刘献孔, 綦浩辰, 韩铁生, 马冬. 可解释性机器学习模型对宫颈癌周围神经浸润的术前精准预测及临床决策支持:一项多中心回顾性研究[J]. 南方医科大学学报, 2026, 46(7): 1509-1519. |
| [4] | 陈萌萌, 郭润芳, 赵文洁, 王咏琪, 左芦根, 刘牧林, 李彬. 多维特征下的消化道恶性肿瘤患者焦虑情绪识别模型构建:基于多种可解释性机器学习算法[J]. 南方医科大学学报, 2026, 46(7): 1660-1670. |
| [5] | 陈浩, 李振汉, 纪梦佳, 汪鑫诚, 陈博峰, 管谦, 武嫚, 卢林明. 全球非酒精性脂肪性肝病负担的关键决定因素:基于GBD数据的机器学习联合孟德尔随机化验证[J]. 南方医科大学学报, 2026, 46(4): 770-784. |
| [6] | 陶红成, 梁富凯, 黄文波, 范思奇, 曾平. 酒精暴露与股骨头坏死的潜在关联:基于机器学习构建诊断模型[J]. 南方医科大学学报, 2026, 46(3): 559-569. |
| [7] | 向科霖, 章晓云, 黎征鹏, 徐志为, 刘素杰, 柴源. 胞葬相关基因UCP2、EGLN3、IL1B对骨关节炎的诊断价值及中药治疗预测:基于生物信息学及机器学习[J]. 南方医科大学学报, 2026, 46(3): 693-706. |
| [8] | 陈君尧, 陈泽宇, 林钊杰, 方梦浩, 沈超英, 许琦, 张晓怡, 卢鲁. 饮茶对胃肠道疾病风险的双重作用:基于可解释机器学习与大语言模型的联合预测辅助模型[J]. 南方医科大学学报, 2026, 46(2): 353-361. |
| [9] | 崔运能, 冯敏清, 姚亮凤, 严杰文, 李闻瀚, 黄燕平. 基于欠采样的影像组学机器学习模型术前预测子宫肌瘤高强度聚焦超声消融效果[J]. 南方医科大学学报, 2026, 46(1): 141-149. |
| [10] | 黄启智, 谢戴鹏, 姚霖彤, 李洽轩, 吴少伟, 周海榆. 肿瘤微环境特异性CT影像组学标签预测非小细胞肺癌免疫治疗疗效[J]. 南方医科大学学报, 2025, 45(9): 1903-1918. |
| [11] | 姜君, 封硕, 孙银贵, 安燕. 经尿道前列腺钬激光剜除术后低体温风险预测模型:基于逻辑回归、决策树和支持向量机[J]. 南方医科大学学报, 2025, 45(9): 2019-2025. |
| [12] | 王心恒, 邵小涵, 李童童, 张璐, 杨勤军, 叶卫东, 童佳兵, 李泽庚, 方向明. 平喘宁方通过调控HMGB1/Beclin-1轴介导的自噬改善患寒哮证大鼠的气道炎症[J]. 南方医科大学学报, 2025, 45(6): 1153-1162. |
| [13] | 陈梅妹, 王洋, 雷黄伟, 张斐, 黄睿娜, 杨朝阳. 基于多种机器学习算法和语音情绪特征的阈下抑郁辨识模型构建[J]. 南方医科大学学报, 2025, 45(4): 711-717. |
| [14] | 王飞, 李蔚然, 尚祥, 李飞. 中国农村社区老年人认知障碍预测模型的构建与验证——基于中国健康与养老追踪调查数据库[J]. 南方医科大学学报, 2025, 45(12): 2639-2645. |
| [15] | 陈莉莉, 吴天宇, 张铭, 丁子夏, 张妍, 杨依清, 郑佳倩, 张小楠. 类风湿关节炎的潜在生物标志物及其免疫调控机制:基于GEO数据库[J]. 南方医科大学学报, 2024, 44(6): 1098-1108. |
| 阅读次数 | ||||||
|
全文 |
|
|||||
|
摘要 |
|
|||||
