南方医科大学学报 ›› 2025, Vol. 45 ›› Issue (4): 669-683.doi: 10.12122/j.issn.1673-4254.2025.04.01
• •
马振岩1( ), 阿鑫2, 赵蕾3, 张洪博3, 刘科1, 赵依晴1, 钱赓4()
收稿日期:2025-01-09
出版日期:2025-04-20
发布日期:2025-04-28
通讯作者:
钱赓
E-mail:mzy20130309@163.com;qiangeng9396@263.net
作者简介:马振岩,在读硕士研究生,E-mail: mzy20130309@163.com
基金资助:
Zhenyan MA1(), Xin A2, Lei ZHAO3, Hongbo ZHANG3, Ke LIU1, Yiqing ZHAO1, Geng QIAN4()
Received:2025-01-09
Online:2025-04-20
Published:2025-04-28
Contact:
Geng QIAN
E-mail:mzy20130309@163.com;qiangeng9396@263.net
摘要:
目的 基于急性ST段抬高型心肌梗死(STEMI)患者的心脏磁共振(CMR)参数构建左心室不良重构(LVAR)风险预测模型。 方法 前瞻性纳入2018年1月~2021年12月在8个医学中心接受直接经皮冠状动脉介入治疗(PCI)的急性STEMI患者329例。分别于PCI术后7±2 d及术后6个月进行CMR检查。采用CVI42软件分析CMR参数。LVAR定义为PCI术后6月左心室舒张末期容积较基线(术后7±2 d)增加超过20%,或左心室收缩末期容积较基线增加超过15%。所有患者按照7∶3的比例随机分为训练集(n=230)和验证集(n=99)。在训练集中,首先通过LASSO回归筛选出潜在的预测因子,然后进行单因素和多因素Logistic回归分析,以识别具有独立预测价值的变量,并构建列线图。通过受试者工作特征曲线、曲线下面积(AUC)、校准曲线和决策曲线分析,评估列线图在训练集和验证集中的区分度、校准度和临床应用价值。 结果 根据LVAR的定义,患者分为LVAR组(n=100,30.40%)和无重构组(n=229,69.60%)。LVAR组心血管主要不良事件发生率明显高于无重构组(58.00% vs 16.16%,P<0.001)。单因素和多因素Logistic回归分析发现,左心室整体纵向应变(LVGLS)[OR=0.76,95% CI (0.61-0.95),P=0.015]、左心房主动应变(LAAS)[OR=0.78,95% CI (0.67-0.92),P=0.003]是LVAR的保护因素。而梗死面积(IS)[OR=1.05,95% CI(1.01-1.10),P=0.017]、微血管阻塞(MVO)[OR=1.26,95% CI(1.01-1.59),P=0.048]是LVAR的危险因素。列线图在训练集中的AUC值为 0.90 (95% CI:0.86-0.94),在验证集中AUC值为 0.88 (95% CI:0.81-0.94)。 结论 本研究基于急性STEMI患者的CMR参数,识别出4个LVAR的独立预测因子:LVGLS、LAAS、IS、MVO。基于这4个变量构建的列线图预测性能良好,可为急性STEMI患者的临床管理和早期干预提供重要依据。
马振岩, 阿鑫, 赵蕾, 张洪博, 刘科, 赵依晴, 钱赓. 急性ST段抬高型心肌梗死经皮冠状动脉介入术后左心室不良重构的新型风险预测模型:基于心脏磁共振的多中心前瞻性研究[J]. 南方医科大学学报, 2025, 45(4): 669-683.
Zhenyan MA, Xin A, Lei ZHAO, Hongbo ZHANG, Ke LIU, Yiqing ZHAO, Geng QIAN. A cardiac magnetic resonance-based risk prediction model for left ventricular adverse remodeling following percutaneous coronary intervention for acute ST-segment elevation myocardial infarction: a multi-center prospective study[J]. Journal of Southern Medical University, 2025, 45(4): 669-683.
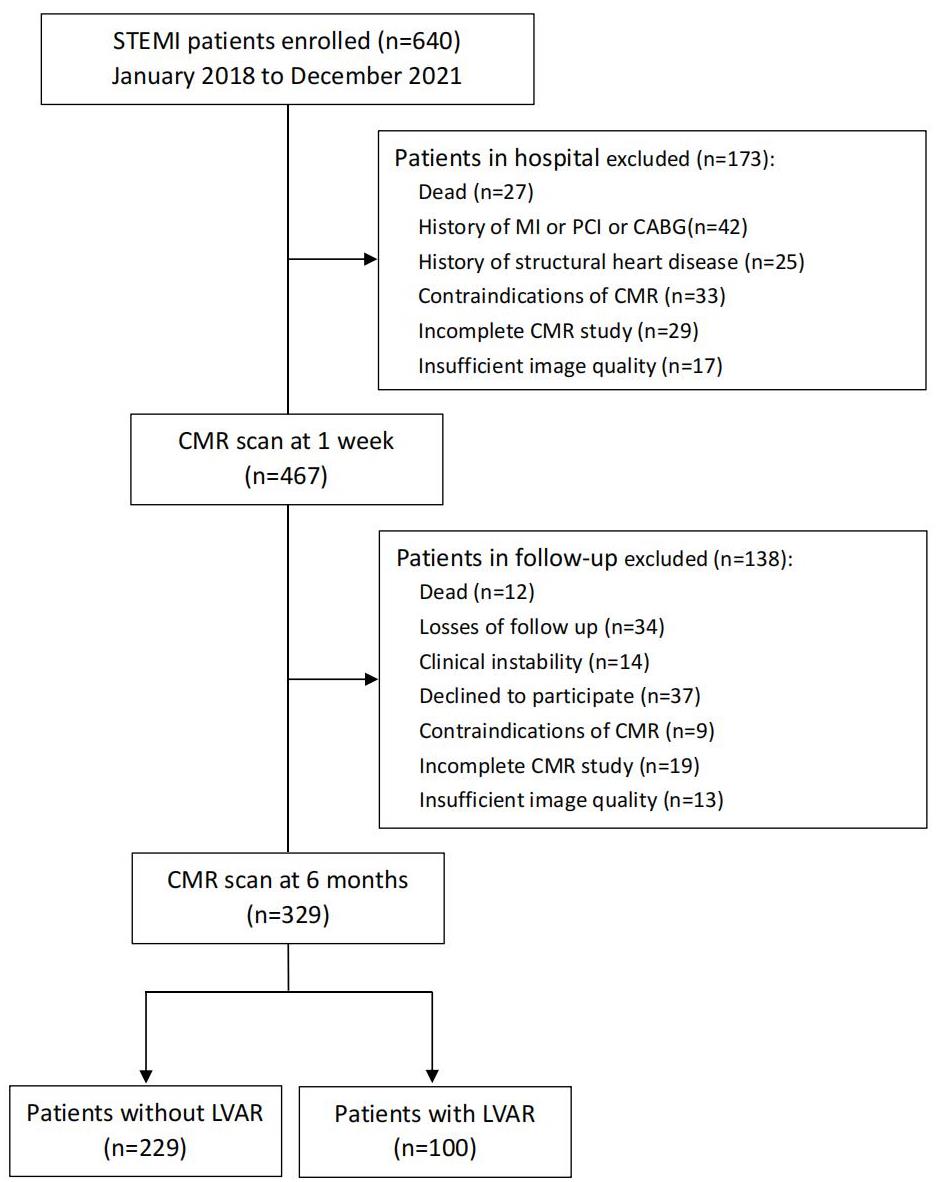
图1 患者入组流程图和分组结果
Fig.1 Flowchart of patient enrollment and grouping.
| Variables | Total (n=329) | Non-LVAR (n=229) | LVAR (n=100) | P |
|---|---|---|---|---|
| Demographics | ||||
| Age (year) | 58±10.8 | 58±10.6 | 58±11.5 | 0.944 |
| Female [n (%)] | 41 (12.46) | 32 (13.97) | 9 (9.00) | 0.209 |
| SBP (mmHg) | 125±20 | 126±20 | 124±18 | 0.445 |
| DBP (mmHg) | 76±13 | 76±13 | 77±14 | 0.244 |
| HR (beats/min) | 79±13 | 79±13 | 79±12 | 0.872 |
| BMI (kg/m2) | 25.4±3.3 | 25.4±3.3 | 25.4±3.3 | 0.939 |
| Killip classes | 0.330 | |||
| Ⅰ | 254 (77.20) | 182 (79.48) | 72 (72.00) | |
| Ⅱ | 64 (19.45) | 40 (17.47) | 24 (24.00) | |
| Ⅲ | 11 (3.34) | 7 (3.06) | 4 (4.00) | |
| Laboratory tests | ||||
| Hb (g/L) | 148.3±15.2 | 148.1±15.1 | 148.8±15.5 | 0.685 |
| WBC (109/L) | 10.81±3.46 | 10.39±3.27 | 11.79±3.69 | 0.001* |
| Glucose (mmol/L) | 8.26±3.59 | 8.04±3.23 | 8.75±4.27 | 0.100 |
| Cr (µmol/L) | 77.84±18.44 | 78.43±18.43 | 76.49±18.49 | 0.382 |
| LDL-C (mmol/L) | 3.09±0.94 | 3.10±0.90 | 3.07±1.01 | 0.789 |
| TC (mmol/L) | 4.60±1.12 | 4.63±1.11 | 4.54±1.14 | 0.515 |
| TG (mmol/L) | 1.63±0.96 | 1.68±1.03 | 1.51±0.77 | 0.145 |
| NT-proBNP (pg/mL) | 134.50 (51.50, 321.80) | 124.00 (51.64, 251.50) | 149.00 (50.72, 498.95) | 0.052 |
| Peak cTnT (ng/mL) | 9.95 (4.04, 24.76) | 8.22 (3.24, 21.80) | 18.92 (6.53, 40.85) | <0.001* |
| Peak CK-MB (ng/mL) | 165.80 (65.00, 257.00) | 143.70 (59.79, 238.20) | 216.40 (125.05, 301.50) | <0.001* |
| Medical history [n (%)] | ||||
| Hypertension | 179 (54.41) | 122 (53.28) | 57 (57.00) | 0.533 |
| Diabetes mellitus | 81 (24.62) | 57 (24.89) | 24 (24.00) | 0.863 |
| Hyperlipidemia | 141 (42.86) | 93 (40.61) | 48 (48.00) | 0.213 |
| Stroke | 19 (5.78) | 11 (4.80) | 8 (8.00) | 0.253 |
| Current smoker | 204 (62.01) | 142 (62.01) | 62 (62.00) | 0.999 |
| Medical therapy [n (%)] | ||||
| ACEI/ARB | 162 (49.24) | 115 (50.22) | 47 (47.00) | 0.591 |
| Beta-blocker | 267 (81.16) | 184 (80.35) | 83 (83.00) | 0.572 |
| MRA | 56 (17.02) | 35 (15.28) | 21 (21.00) | 0.204 |
| ARNI | 167 (50.76) | 114 (49.78) | 53 (53.00) | 0.591 |
| SGLT2I | 86 (26.14) | 61 (26.64) | 25 (25.00) | 0.756 |
| Antiplatelet agents | 329 (100) | 229 (100) | 100 (100.00) | 1.000 |
| Statin | 326 (99.09) | 227 (99.13) | 99 (99.00) | 1.000 |
| Angiographic features [n (%)] | ||||
| MI location | <0.001* | |||
| Anterior MI | 154 (46.81) | 90 (39.30) | 64 (64.00) | |
| Non-Anterior MI | 175 (53.19) | 139 (60.70) | 36 (36.00) | |
| Number of diseased vessels | 0.254 | |||
| 1 | 172 (52.28) | 113 (49.34) | 59 (59.00) | |
| 2 | 84 (25.53) | 61 (26.64) | 23 (23.00) | |
| 3 | 73 (22.19) | 55 (24.02) | 18 (18.00) | |
| Culprit vessel | <0.001* | |||
| LAD | 168 (51.06) | 101 (44.10) | 67 (67.00) | |
| LCX | 41 (12.46) | 30 (13.10) | 11 (11.00) | |
| RCA | 120 (36.47) | 98 (42.79) | 22 (22.00) | |
| Number of stents | 0.529 | |||
| 0 | 16 (4.86) | 9 (3.93) | 7 (7.00) | |
| 1 | 228 (69.30) | 162 (70.74) | 66 (66.00) | |
| 2 | 65 (19.76) | 43 (18.78) | 22 (22.00) | |
| 3 | 20 (6.08) | 15 (6.55) | 5 (5.00) | |
| TIMI flow before PCI | 0.096 | |||
| 0 | 254 (77.20) | 168 (73.36) | 86 (86.00) | |
| 1 | 12 (3.65) | 10 (4.37) | 2 (2.00) | |
| 2 | 27 (8.21) | 22 (9.61) | 5 (5.00) | |
| 3 | 36 (10.94) | 29 (12.66) | 7 (7.00) | |
| TIMI flow after PCI | 0.274 | |||
| 0 | 1 (0.30) | 1 (0.44) | 0 (0.00) | |
| 1 | 2 (0.61) | 1 (0.44) | 1 (1.00) | |
| 2 | 7 (2.13) | 3 (1.31) | 4 (4.00) | |
| 3 | 319 (96.96) | 224 (97.82) | 95 (95.00) |
表1 LVAR组与非重构组的临床基线数据比较
Tab.1 Comparison of clinical data between non-LVAR group and LVAR group
| Variables | Total (n=329) | Non-LVAR (n=229) | LVAR (n=100) | P |
|---|---|---|---|---|
| Demographics | ||||
| Age (year) | 58±10.8 | 58±10.6 | 58±11.5 | 0.944 |
| Female [n (%)] | 41 (12.46) | 32 (13.97) | 9 (9.00) | 0.209 |
| SBP (mmHg) | 125±20 | 126±20 | 124±18 | 0.445 |
| DBP (mmHg) | 76±13 | 76±13 | 77±14 | 0.244 |
| HR (beats/min) | 79±13 | 79±13 | 79±12 | 0.872 |
| BMI (kg/m2) | 25.4±3.3 | 25.4±3.3 | 25.4±3.3 | 0.939 |
| Killip classes | 0.330 | |||
| Ⅰ | 254 (77.20) | 182 (79.48) | 72 (72.00) | |
| Ⅱ | 64 (19.45) | 40 (17.47) | 24 (24.00) | |
| Ⅲ | 11 (3.34) | 7 (3.06) | 4 (4.00) | |
| Laboratory tests | ||||
| Hb (g/L) | 148.3±15.2 | 148.1±15.1 | 148.8±15.5 | 0.685 |
| WBC (109/L) | 10.81±3.46 | 10.39±3.27 | 11.79±3.69 | 0.001* |
| Glucose (mmol/L) | 8.26±3.59 | 8.04±3.23 | 8.75±4.27 | 0.100 |
| Cr (µmol/L) | 77.84±18.44 | 78.43±18.43 | 76.49±18.49 | 0.382 |
| LDL-C (mmol/L) | 3.09±0.94 | 3.10±0.90 | 3.07±1.01 | 0.789 |
| TC (mmol/L) | 4.60±1.12 | 4.63±1.11 | 4.54±1.14 | 0.515 |
| TG (mmol/L) | 1.63±0.96 | 1.68±1.03 | 1.51±0.77 | 0.145 |
| NT-proBNP (pg/mL) | 134.50 (51.50, 321.80) | 124.00 (51.64, 251.50) | 149.00 (50.72, 498.95) | 0.052 |
| Peak cTnT (ng/mL) | 9.95 (4.04, 24.76) | 8.22 (3.24, 21.80) | 18.92 (6.53, 40.85) | <0.001* |
| Peak CK-MB (ng/mL) | 165.80 (65.00, 257.00) | 143.70 (59.79, 238.20) | 216.40 (125.05, 301.50) | <0.001* |
| Medical history [n (%)] | ||||
| Hypertension | 179 (54.41) | 122 (53.28) | 57 (57.00) | 0.533 |
| Diabetes mellitus | 81 (24.62) | 57 (24.89) | 24 (24.00) | 0.863 |
| Hyperlipidemia | 141 (42.86) | 93 (40.61) | 48 (48.00) | 0.213 |
| Stroke | 19 (5.78) | 11 (4.80) | 8 (8.00) | 0.253 |
| Current smoker | 204 (62.01) | 142 (62.01) | 62 (62.00) | 0.999 |
| Medical therapy [n (%)] | ||||
| ACEI/ARB | 162 (49.24) | 115 (50.22) | 47 (47.00) | 0.591 |
| Beta-blocker | 267 (81.16) | 184 (80.35) | 83 (83.00) | 0.572 |
| MRA | 56 (17.02) | 35 (15.28) | 21 (21.00) | 0.204 |
| ARNI | 167 (50.76) | 114 (49.78) | 53 (53.00) | 0.591 |
| SGLT2I | 86 (26.14) | 61 (26.64) | 25 (25.00) | 0.756 |
| Antiplatelet agents | 329 (100) | 229 (100) | 100 (100.00) | 1.000 |
| Statin | 326 (99.09) | 227 (99.13) | 99 (99.00) | 1.000 |
| Angiographic features [n (%)] | ||||
| MI location | <0.001* | |||
| Anterior MI | 154 (46.81) | 90 (39.30) | 64 (64.00) | |
| Non-Anterior MI | 175 (53.19) | 139 (60.70) | 36 (36.00) | |
| Number of diseased vessels | 0.254 | |||
| 1 | 172 (52.28) | 113 (49.34) | 59 (59.00) | |
| 2 | 84 (25.53) | 61 (26.64) | 23 (23.00) | |
| 3 | 73 (22.19) | 55 (24.02) | 18 (18.00) | |
| Culprit vessel | <0.001* | |||
| LAD | 168 (51.06) | 101 (44.10) | 67 (67.00) | |
| LCX | 41 (12.46) | 30 (13.10) | 11 (11.00) | |
| RCA | 120 (36.47) | 98 (42.79) | 22 (22.00) | |
| Number of stents | 0.529 | |||
| 0 | 16 (4.86) | 9 (3.93) | 7 (7.00) | |
| 1 | 228 (69.30) | 162 (70.74) | 66 (66.00) | |
| 2 | 65 (19.76) | 43 (18.78) | 22 (22.00) | |
| 3 | 20 (6.08) | 15 (6.55) | 5 (5.00) | |
| TIMI flow before PCI | 0.096 | |||
| 0 | 254 (77.20) | 168 (73.36) | 86 (86.00) | |
| 1 | 12 (3.65) | 10 (4.37) | 2 (2.00) | |
| 2 | 27 (8.21) | 22 (9.61) | 5 (5.00) | |
| 3 | 36 (10.94) | 29 (12.66) | 7 (7.00) | |
| TIMI flow after PCI | 0.274 | |||
| 0 | 1 (0.30) | 1 (0.44) | 0 (0.00) | |
| 1 | 2 (0.61) | 1 (0.44) | 1 (1.00) | |
| 2 | 7 (2.13) | 3 (1.31) | 4 (4.00) | |
| 3 | 319 (96.96) | 224 (97.82) | 95 (95.00) |
| Variables | Total (n=329) | Non-LVAR (n=229) | LVAR (n=100) | P |
|---|---|---|---|---|
| LVEDV (mL) | 145.05±35.60 | 145.78±34.57 | 143.37±37.98 | 0.572 |
| LVESV (mL) | 78.00±28.43 | 75.06±26.68 | 84.74±31.17 | 0.004* |
| LVSV (mL) | 67.07±16.48 | 70.76±15.43 | 58.62±15.74 | <0.001* |
| LVEF (%) | 46.99±8.98 | 49.41±8.05 | 41.47±8.58 | <0.001* |
| LVM (g) | 115.61±26.04 | 113.16±25.97 | 121.21±25.43 | 0.010* |
| LVGLS (%) | 11.19±3.24 | 12.24±2.90 | 8.77±2.60 | <0.001* |
| LVGCS (%) | 14.07±3.13 | 14.93±2.87 | 12.08±2.78 | <0.001* |
| LVGRS (%) | 22.14±6.39 | 23.89±6.08 | 18.13±5.17 | <0.001* |
| RVEDV (mL) | 113.94±29.61 | 116.77±30.24 | 107.46±27.17 | 0.008* |
| RVESV (mL) | 61.54±20.58 | 62.22±21.13 | 59.98±19.28 | 0.364 |
| RVSV (mL) | 52.41±16.46 | 54.55±16.04 | 47.51±16.43 | <0.001* |
| RVM (g) | 26.45±5.79 | 26.18±6.13 | 27.08±4.90 | 0.195 |
| RVEF (%) | 46.13±9.70 | 47.04±9.08 | 44.03±10.73 | 0.009* |
| RVGLS (%) | 17.68±5.51 | 18.72±5.10 | 15.29±5.71 | <0.001* |
| RVGCS (%) | 14.63±3.45 | 14.84±3.27 | 14.14±3.82 | 0.113 |
| RVGRS (%) | 25.32±8.59 | 25.45±8.26 | 25.01±9.34 | 0.670 |
| LAVmax (mL) | 65.63±20.72 | 66.56±20.22 | 63.51±21.78 | 0.221 |
| LAVpac (mL) | 48.08±17.47 | 48.24±16.83 | 47.69±18.94 | 0.791 |
| LAVmin (mL) | 32.88±14.98 | 32.12±14.16 | 34.62±16.65 | 0.164 |
| LAEF total (%) | 50.76±8.34 | 52.63±7.26 | 46.50±9.10 | <0.001* |
| LAEF passive (%) | 27.30±6.15 | 28.03±5.75 | 25.61±6.72 | <0.001* |
| LAEF active (%) | 32.52±7.71 | 34.33±7.00 | 28.37±7.68 | <0.001* |
| LATS (%) | 25.56±8.90 | 28.06±8.30 | 19.83±7.51 | <0.001* |
| LAPS (%) | 13.69±5.66 | 14.99±5.59 | 10.72±4.62 | <0.001* |
| LAAS (%) | 11.86±4.42 | 13.06±4.15 | 9.11±3.74 | <0.001* |
| RAVmax (mL) | 58.50±16.73 | 59.90±17.05 | 55.29±15.56 | 0.021* |
| RAVpac (mL) | 42.33±12.37 | 43.03±12.54 | 40.74±11.89 | 0.123 |
| RAVmin (mL) | 29.19±9.51 | 29.15±9.25 | 29.26±10.13 | 0.925 |
| RAEF total (%) | 50.02±7.17 | 51.26±6.56 | 47.17±7.70 | <0.001* |
| RAEF passive (%) | 27.46±5.80 | 28.01±5.67 | 26.19±5.92 | 0.009* |
| RAEF active (%) | 31.20±7.08 | 32.34±6.74 | 28.59±7.17 | <0.001* |
| RATS (%) | 28.30±11.68 | 31.27±10.95 | 21.51±10.46 | <0.001* |
| RAPS (%) | 16.24±7.69 | 17.94±7.34 | 12.35±7.06 | <0.001* |
| RAAS (%) | 12.07±5.60 | 13.33±5.57 | 9.17±4.48 | <0.001* |
| IS (%) | 23.00±11.92 | 19.08±10.34 | 31.97±10.37 | <0.001* |
| MVO (%) | 0.00 (0.00 2.95) | 0.00 (0.00 0.83) | 3.34 (1.43 5.82) | <0.001* |
| IMH [n (%)] | 118 (35.87) | 49 (21.40) | 69 (69.00) | <0.001* |
表2 LVAR组与非重构组的CMR参数比较
Tab.2 Comparison of cardiac magnetic resonance (CMR) parameters between non-LVAR group and LVAR group
| Variables | Total (n=329) | Non-LVAR (n=229) | LVAR (n=100) | P |
|---|---|---|---|---|
| LVEDV (mL) | 145.05±35.60 | 145.78±34.57 | 143.37±37.98 | 0.572 |
| LVESV (mL) | 78.00±28.43 | 75.06±26.68 | 84.74±31.17 | 0.004* |
| LVSV (mL) | 67.07±16.48 | 70.76±15.43 | 58.62±15.74 | <0.001* |
| LVEF (%) | 46.99±8.98 | 49.41±8.05 | 41.47±8.58 | <0.001* |
| LVM (g) | 115.61±26.04 | 113.16±25.97 | 121.21±25.43 | 0.010* |
| LVGLS (%) | 11.19±3.24 | 12.24±2.90 | 8.77±2.60 | <0.001* |
| LVGCS (%) | 14.07±3.13 | 14.93±2.87 | 12.08±2.78 | <0.001* |
| LVGRS (%) | 22.14±6.39 | 23.89±6.08 | 18.13±5.17 | <0.001* |
| RVEDV (mL) | 113.94±29.61 | 116.77±30.24 | 107.46±27.17 | 0.008* |
| RVESV (mL) | 61.54±20.58 | 62.22±21.13 | 59.98±19.28 | 0.364 |
| RVSV (mL) | 52.41±16.46 | 54.55±16.04 | 47.51±16.43 | <0.001* |
| RVM (g) | 26.45±5.79 | 26.18±6.13 | 27.08±4.90 | 0.195 |
| RVEF (%) | 46.13±9.70 | 47.04±9.08 | 44.03±10.73 | 0.009* |
| RVGLS (%) | 17.68±5.51 | 18.72±5.10 | 15.29±5.71 | <0.001* |
| RVGCS (%) | 14.63±3.45 | 14.84±3.27 | 14.14±3.82 | 0.113 |
| RVGRS (%) | 25.32±8.59 | 25.45±8.26 | 25.01±9.34 | 0.670 |
| LAVmax (mL) | 65.63±20.72 | 66.56±20.22 | 63.51±21.78 | 0.221 |
| LAVpac (mL) | 48.08±17.47 | 48.24±16.83 | 47.69±18.94 | 0.791 |
| LAVmin (mL) | 32.88±14.98 | 32.12±14.16 | 34.62±16.65 | 0.164 |
| LAEF total (%) | 50.76±8.34 | 52.63±7.26 | 46.50±9.10 | <0.001* |
| LAEF passive (%) | 27.30±6.15 | 28.03±5.75 | 25.61±6.72 | <0.001* |
| LAEF active (%) | 32.52±7.71 | 34.33±7.00 | 28.37±7.68 | <0.001* |
| LATS (%) | 25.56±8.90 | 28.06±8.30 | 19.83±7.51 | <0.001* |
| LAPS (%) | 13.69±5.66 | 14.99±5.59 | 10.72±4.62 | <0.001* |
| LAAS (%) | 11.86±4.42 | 13.06±4.15 | 9.11±3.74 | <0.001* |
| RAVmax (mL) | 58.50±16.73 | 59.90±17.05 | 55.29±15.56 | 0.021* |
| RAVpac (mL) | 42.33±12.37 | 43.03±12.54 | 40.74±11.89 | 0.123 |
| RAVmin (mL) | 29.19±9.51 | 29.15±9.25 | 29.26±10.13 | 0.925 |
| RAEF total (%) | 50.02±7.17 | 51.26±6.56 | 47.17±7.70 | <0.001* |
| RAEF passive (%) | 27.46±5.80 | 28.01±5.67 | 26.19±5.92 | 0.009* |
| RAEF active (%) | 31.20±7.08 | 32.34±6.74 | 28.59±7.17 | <0.001* |
| RATS (%) | 28.30±11.68 | 31.27±10.95 | 21.51±10.46 | <0.001* |
| RAPS (%) | 16.24±7.69 | 17.94±7.34 | 12.35±7.06 | <0.001* |
| RAAS (%) | 12.07±5.60 | 13.33±5.57 | 9.17±4.48 | <0.001* |
| IS (%) | 23.00±11.92 | 19.08±10.34 | 31.97±10.37 | <0.001* |
| MVO (%) | 0.00 (0.00 2.95) | 0.00 (0.00 0.83) | 3.34 (1.43 5.82) | <0.001* |
| IMH [n (%)] | 118 (35.87) | 49 (21.40) | 69 (69.00) | <0.001* |
| Variables | Total (n=329) | Training set (n=230) | Validation set (n=99) | P |
|---|---|---|---|---|
| Baseline data | ||||
| Age (year) | 58±10.8 | 58±10.9 | 57±10.8 | 0.423 |
| SBP (mmHg) | 125.29±19.60 | 125.69±19.34 | 124.37±20.26 | 0.578 |
| DBP (mmHg) | 76.26±13.45 | 76.67±13.27 | 75.31±13.88 | 0.402 |
| HR (beats/min) | 78.89±12.57 | 79.19±12.38 | 78.20±13.04 | 0.515 |
| BMI (kg/m2) | 25.38±3.30 | 25.26±3.12 | 25.64±3.68 | 0.369 |
| Hb (g/L) | 148.27±15.22 | 148.05±15.11 | 148.79±15.51 | 0.685 |
| WBC (109/L) | 10.81±3.46 | 10.69±3.59 | 11.09±3.12 | 0.339 |
| Glu (mmol/L) | 8.26±3.59 | 8.44±3.72 | 7.83±3.23 | 0.155 |
| Cr (µmol/L) | 77.84±18.44 | 77.84±19.11 | 77.84±16.89 | 0.999 |
| LDL-C (mmol/L) | 3.09±0.94 | 3.04±0.95 | 3.19±0.91 | 0.175 |
| TC (mmol/L) | 4.60±1.12 | 4.55±1.08 | 4.71±1.19 | 0.226 |
| TG (mmol/L) | 1.63±0.96 | 1.63±0.97 | 1.64±0.93 | 0.940 |
| NT-proBNP (pg/mL) | 146.50(58.00, 331.70) | 149.00(61.03, 343.73) | 145.50(53.95, 280.15) | 0.507 |
| Peak cTnT (ng/mL) | 9.98 (4.04, 24.86) | 10.26 (4.34, 24.49) | 7.86 (3.87, 31.57) | 0.702 |
| Peak CK-MB (ng/mL) | 165.00(64.78, 256.30) | 157.05(65.25, 248.52) | 177.90(63.20, 267.50) | 0.518 |
| LVAR [n (%)] | 100 (30.40) | 71 (30.87) | 29 (29.29) | 0.775 |
| Female [n (%)] | 41 (12.46) | 28 (12.17) | 13 (13.13) | 0.809 |
| MI location [n (%)] | 0.573 | |||
| Non-anterior MI | 175 (53.19) | 120 (52.17) | 55 (55.56) | |
| Anterior MI | 154 (46.81) | 110 (47.83) | 44 (44.44) | |
| Hypertension [n (%)] | 179 (54.41) | 128 (55.65) | 51 (51.52) | 0.490 |
| Diabetes [n (%)] | 81 (24.62) | 63 (27.39) | 18 (18.18) | 0.075 |
| Hyperlipidemia [n (%)] | 141 (42.86) | 99 (43.04) | 42 (42.42) | 0.917 |
| Stroke [n (%)] | 19 (5.78) | 13 (5.65) | 6 (6.06) | 0.884 |
| Smoking [n (%)] | 204 (62.01) | 138 (60.00) | 66 (66.67) | 0.253 |
| ACEI/ARB [n (%)] | 162 (49.24) | 113 (49.13) | 49 (49.49) | 0.956 |
| Beta-blocker [n (%)] | 267 (81.16) | 186 (80.87) | 81 (81.82) | 0.847 |
| MRA [n (%)] | 56 (17.02) | 39 (16.96) | 17 (17.17) | 0.967 |
| ARNI [n (%)] | 167 (50.76) | 117 (50.87) | 50 (50.51) | 0.954 |
| SGLT2I [n (%)] | 86 (26.14) | 60 (26.09) | 26 (26.26) | 0.976 |
| Antiplatelet agents [n (%)] | 329 (100) | 230 (100) | 99 (100) | 1.000 |
| Statin [n (%)] | 326 (99.09) | 228 (99.13) | 98 (98.99) | 0.899 |
| Killip [n (%)] | 0.411 | |||
| Ⅰ | 254 (77.20) | 173 (75.22) | 81 (81.82) | |
| Ⅱ | 64 (19.45) | 49 (21.30) | 15 (15.15) | |
| Ⅲ | 11 (3.34) | 8 (3.48) | 3 (3.03) | |
| Number of vessels diseased [n (%)] | 0.678 | |||
| 1 | 172 (52.28) | 116(50.44) | 56 (56.57) | |
| 2 | 84 (25.53) | 61 (26.52) | 23 (23.23) | |
| 3 | 73 (22.19) | 53(23.04) | 20 (20.20) | |
| Culprit vessel [n (%)] | 0.974 | |||
| 1 | 168 (51.06) | 118 (51.30) | 50 (50.51) | |
| 2 | 41 (12.46) | 29 (12.61) | 12 (12.12) | |
| 3 | 120 (36.47) | 83 (36.09) | 37 (37.37) | |
| Number of stents [n (%)] | 0.071 | |||
| 0 | 16 (4.86) | 13 (5.65) | 3 (3.03) | |
| 1 | 228 (69.30) | 162 (70.43) | 66 (66.67) | |
| 2 | 65 (19.76) | 46 (20.00) | 19 (19.19) | |
| 3 | 20 (6.08) | 9 (3.91) | 11 (11.11) | |
| TIMI before PCI [n (%)] | 0.083 | |||
| 0 | 254 (77.20) | 182 (79.13) | 72 (72.73) | |
| 1 | 12 (3.65) | 9 (3.91) | 3 (3.03) | |
| 2 | 27 (8.21) | 13 (5.65) | 14 (14.14) | |
| 3 | 36 (10.94) | 26 (11.30) | 10 (10.10) | |
| TIMI after PCI [n (%)] | 0.891 | |||
| 0 | 1 (0.30) | 1 (0.43) | 0 (0.00) | |
| 1 | 2 (0.61) | 1 (0.43) | 1 (1.01) | |
| 2 | 7 (2.13) | 5 (2.17) | 2 (2.02) | |
| 3 | 319 (96.96) | 223 (96.96) | 96 (96.97) | |
| CMR parameters | ||||
| LVEDV (mL) | 145.05±35.60 | 145.84±35.60 | 143.20±35.72 | 0.538 |
| LVESV (mL) | 78.00±28.43 | 78.20±29.44 | 77.53±26.05 | 0.846 |
| LVSV (mL) | 67.07±16.48 | 67.67±16.17 | 65.67±17.17 | 0.313 |
| LVEF (%) | 46.99±8.98 | 47.25±9.18 | 46.39±8.51 | 0.427 |
| LVM (g) | 115.61±26.04 | 115.26±25.80 | 116.40±26.69 | 0.718 |
| RVEDV (mL) | 113.94±29.61 | 113.81±28.94 | 114.25±31.26 | 0.901 |
| RVESV (mL) | 61.54±20.58 | 61.17±19.88 | 62.41±22.19 | 0.616 |
| RVSV (mL) | 52.41±16.46 | 52.65±16.52 | 51.84±16.40 | 0.680 |
| RVM (g) | 26.45±5.79 | 26.23±5.52 | 26.97±6.39 | 0.283 |
| RVEF (%) | 46.19±9.51 | 46.41±9.63 | 45.70±9.25 | 0.536 |
| IS (%) | 23.00±11.92 | 22.91±11.91 | 23.22±12.00 | 0.829 |
| LVGLS (%) | 11.19±3.24 | 11.20±3.19 | 11.15±3.36 | 0.909 |
| LVGCS (%) | 14.07±3.13 | 14.18±3.11 | 13.80±3.18 | 0.312 |
| LVGRS (%) | 22.14±6.39 | 22.43±6.42 | 21.46±6.29 | 0.206 |
| RVGLS (%) | 17.68±5.51 | 17.94±5.63 | 17.09±5.23 | 0.201 |
| RVGCS (%) | 14.63±3.45 | 14.79±3.47 | 14.26±3.40 | 0.203 |
| RVGRS (%) | 25.15±7.41 | 25.46±7.64 | 24.45±6.82 | 0.255 |
| LAVmax (mL) | 65.63±20.72 | 66.33±21.38 | 64.00±19.09 | 0.349 |
| LAVpac (mL) | 48.08±17.47 | 48.57±17.95 | 46.93±16.33 | 0.435 |
| LAVmin (mL) | 32.88±14.98 | 33.26±15.06 | 32.02±14.83 | 0.494 |
| LAEF total (%) | 50.76±8.34 | 50.73±8.53 | 50.85±7.91 | 0.907 |
| LAEF passive (%) | 27.30±6.15 | 27.37±6.37 | 27.12±5.66 | 0.737 |
| LAEF active (%) | 32.52±7.71 | 32.41±7.91 | 32.78±7.24 | 0.694 |
| LATS (%) | 25.56±8.90 | 25.63±8.80 | 25.38±9.17 | 0.812 |
| LAPS (%) | 13.69±5.66 | 13.81±5.55 | 13.42±5.93 | 0.571 |
| LAAS (%) | 11.86±4.42 | 11.82±4.43 | 11.96±4.39 | 0.801 |
| RAVmax (mL) | 58.50±16.73 | 58.98±17.22 | 57.38±15.54 | 0.428 |
| RAVpac (mL) | 42.33±12.37 | 42.83±12.72 | 41.17±11.50 | 0.266 |
| RAVmin (mL) | 29.19±9.51 | 29.56±9.57 | 28.32±9.36 | 0.279 |
| RAEF total (%) | 50.02±7.17 | 49.77±7.10 | 50.59±7.32 | 0.342 |
| RAEF passive (%) | 27.46±5.80 | 27.22±5.65 | 28.01±6.13 | 0.256 |
| RAEF active (%) | 31.20±7.08 | 31.11±6.84 | 31.41±7.65 | 0.724 |
| RATS (%) | 28.30±11.68 | 27.90±11.48 | 29.23±12.16 | 0.345 |
| RAPS (%) | 16.24±7.69 | 16.06±7.43 | 16.67±8.29 | 0.509 |
| RAAS (%) | 12.07±5.60 | 11.85±5.69 | 12.57±5.35 | 0.281 |
| MVO (%) | 0.00 (0.00, 2.95) | 0.00 (0.00, 2.98) | 0.00 (0.00, 2.75) | 0.701 |
| IMH [n (%)] | 119 (36.17) | 81 (35.22) | 38 (38.38) | 0.573 |
表3 训练集与验证集的基线数据和CMR参数比较
Tab.3 Comparison of baseline data and CMR parameters between the training set and validation set
| Variables | Total (n=329) | Training set (n=230) | Validation set (n=99) | P |
|---|---|---|---|---|
| Baseline data | ||||
| Age (year) | 58±10.8 | 58±10.9 | 57±10.8 | 0.423 |
| SBP (mmHg) | 125.29±19.60 | 125.69±19.34 | 124.37±20.26 | 0.578 |
| DBP (mmHg) | 76.26±13.45 | 76.67±13.27 | 75.31±13.88 | 0.402 |
| HR (beats/min) | 78.89±12.57 | 79.19±12.38 | 78.20±13.04 | 0.515 |
| BMI (kg/m2) | 25.38±3.30 | 25.26±3.12 | 25.64±3.68 | 0.369 |
| Hb (g/L) | 148.27±15.22 | 148.05±15.11 | 148.79±15.51 | 0.685 |
| WBC (109/L) | 10.81±3.46 | 10.69±3.59 | 11.09±3.12 | 0.339 |
| Glu (mmol/L) | 8.26±3.59 | 8.44±3.72 | 7.83±3.23 | 0.155 |
| Cr (µmol/L) | 77.84±18.44 | 77.84±19.11 | 77.84±16.89 | 0.999 |
| LDL-C (mmol/L) | 3.09±0.94 | 3.04±0.95 | 3.19±0.91 | 0.175 |
| TC (mmol/L) | 4.60±1.12 | 4.55±1.08 | 4.71±1.19 | 0.226 |
| TG (mmol/L) | 1.63±0.96 | 1.63±0.97 | 1.64±0.93 | 0.940 |
| NT-proBNP (pg/mL) | 146.50(58.00, 331.70) | 149.00(61.03, 343.73) | 145.50(53.95, 280.15) | 0.507 |
| Peak cTnT (ng/mL) | 9.98 (4.04, 24.86) | 10.26 (4.34, 24.49) | 7.86 (3.87, 31.57) | 0.702 |
| Peak CK-MB (ng/mL) | 165.00(64.78, 256.30) | 157.05(65.25, 248.52) | 177.90(63.20, 267.50) | 0.518 |
| LVAR [n (%)] | 100 (30.40) | 71 (30.87) | 29 (29.29) | 0.775 |
| Female [n (%)] | 41 (12.46) | 28 (12.17) | 13 (13.13) | 0.809 |
| MI location [n (%)] | 0.573 | |||
| Non-anterior MI | 175 (53.19) | 120 (52.17) | 55 (55.56) | |
| Anterior MI | 154 (46.81) | 110 (47.83) | 44 (44.44) | |
| Hypertension [n (%)] | 179 (54.41) | 128 (55.65) | 51 (51.52) | 0.490 |
| Diabetes [n (%)] | 81 (24.62) | 63 (27.39) | 18 (18.18) | 0.075 |
| Hyperlipidemia [n (%)] | 141 (42.86) | 99 (43.04) | 42 (42.42) | 0.917 |
| Stroke [n (%)] | 19 (5.78) | 13 (5.65) | 6 (6.06) | 0.884 |
| Smoking [n (%)] | 204 (62.01) | 138 (60.00) | 66 (66.67) | 0.253 |
| ACEI/ARB [n (%)] | 162 (49.24) | 113 (49.13) | 49 (49.49) | 0.956 |
| Beta-blocker [n (%)] | 267 (81.16) | 186 (80.87) | 81 (81.82) | 0.847 |
| MRA [n (%)] | 56 (17.02) | 39 (16.96) | 17 (17.17) | 0.967 |
| ARNI [n (%)] | 167 (50.76) | 117 (50.87) | 50 (50.51) | 0.954 |
| SGLT2I [n (%)] | 86 (26.14) | 60 (26.09) | 26 (26.26) | 0.976 |
| Antiplatelet agents [n (%)] | 329 (100) | 230 (100) | 99 (100) | 1.000 |
| Statin [n (%)] | 326 (99.09) | 228 (99.13) | 98 (98.99) | 0.899 |
| Killip [n (%)] | 0.411 | |||
| Ⅰ | 254 (77.20) | 173 (75.22) | 81 (81.82) | |
| Ⅱ | 64 (19.45) | 49 (21.30) | 15 (15.15) | |
| Ⅲ | 11 (3.34) | 8 (3.48) | 3 (3.03) | |
| Number of vessels diseased [n (%)] | 0.678 | |||
| 1 | 172 (52.28) | 116(50.44) | 56 (56.57) | |
| 2 | 84 (25.53) | 61 (26.52) | 23 (23.23) | |
| 3 | 73 (22.19) | 53(23.04) | 20 (20.20) | |
| Culprit vessel [n (%)] | 0.974 | |||
| 1 | 168 (51.06) | 118 (51.30) | 50 (50.51) | |
| 2 | 41 (12.46) | 29 (12.61) | 12 (12.12) | |
| 3 | 120 (36.47) | 83 (36.09) | 37 (37.37) | |
| Number of stents [n (%)] | 0.071 | |||
| 0 | 16 (4.86) | 13 (5.65) | 3 (3.03) | |
| 1 | 228 (69.30) | 162 (70.43) | 66 (66.67) | |
| 2 | 65 (19.76) | 46 (20.00) | 19 (19.19) | |
| 3 | 20 (6.08) | 9 (3.91) | 11 (11.11) | |
| TIMI before PCI [n (%)] | 0.083 | |||
| 0 | 254 (77.20) | 182 (79.13) | 72 (72.73) | |
| 1 | 12 (3.65) | 9 (3.91) | 3 (3.03) | |
| 2 | 27 (8.21) | 13 (5.65) | 14 (14.14) | |
| 3 | 36 (10.94) | 26 (11.30) | 10 (10.10) | |
| TIMI after PCI [n (%)] | 0.891 | |||
| 0 | 1 (0.30) | 1 (0.43) | 0 (0.00) | |
| 1 | 2 (0.61) | 1 (0.43) | 1 (1.01) | |
| 2 | 7 (2.13) | 5 (2.17) | 2 (2.02) | |
| 3 | 319 (96.96) | 223 (96.96) | 96 (96.97) | |
| CMR parameters | ||||
| LVEDV (mL) | 145.05±35.60 | 145.84±35.60 | 143.20±35.72 | 0.538 |
| LVESV (mL) | 78.00±28.43 | 78.20±29.44 | 77.53±26.05 | 0.846 |
| LVSV (mL) | 67.07±16.48 | 67.67±16.17 | 65.67±17.17 | 0.313 |
| LVEF (%) | 46.99±8.98 | 47.25±9.18 | 46.39±8.51 | 0.427 |
| LVM (g) | 115.61±26.04 | 115.26±25.80 | 116.40±26.69 | 0.718 |
| RVEDV (mL) | 113.94±29.61 | 113.81±28.94 | 114.25±31.26 | 0.901 |
| RVESV (mL) | 61.54±20.58 | 61.17±19.88 | 62.41±22.19 | 0.616 |
| RVSV (mL) | 52.41±16.46 | 52.65±16.52 | 51.84±16.40 | 0.680 |
| RVM (g) | 26.45±5.79 | 26.23±5.52 | 26.97±6.39 | 0.283 |
| RVEF (%) | 46.19±9.51 | 46.41±9.63 | 45.70±9.25 | 0.536 |
| IS (%) | 23.00±11.92 | 22.91±11.91 | 23.22±12.00 | 0.829 |
| LVGLS (%) | 11.19±3.24 | 11.20±3.19 | 11.15±3.36 | 0.909 |
| LVGCS (%) | 14.07±3.13 | 14.18±3.11 | 13.80±3.18 | 0.312 |
| LVGRS (%) | 22.14±6.39 | 22.43±6.42 | 21.46±6.29 | 0.206 |
| RVGLS (%) | 17.68±5.51 | 17.94±5.63 | 17.09±5.23 | 0.201 |
| RVGCS (%) | 14.63±3.45 | 14.79±3.47 | 14.26±3.40 | 0.203 |
| RVGRS (%) | 25.15±7.41 | 25.46±7.64 | 24.45±6.82 | 0.255 |
| LAVmax (mL) | 65.63±20.72 | 66.33±21.38 | 64.00±19.09 | 0.349 |
| LAVpac (mL) | 48.08±17.47 | 48.57±17.95 | 46.93±16.33 | 0.435 |
| LAVmin (mL) | 32.88±14.98 | 33.26±15.06 | 32.02±14.83 | 0.494 |
| LAEF total (%) | 50.76±8.34 | 50.73±8.53 | 50.85±7.91 | 0.907 |
| LAEF passive (%) | 27.30±6.15 | 27.37±6.37 | 27.12±5.66 | 0.737 |
| LAEF active (%) | 32.52±7.71 | 32.41±7.91 | 32.78±7.24 | 0.694 |
| LATS (%) | 25.56±8.90 | 25.63±8.80 | 25.38±9.17 | 0.812 |
| LAPS (%) | 13.69±5.66 | 13.81±5.55 | 13.42±5.93 | 0.571 |
| LAAS (%) | 11.86±4.42 | 11.82±4.43 | 11.96±4.39 | 0.801 |
| RAVmax (mL) | 58.50±16.73 | 58.98±17.22 | 57.38±15.54 | 0.428 |
| RAVpac (mL) | 42.33±12.37 | 42.83±12.72 | 41.17±11.50 | 0.266 |
| RAVmin (mL) | 29.19±9.51 | 29.56±9.57 | 28.32±9.36 | 0.279 |
| RAEF total (%) | 50.02±7.17 | 49.77±7.10 | 50.59±7.32 | 0.342 |
| RAEF passive (%) | 27.46±5.80 | 27.22±5.65 | 28.01±6.13 | 0.256 |
| RAEF active (%) | 31.20±7.08 | 31.11±6.84 | 31.41±7.65 | 0.724 |
| RATS (%) | 28.30±11.68 | 27.90±11.48 | 29.23±12.16 | 0.345 |
| RAPS (%) | 16.24±7.69 | 16.06±7.43 | 16.67±8.29 | 0.509 |
| RAAS (%) | 12.07±5.60 | 11.85±5.69 | 12.57±5.35 | 0.281 |
| MVO (%) | 0.00 (0.00, 2.95) | 0.00 (0.00, 2.98) | 0.00 (0.00, 2.75) | 0.701 |
| IMH [n (%)] | 119 (36.17) | 81 (35.22) | 38 (38.38) | 0.573 |
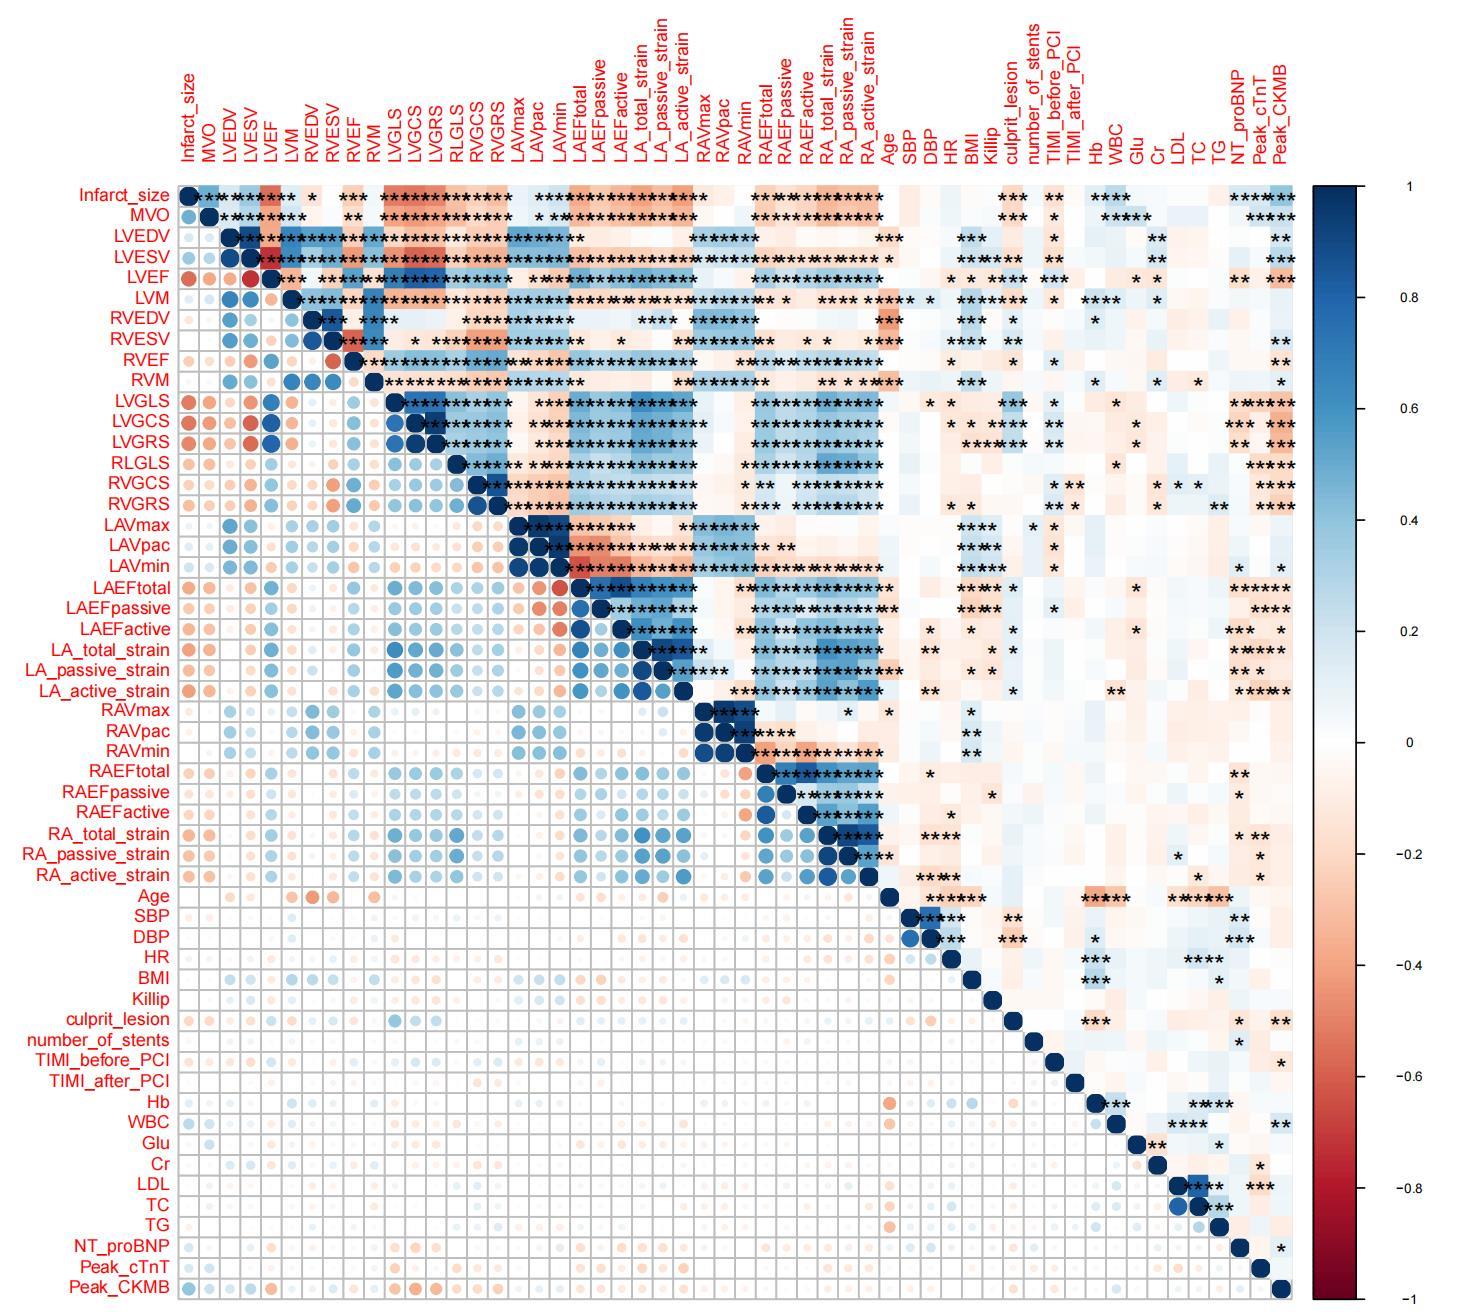
图2 训练集中各参数的相关性热图
Fig.2 Heatmap of parameter correlations in the training set.
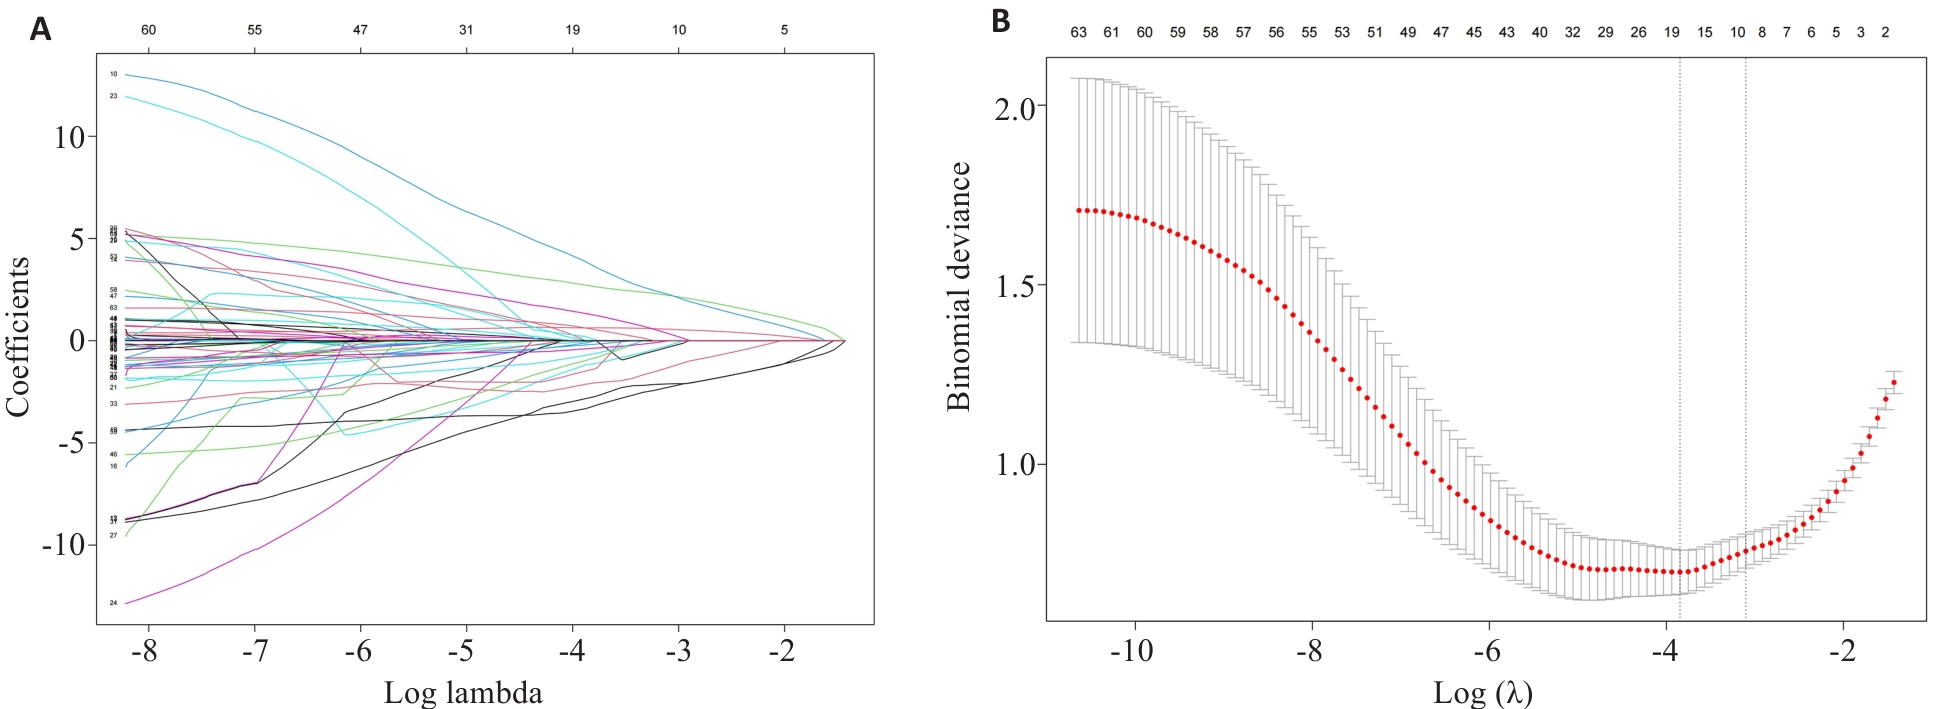
图3 LASSO回归分析
Fig.3 LASSO regression analysis. A: LASSO coefficient profiles of 63 features. B: LASSO cross-validation plot
| Parameter | Univariate | Multivariate | ||||
|---|---|---|---|---|---|---|
| OR | 95% CI | P | OR | 95% CI | P | |
| IMH | 10.50 | 5.33-20.69 | <0.001* | 2.06 | 0.74-5.99 | 0.185 |
| IS | 1.11 | 1.07-1.15 | <0.001* | 1.05 | 1.01-1.10 | 0.017 |
| MVO | 1.67 | 1.42-1.97 | <0.001* | 1.26 | 1.01-1.59 | 0.048 |
| LVEDV | 0.99 | 0.99-1.00 | 0.257 | |||
| LVGLS | 0.63 | 0.55-0.72 | <0.001* | 0.76 | 0.61-0.95 | 0.015 |
| LAVmax | 0.99 | 0.97-1.00 | 0.079 | |||
| LVEF | 0.89 | 0.86-0.93 | <0.001* | 1.04 | 0.97-1.12 | 0.248 |
| LAAS | 0.68 | 0.61-0.77 | <0.001* | 0.78 | 0.67-0.92 | 0.003 |
| LATS | 0.92 | 0.89-0.95 | <0.001* | 1.00 | 0.95-1.04 | 0.853 |
| Peak cTnT | 1.01 | 1.01-1.01 | 0.017* | 1.00 | 0.99-1.01 | 0.730 |
表4 LVAR预测因子的识别:单因素和多因素Logistic回归分析
Tab.4 Identification of the predictors for LVAR using univariate and multivariate logistic regression analyses
| Parameter | Univariate | Multivariate | ||||
|---|---|---|---|---|---|---|
| OR | 95% CI | P | OR | 95% CI | P | |
| IMH | 10.50 | 5.33-20.69 | <0.001* | 2.06 | 0.74-5.99 | 0.185 |
| IS | 1.11 | 1.07-1.15 | <0.001* | 1.05 | 1.01-1.10 | 0.017 |
| MVO | 1.67 | 1.42-1.97 | <0.001* | 1.26 | 1.01-1.59 | 0.048 |
| LVEDV | 0.99 | 0.99-1.00 | 0.257 | |||
| LVGLS | 0.63 | 0.55-0.72 | <0.001* | 0.76 | 0.61-0.95 | 0.015 |
| LAVmax | 0.99 | 0.97-1.00 | 0.079 | |||
| LVEF | 0.89 | 0.86-0.93 | <0.001* | 1.04 | 0.97-1.12 | 0.248 |
| LAAS | 0.68 | 0.61-0.77 | <0.001* | 0.78 | 0.67-0.92 | 0.003 |
| LATS | 0.92 | 0.89-0.95 | <0.001* | 1.00 | 0.95-1.04 | 0.853 |
| Peak cTnT | 1.01 | 1.01-1.01 | 0.017* | 1.00 | 0.99-1.01 | 0.730 |
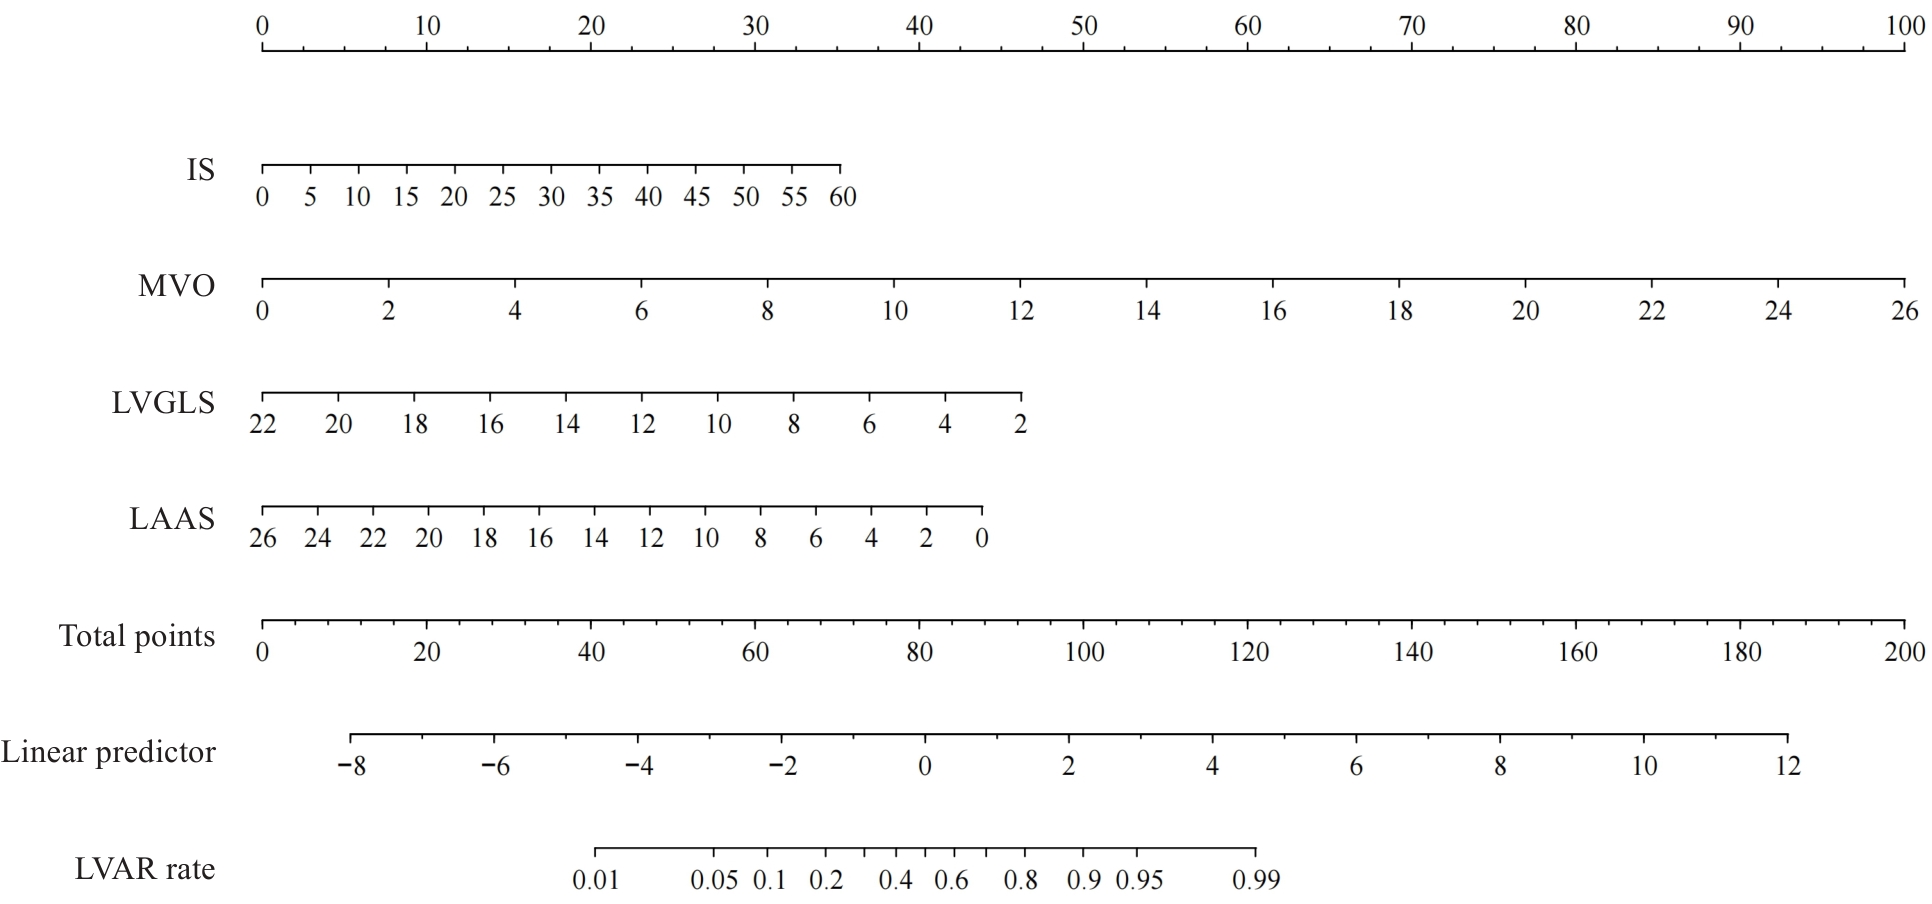
图4 预测LVAR的列线图
Fig.4 Nomogram for predicting LVAR.
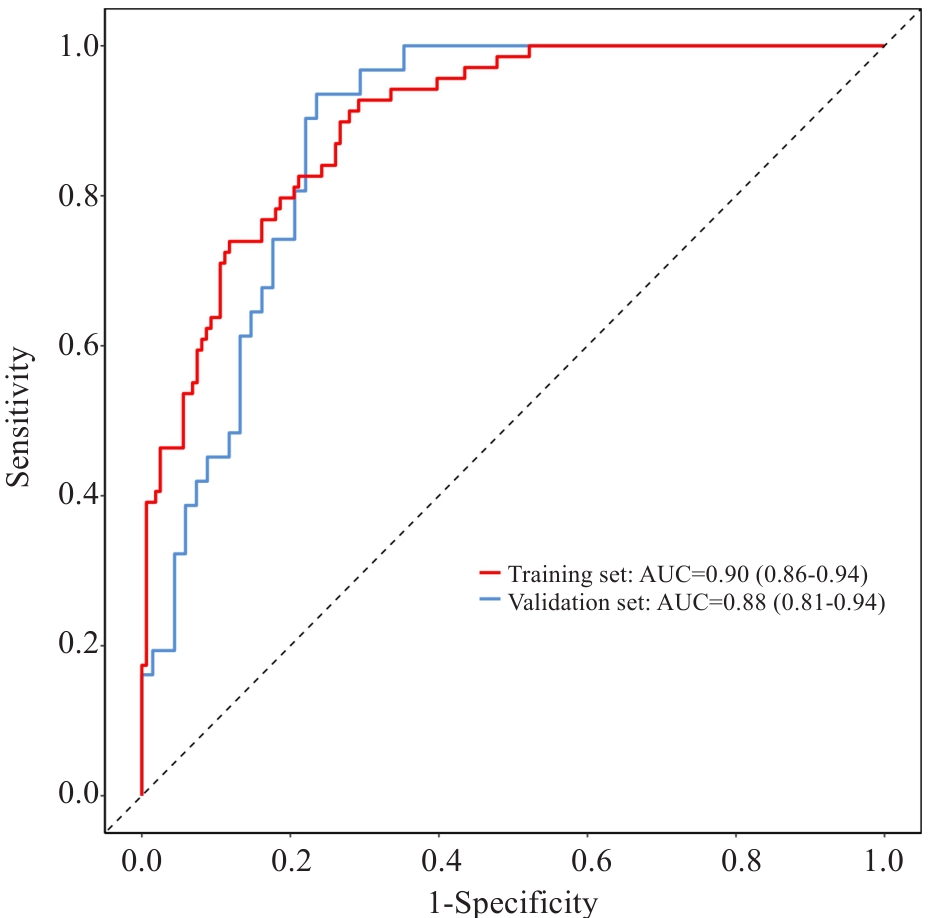
图5 列线图在训练集和验证集中的ROC曲线和AUC值
Fig.5 Nomogram ROC curves and AUC values in training and validation sets.
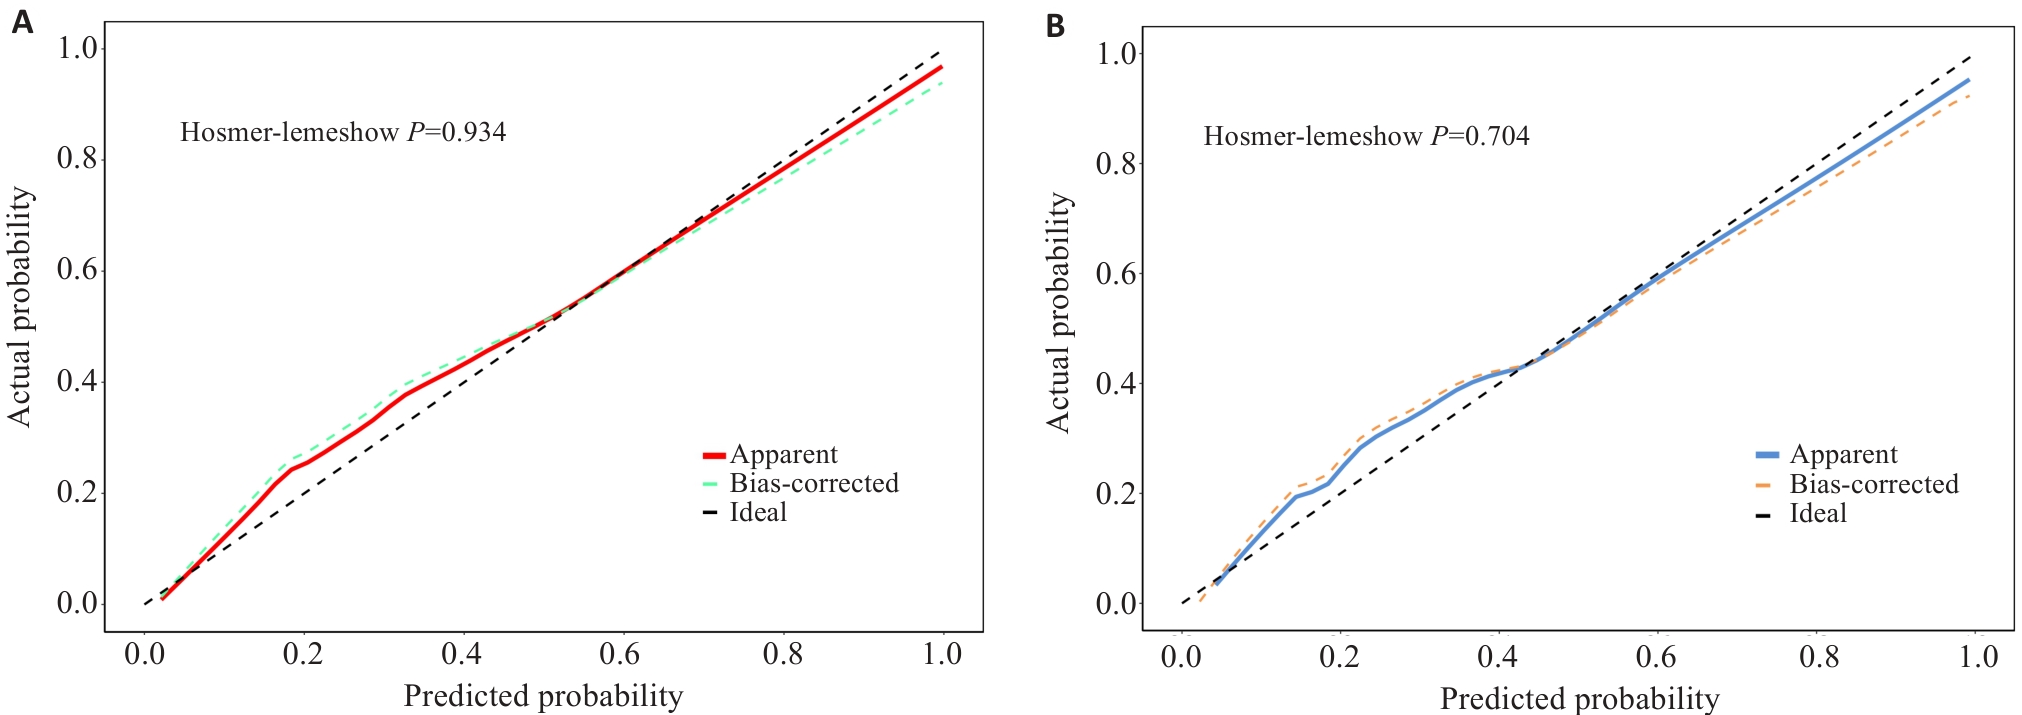
图6 训练集与验证集的校准曲线
Fig.6 Calibration curves for the training set and validation set. A: Calibration curve of the training set. B: Calibration curve of the validation set.
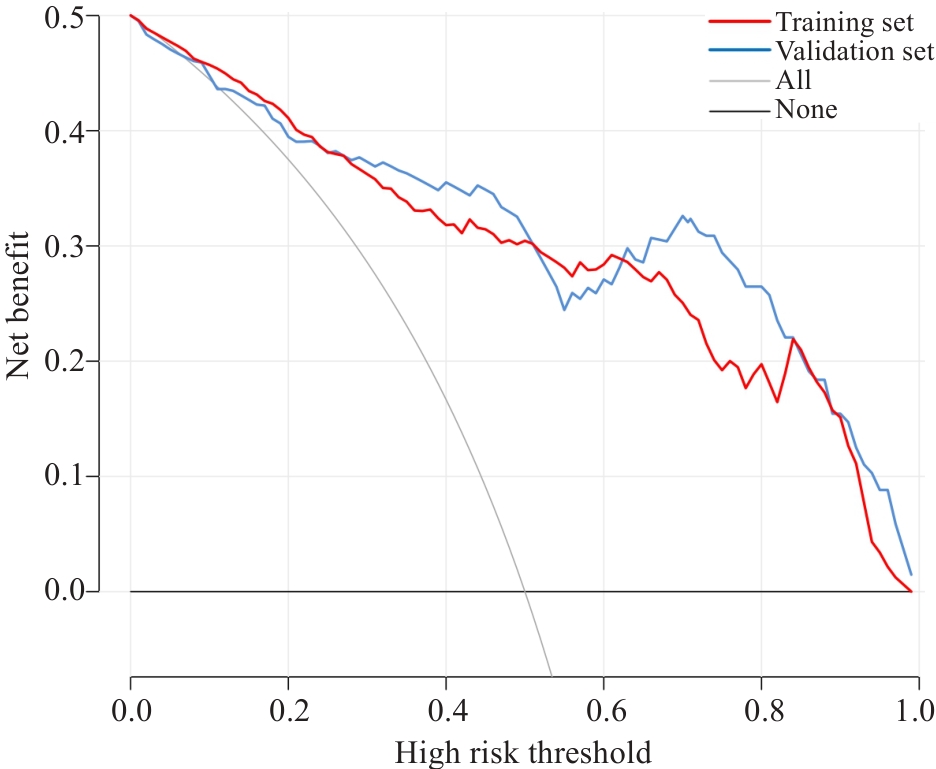
图7 训练集(蓝线)和验证集(红线)中列线图的决策曲线
Fig.7 DCA curves of the nomogram in the training set (blue line) and validation set (red line).
| Variables [n (%)] | Total (n=329) | Non-LVAR (n=229) | LVAR (n=100) | P |
|---|---|---|---|---|
| Cardiac death | 10 (3.04) | 3 (1.31) | 7 (7.00) | 0.016 |
| Recurrent myocardial infarction | 15 (4.56) | 5 (2.18) | 10 (10.00) | 0.005 |
| Rehospitalization for heart failure | 35 (10.64) | 10 (4.37) | 25 (25.00) | <0.001 |
| Unplanned revascularization | 35 (10.64) | 19 (8.30) | 16 (16.00) | 0.037 |
| MACE | 95 (28.88) | 37 (16.16) | 58 (58.00) | <0.001 |
表5 LVAR组与非重构组的MACE比较
Tab.5 Comparison of incidences of MACEs between non-LVAR group and LVAR group
| Variables [n (%)] | Total (n=329) | Non-LVAR (n=229) | LVAR (n=100) | P |
|---|---|---|---|---|
| Cardiac death | 10 (3.04) | 3 (1.31) | 7 (7.00) | 0.016 |
| Recurrent myocardial infarction | 15 (4.56) | 5 (2.18) | 10 (10.00) | 0.005 |
| Rehospitalization for heart failure | 35 (10.64) | 10 (4.37) | 25 (25.00) | <0.001 |
| Unplanned revascularization | 35 (10.64) | 19 (8.30) | 16 (16.00) | 0.037 |
| MACE | 95 (28.88) | 37 (16.16) | 58 (58.00) | <0.001 |
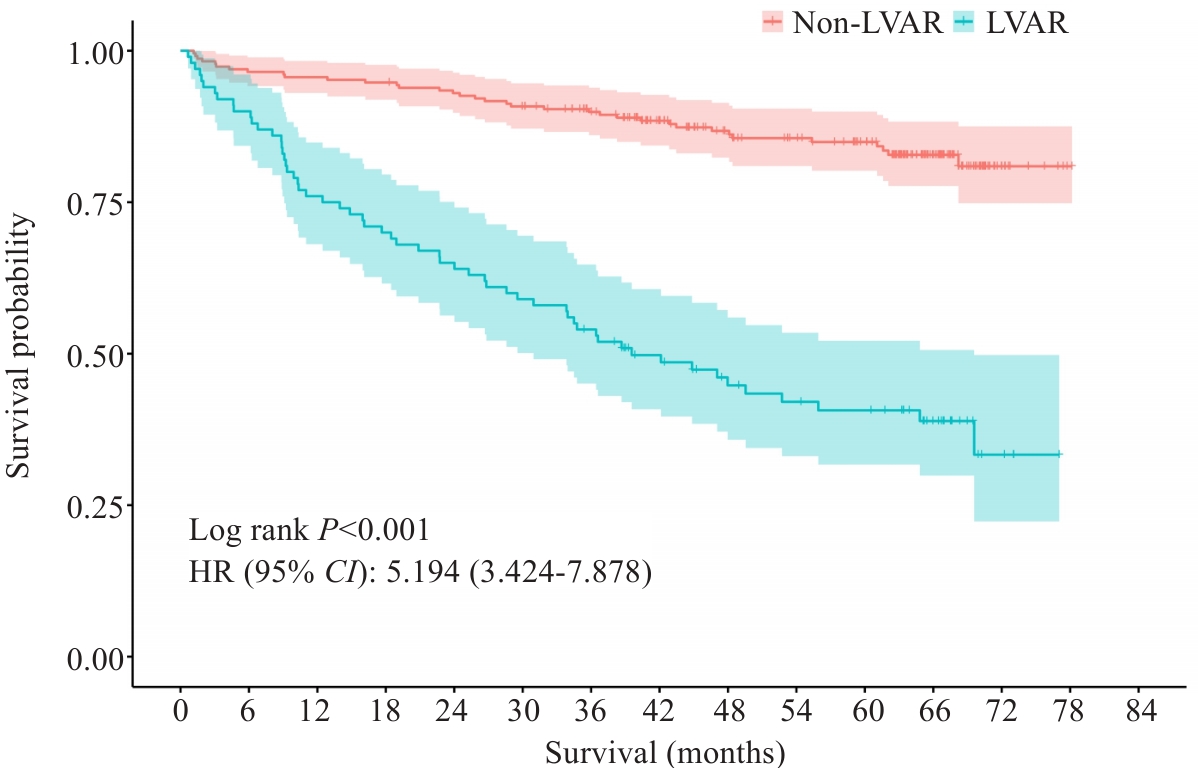
图8 LVAR组与非重构组的Kaplan-Meier曲线分析
Fig.8 Kaplan-Meier curve analysis between non-LVAR group and LVAR group.
| Variables | Intra-observer variability | Inter-observer variability | ||
|---|---|---|---|---|
| ICC | 95% CI | ICC | 95% CI | |
| LVGLS (%) | 0.988 | 0.964, 0.996 | 0.946 | 0.877, 0.981 |
| LVEDV (%) | 0.951 | 0.864, 0.983 | 0.932 | 0.851,0.974 |
| LAAS (%) | 0.942 | 0.838, 0.980 | 0.918 | 0.826,0.966 |
| IS (%) | 0.978 | 0.934, 0.993 | 0.902 | 0.801,0.959 |
| MVO (%) | 0.973 | 0.920, 0.991 | 0.943 | 0.849,0.981 |
| LVEF (%) | 0.961 | 0.903, 0.987 | 0.946 | 0.877, 0.981 |
| ICC: Interclass correlation coefficient; CI: Confidence interval; LVGLS: Left ventricular global longitudinal strain; LVEDV: Left ventricular end-diastolic volume; LAAS: Left atrium active strain, IS: Infarct size; MVO: Microvascular obstruction; LVEF: Left ventricular ejection fraction. | ||||
表6 操作者内和操作者间一致性分析
Tab.6 Intra-observer and inter-observer agreement analysis
| Variables | Intra-observer variability | Inter-observer variability | ||
|---|---|---|---|---|
| ICC | 95% CI | ICC | 95% CI | |
| LVGLS (%) | 0.988 | 0.964, 0.996 | 0.946 | 0.877, 0.981 |
| LVEDV (%) | 0.951 | 0.864, 0.983 | 0.932 | 0.851,0.974 |
| LAAS (%) | 0.942 | 0.838, 0.980 | 0.918 | 0.826,0.966 |
| IS (%) | 0.978 | 0.934, 0.993 | 0.902 | 0.801,0.959 |
| MVO (%) | 0.973 | 0.920, 0.991 | 0.943 | 0.849,0.981 |
| LVEF (%) | 0.961 | 0.903, 0.987 | 0.946 | 0.877, 0.981 |
| ICC: Interclass correlation coefficient; CI: Confidence interval; LVGLS: Left ventricular global longitudinal strain; LVEDV: Left ventricular end-diastolic volume; LAAS: Left atrium active strain, IS: Infarct size; MVO: Microvascular obstruction; LVEF: Left ventricular ejection fraction. | ||||
| 1 | GBD 2021 Causes of Death Collaborators. Global burden of 288 causes of death and life expectancy decomposition in 204 countries and territories and 811 subnational locations, 1990-2021: a systematic analysis for the Global Burden of Disease Study 2021[J]. Lancet, 2024, 403(10440): 2100-32. |
| 2 | Vogel B, Claessen BE, Arnold SV, et al. ST-segment elevation myocardial infarction[J]. Nat Rev Dis Primers, 2019, 5(1): 39. |
| 3 | Byrne RA, Rossello X, Coughlan JJ, et al. 2023 ESC Guidelines for the management of acute coronary syndromes[J]. Eur Heart J, 2023, 44(38): 3720-826. |
| 4 | Bulluck H, Dharmakumar R, Arai AE, et al. Cardiovascular magnetic resonance in acute ST-segment-elevation myocardial infarction: recent advances, controversies, and future directions[J]. Circulation, 2018, 137(18): 1949-64. |
| 5 | Berezin AE, Berezin AA. Adverse cardiac remodelling after acute myocardial infarction: old and new biomarkers[J]. Dis Markers, 2020, 2020: 1215802. |
| 6 | Frantz S, Hundertmark MJ, Schulz-Menger J, et al. Left ventricular remodelling post-myocardial infarction: pathophysiology, imaging, and novel therapies[J]. Eur Heart J, 2022, 43(27): 2549-61. |
| 7 | Calvieri C, Riva A, Sturla F, et al. Left ventricular adverse remodeling in ischemic heart disease: emerging cardiac magnetic resonance imaging biomarkers[J]. J Clin Med, 2023, 12(1): 334. |
| 8 | Del Buono MG, Moroni F, Montone RA, et al. Ischemic cardiomyopathy and heart failure after acute myocardial infarction[J]. Curr Cardiol Rep, 2022, 24(10): 1505-15. |
| 9 | A X, Liu M, Chen T, et al. Non-contrast cine cardiac magnetic resonance derived-radiomics for the prediction of left ventricular adverse remodeling in patients with ST-segment elevation myocardial infarction[J]. Korean J Radiol, 2023, 24(9): 827-37. |
| 10 | Reindl M, Tiller C, Holzknecht M, et al. Global longitudinal strain by feature tracking for optimized prediction of adverse remodeling after ST-elevation myocardial infarction[J]. Clin Res Cardiol, 2021, 110(1): 61-71. |
| 11 | Cui JN, Zhao YN, Qian G, et al. Cardiac magnetic resonance for the early prediction of reverse left ventricular remodeling in patients with ST-segment elevation myocardial infarction[J]. Eur Radiol, 2023, 33(12): 8501-12. |
| 12 | Holmes AA, Romero J, Levsky JM, et al. Circumferential strain acquired by CMR early after acute myocardial infarction adds inc-remental predictive value to late gadolinium enhancement imaging to predict late myocardial remodeling and subsequent risk of sudden cardiac death[J]. J Interv Card Electrophysiol, 2017, 50(3): 211-8. |
| 13 | Pascaud A, Assunção A Jr, Garcia G, et al. Left atrial remodeling following ST-segment-elevation myocardial infarction correlates with infarct size and age older than 70 Years[J]. J Am Heart Assoc, 2023, 12(6): e026048. |
| 14 | Darweesh RM, Ahmed DMY, Ahmed KM, et al. Evaluation of right ventricular functions in patients with ischemic cardiomyopathy by speckle-tracking echocardiography[J]. Egypt Heart J, 2024, 76(1): 132. |
| 15 | Chimed S, van der Bijl P, de Paula Lustosa R, et al. Prognostic relevance of right ventricular remodeling after ST-segment elevation myocardial infarction in patients treated with primary percutaneous coronary intervention[J]. Am J Cardiol, 2022, 170: 1-9. |
| 16 | Chinese Society of Cardiology of Chinese Medical Association, Editorial Board of Chinese Journal of Cardiology. 2019 Chinese Society of Cardiology (CSC) guidelines for the diagnosis and man-agement of patients with ST-segment elevation myocardial infarction[J]. Zhonghua Xin Xue Guan Bing Za Zhi, 2019, 47(10): 766-83. |
| 17 | Wang L, Liu T, Wang C, et al. Development and validation of a predictive model for adverse left ventricular remodeling in NSTEMI patients after primary percutaneous coronary intervention[J]. BMC Cardiovasc Disord, 2022, 22(1): 386. |
| 18 | Ibanez B, James S, Agewall S, et al. 2017 ESC Guidelines for the management of acute myocardial infarction in patients presenting with ST-segment elevation: The Task Force for the management of acute myocardial infarction in patients presenting with ST-segment elevation of the European Society of Cardiology (ESC)[J]. Eur Heart J, 2018, 39(2): 119-77. |
| 19 | Bulluck H, Carberry J, Carrick D, et al. Redefining adverse and reverse left ventricular remodeling by cardiovascular magnetic resonance following ST-segment-elevation myocardial infarction and their implications on long-term prognosis[J]. Circ Cardiovasc Imaging, 2020, 13(7): e009937. |
| 20 | Legallois D, Hodzic A, Alexandre J, et al. Definition of left ventricular remodelling following ST-elevation myocardial infarction: a systematic review of cardiac magnetic resonance studies in the past decade[J]. Heart Fail Rev, 2022, 27(1): 37-48. |
| 21 | He J, Yang WJ, Wu WC, et al. Clinical features, myocardial strain and tissue characteristics of heart failure with preserved ejection fraction in patients with obesity: a prospective cohort study[J]. eClinicalMedicine, 2023, 55: 101723. |
| 22 | Kramer CM, Barkhausen J, Bucciarelli-Ducci C, et al. Standardized cardiovascular magnetic resonance imaging (CMR) protocols: 2020 update[J]. J Cardiovasc Magn Reson, 2020, 22(1): 17. |
| 23 | Peters DC, Lamy J, Sinusas AJ, et al. Left atrial evaluation by cardiovascular magnetic resonance: sensitive and unique biomarkers[J]. Eur Heart J Cardiovasc Imaging, 2021, 23(1): 14-30. |
| 24 | Olsen FJ, Bertelsen L, de Knegt MC, et al. Multimodality cardiac imaging for the assessment of left atrial function and the association with atrial arrhythmias[J]. Circ Cardiovasc Imaging, 2016, 9(10): e004947. |
| 25 | Kowallick JT, Morton G, Lamata P, et al. Quantification of atrial dynamics using cardiovascular magnetic resonance: inter-study reproducibility[J]. J Cardiovasc Magn Reson, 2015, 17(1): 36. |
| 26 | van Kranenburg M, Magro M, Thiele H, et al. Prognostic value of microvascular obstruction and infarct size, as measured by CMR in STEMI patients[J]. JACC Cardiovasc Imag, 2014, 7(9): 930-9. |
| 27 | Durante A, Laricchia A, Benedetti G, et al. Identification of high-risk patients after ST-segment-elevation myocardial infarction: comparison between angiographic and magnetic resonance parameters[J]. Circ Cardiovasc Imaging, 2017, 10(6): e005841. |
| 28 | Betgem RP, de Waard GA, Nijveldt R, et al. Intramyocardial haemorrhage after acute myocardial infarction[J]. Nat Rev Cardiol, 2015, 12(3): 156-67. |
| 29 | 中国医师协会胸痛专业委员会, 中华心血管病杂志(网络版)编辑委员会, 急性心肌梗死后心室重构防治专家共识起草组. 急性心肌梗死后心室重构防治专家共识[J]. 中华心血管病杂志(网络版), 2020,3(1): 1-7. |
| 30 | Leancă SA, Crișu D, Petriș AO, et al. Left ventricular remodeling after myocardial infarction: from physiopathology to treatment[J]. Life: Basel, 2022, 12(8): 1111. |
| 31 | Oleynikov V, Salyamova L, Kvasova O, et al. Prediction of adverse post-infarction left ventricular remodeling using a multivariate regression model[J]. Diagnostics: Basel, 2022, 12(3): 770. |
| 32 | Haberka M, Starzak M, Smolka G, et al. Echocardiography and cardiac magnetic resonance in the assessment of left-ventricle remodeling: differences implying clinical decision[J]. J Clin Med, 2024, 13(6): 1620. |
| 33 | Masci PG, Ganame J, Francone M, et al. Relationship between location and size of myocardial infarction and their reciprocal influences on post-infarction left ventricular remodelling[J]. Eur Heart J, 2011, 32(13): 1640-8. |
| 34 | Lombardo A, Niccoli G, Natale L, et al. Impact of microvascular obstruction and infarct size on left ventricular remodeling in reperfused myocardial infarction: a contrast-enhanced cardiac magnetic resonance imaging study[J]. Int J Cardiovasc Imag, 2012, 28(4): 835-42. |
| 35 | Heusch G. Coronary microvascular obstruction: the new frontier in cardioprotection[J]. Basic Res Cardiol, 2019, 114(6): 45. |
| 36 | Rios-Navarro C, Marcos-Garces V, Bayes-Genis A, et al. Microvascular obstruction in ST-segment elevation myocardial infarction: looking back to move forward. focus on CMR[J]. J Clin Med, 2019, 8(11): E1805. |
| 37 | Ndrepepa G, Colleran R, Kastrati A. No-reflow after percutaneous coronary intervention: a correlate of poor outcome in both persistent and transient forms[J]. EuroIntervention, 2018, 14(2): 139-41. |
| 38 | Niccoli G, Scalone G, Lerman A, et al. Coronary microvascular obstruction in acute myocardial infarction[J]. Eur Heart J, 2016, 37(13): 1024-33. |
| 39 | Konijnenberg LSF, Damman P, Duncker DJ, et al. Pathophysiology and diagnosis of coronary microvascular dysfunction in ST-elevation myocardial infarction[J]. Cardiovasc Res, 2020, 116(4): 787-805. |
| 40 | Dobrovie M, Barreiro-Pérez M, Curione D, et al. Inter-vendor reproducibility and accuracy of segmental left ventricular strain measurements using CMR feature tracking[J]. Eur Radiol, 2019, 29(12): 6846-57. |
| 41 | Ben Driss A, Ben Driss Lepage C, Sfaxi A, et al. Strain predicts left ventricular functional recovery after acute myocardial infarction with systolic dysfunction[J]. Int J Cardiol, 2020, 307: 1-7. |
| 42 | Reed GW, Rossi JE, Cannon CP. Acute myocardial infarction[J]. Lancet, 2017, 389(10065): 197-210. |
| 43 | Rajiah PS, Kalisz K, Broncano J, et al. Myocardial strain evaluation with cardiovascular MRI: physics, principles, and clinical applications[J]. Radiographics, 2022, 42(4): 968-90. |
| 44 | Panovsky R, Pleva M, Feitova V, et al. Left atrium assessment: the evolving role of MRI[J]. J Cardiovasc Med: Hagerstown, 2015, 16(10): 671-80. |
| 45 | Spencer L, Wright L, Foulkes SJ, et al. Characterizing the influence of cardiorespiratory fitness on left atrial size and function in the general population[J]. Am J Physiol Heart Circ Physiol, 2024, 326(5): H1269-78. |
| 46 | Modin D, Biering-Sørensen SR, Møgelvang R, et al. Prognostic value of left atrial strain in predicting cardiovascular morbidity and mortality in the general population[J]. Eur Heart J Cardiovasc Imaging, 2019, 20(7): 804-15. |
| 47 | Leng S, Ge H, He J, et al. Long-term prognostic value of cardiac MRI left atrial strain in ST-segment elevation myocardial infarction[J]. Radiology, 2020, 296(2): 299-309. |
| 48 | Chu AA, Wu TT, Zhang L, et al. The prognostic value of left atrial and left ventricular strain in patients after ST-segment elevation myocardial infarction treated with primary percutaneous coronary intervention[J]. Cardiol J, 2021, 28(5): 678-89. |
| 49 | Legallois D, Hodzic A, Milliez P, et al. Left atrial strain quantified after myocardial infarction is associated with early left ventricular remodeling[J]. Echocardiography, 2022, 39(12): 1581-8. |
| 50 | El-Naggar HM, Osman AS, Ahmed MA, et al. Three-dimensional echocardiographic assessment of left ventricular geometric changes following acute myocardial infarction[J]. Int J Cardiovasc Imag, 2023, 39(3): 607-20. |
| [1] | 潘甚豪, 李炎坤, 伍哲维, 毛玉玲, 王春艳. 子宫内膜异位症患者新鲜胚胎移植临床妊娠率预测模型的建立与验证[J]. 南方医科大学学报, 2024, 44(7): 1407-1415. |
| [2] | 刘科, 马振岩, 付磊, 张丽萍, 阿鑫, 肖少波, 张震, 张洪博, 赵蕾, 钱赓. 心脏磁共振成像整体纵向应变对急性ST段抬高型心肌梗死后左心室重构的预测价值:403例前瞻性研究[J]. 南方医科大学学报, 2024, 44(6): 1033-1039. |
| [3] | 崔佳宁, 刘文佳, 闫 非, 赵亚男, 陈伟杰, 罗春材, 张兴华, 李 涛. 心脏磁共振成像对急性ST段抬高型心肌梗死后左心室不良重构的预测价值[J]. 南方医科大学学报, 2024, 44(3): 553-562. |
| [4] | 刘云泽, 李宬润, 郭俊唐, 刘 阳. 基于临床-影像组学列线图模型鉴别局灶性机化性肺炎与肺腺癌[J]. 南方医科大学学报, 2024, 44(2): 397-404. |
| [5] | 崔佳宁, 李润霞, 刘学谦, 赵亚男, 张兴华, 刘清波, 李 涛. 心脏磁共振特征追踪技术可评估心肌淀粉样变性患者的心脏功能[J]. 南方医科大学学报, 2023, 43(4): 660-666. |
| [6] | 张浩轩, 陆 进, 蒋成义, 方美芳. 基于人工智能技术的鼻咽癌风险预测模型的构建与评价[J]. 南方医科大学学报, 2023, 43(2): 271-279. |
| [7] | 张奔龙, 鲁意迅, 李 力, 高云鹤, 梁文全, 郗洪庆, 王鑫鑫, 张珂诚, 陈 凛. 基于单中心490例胃神经内分泌肿瘤建立的列线图具有良好的预后预测性能[J]. 南方医科大学学报, 2023, 43(2): 183-190. |
| [8] | 孔德贤, 宋丽萍, 向 阳. PET/CT代谢参数与血液炎症标志物对一线化疗的非小细胞肺癌患者预后列线图的构建及临床意义[J]. 南方医科大学学报, 2023, 43(12): 2139-2144. |
| [9] | 刘昭君, 周晓莉. 基于系统性炎症指标构建的列线图可预测心力衰竭患者的不良结局[J]. 南方医科大学学报, 2022, 42(8): 1149-1158. |
| [10] | 罗 钞, 王高明, 胡力文, 强 勇, 郑 超, 申 翼. 食管癌患者术后预测模型的构建和验证:基于SEER数据库[J]. 南方医科大学学报, 2022, 42(6): 794-804. |
| [11] | 孟令飞, 朱学研, 杨立明, 李忻阳, 程思宇, 郭师正, 庄小花, 邹洪斌, 崔文鹏. 腹膜透析相关腹膜炎患者治疗失败预测模型的构建和验证:一项多中心临床研究[J]. 南方医科大学学报, 2022, 42(4): 546-553. |
| [12] | 赵晨玲, 董 婷, 孙伦燕, 胡慧冰, 王 琼, 田丽伟, 江张胜. Wilson病脂代谢异常患者发生肝纤维化的列线图预测模型的建立与验证[J]. 南方医科大学学报, 2022, 42(11): 1720-1725. |
| [13] | 张海捷, 殷 夫, 陈梦林, 漆安琪, 杨丽洋, 崔维维, 杨姗姗, 文 戈. 基于术前CT影像组学列线图可预测Ⅰ~Ⅲ期肾透明性细胞癌术后复发[J]. 南方医科大学学报, 2021, 41(9): 1358-1365. |
| [14] | 张力苹, 刘喜娟, 林 卉, 王嘉丽, 张启周. 晚期胃癌生存预后因素及列线图预测模型的建立与验证[J]. 南方医科大学学报, 2021, 41(4): 621-627. |
| [15] | 成东亮, 冯红梅, 文 戈, 刘健萍, 洪居陆, 高明勇. 基于磁共振脂肪定量技术IDEAL-IQ的列线图模型在预测早期骨量丢失中的价值[J]. 南方医科大学学报, 2021, 41(11): 1707-1711. |
| 阅读次数 | ||||||
|
全文 |
|
|||||
|
摘要 |
|
|||||