南方医科大学学报 ›› 2024, Vol. 44 ›› Issue (12): 2412-2420.doi: 10.12122/j.issn.1673-4254.2024.12.18
• • 上一篇
刘操林1( ), 邹青清2, 王梦虹1, 杨芹枚1, 宋丽文1, 陆紫箫1, 冯前进2, 赵英华1()
收稿日期:2024-08-06
出版日期:2024-12-20
发布日期:2024-12-26
通讯作者:
赵英华
E-mail:liucaolun08@smu.edu.cn;zyh7258957@163.com
作者简介:刘操林,在读硕士研究生,主治医师,E-mail: liucaolun08@smu.edu.cn
基金资助:
Caolin LIU1(), Qingqing ZOU2, Menghong WANG1, Qinmei YANG1, Liwen SONG1, Zixiao LU1, Qianjin FENG2, Yinghua ZHAO1()
Received:2024-08-06
Online:2024-12-20
Published:2024-12-26
Contact:
Yinghua ZHAO
E-mail:liucaolun08@smu.edu.cn;zyh7258957@163.com
Supported by:摘要:
目的 基于CT图像和临床特征构建深度学习模型,鉴别原发性骨肿瘤骨样和软骨样基质矿化,以提示成骨性或成软骨性骨肿瘤的组织来源,辅助两者的鉴别诊断。 方法 回顾性搜集2010年1月~2021年8月来自广东省4个医疗中心的276例病理证实的原发性骨肿瘤患者CT平扫图像。采用卷积神经网络(CNN)作为深度学习架构,通过迁移学习确定最佳深度学习基线模型(R-Net),通过算法改进获得优化后的深度学习模型(S-Net),采用多元逻辑回归分析筛选性别、年龄、矿化位置和病理性骨折等临床特征,将临床特征与影像特征连接构建深度学习融合模型(SC-Net)。对比深度学习模型与机器学习模型、放射科医生的诊断表现。用受试者特征曲线(ROC)下面积(AUC)和F1分数评价模型分类性能。 结果 外部测试集显示:深度学习融合模型SC-Net的表现最佳,AUC为0.901(95% CI:0.803~1.00),准确度为83.7%(95% CI:69.3%~93.2%),F1分数为0.857,性能优于深度学习模型R-Net、深度学习模型S-Net、机器学习模型和机器学习融合模型,AUC分别为0.768、0.818、0.761、0.791,准确度为69.8%、76.7%、72.1%、74.4%,F1分数为0.755、0.828、0.700、0.732;且深度学习融合模型SC-Net总体分类性能超越了放射科医生诊断水平。 结论 基于多中心的CT图像和临床信息的深度学习融合模型,成功实现了对原发性骨肿瘤骨样和软骨样基质矿化的分类。尤其对于影像表现不典型矿化病灶的鉴别优于机器学习模型和放射科医生视觉诊断,具有一定的临床应用价值。
刘操林, 邹青清, 王梦虹, 杨芹枚, 宋丽文, 陆紫箫, 冯前进, 赵英华. 鉴别原发性骨肿瘤骨样和软骨样基质矿化:基于CT和临床特征的深度学习融合模型的多中心回顾性研究[J]. 南方医科大学学报, 2024, 44(12): 2412-2420.
Caolin LIU, Qingqing ZOU, Menghong WANG, Qinmei YANG, Liwen SONG, Zixiao LU, Qianjin FENG, Yinghua ZHAO. Identification of osteoid and chondroid matrix mineralization in primary bone tumors using a deep learning fusion model based on CT and clinical features: a multi-center retrospective study[J]. Journal of Southern Medical University, 2024, 44(12): 2412-2420.
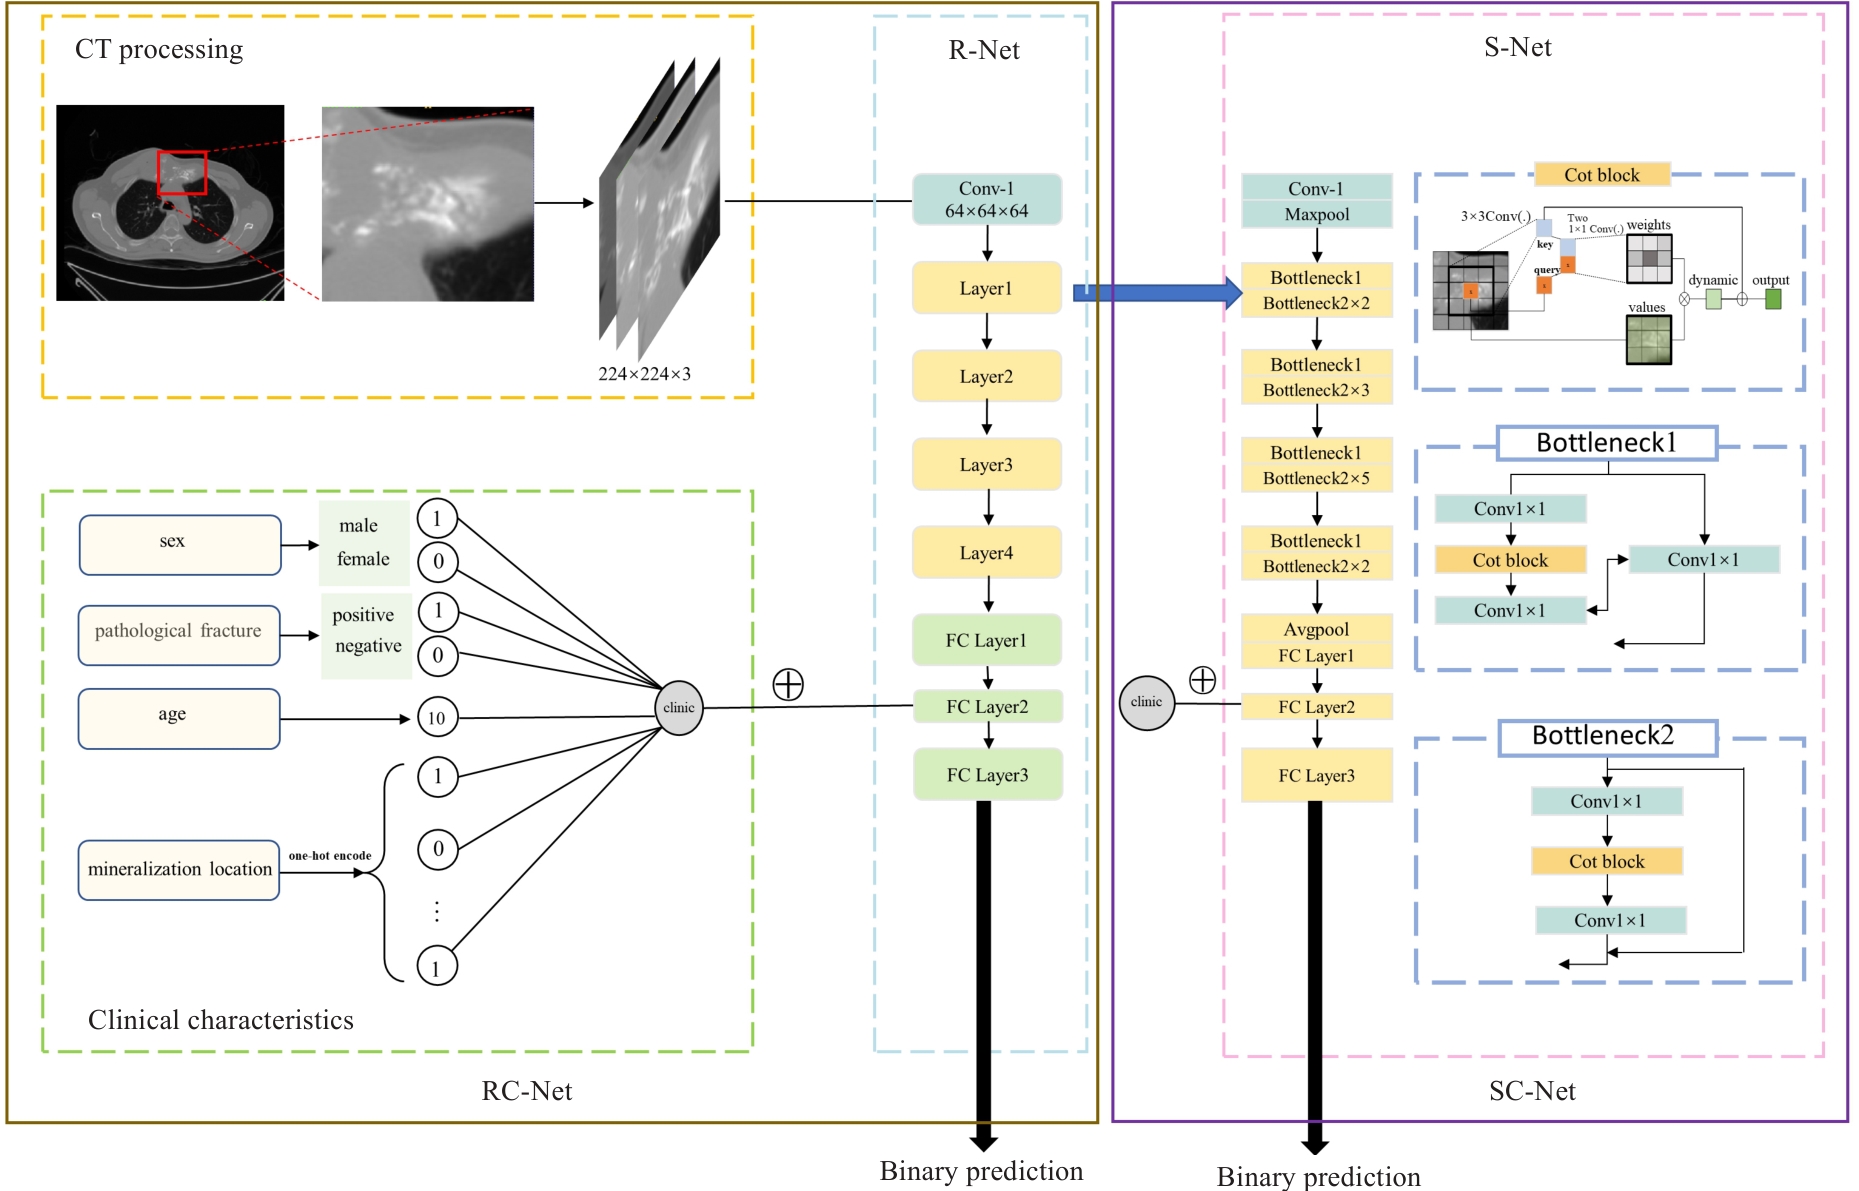
图1 深度学习模型开发框架图
Fig.1 Framework of deep learning models development. clinic: Clinical characteristics; FC: Fully connected; Conv: Convolution.
| Characteristics | Osteogenic bone tumors (n=123) | Chondrogenic bone tumors (n=99) | P |
|---|---|---|---|
| Gender [n (%)] | 0.078 | ||
| Male | 79 (64.23%) | 52 (52.53%) | |
| Female | 44 (35.77%) | 47 (47.47%) | |
| Age (year, Mean±SD) | 22.10±14.71 | 39.49±17.87 | <0.001 |
| Pathological fracture [n (%)] | 31 (25.20%) | 26 (26.26%) | 0.857 |
| Mineralization location [n (%)] | <0.001 | ||
| Femur | 45 (36.58%) | 18 (18.18%) | |
| Tibia and fibula | 26 (21.14%) | 7 (7.071%) | |
| Humerus | 7 (5.69%) | 12 (12.12%) | |
| Pelvis | 9 (7.32%) | 21 (21.21%) | |
| Others | 36 (29.67%) | 41 (41.41%) | |
表1 患者的临床特征
Tab.1 Clinical characteristics of the patients
| Characteristics | Osteogenic bone tumors (n=123) | Chondrogenic bone tumors (n=99) | P |
|---|---|---|---|
| Gender [n (%)] | 0.078 | ||
| Male | 79 (64.23%) | 52 (52.53%) | |
| Female | 44 (35.77%) | 47 (47.47%) | |
| Age (year, Mean±SD) | 22.10±14.71 | 39.49±17.87 | <0.001 |
| Pathological fracture [n (%)] | 31 (25.20%) | 26 (26.26%) | 0.857 |
| Mineralization location [n (%)] | <0.001 | ||
| Femur | 45 (36.58%) | 18 (18.18%) | |
| Tibia and fibula | 26 (21.14%) | 7 (7.071%) | |
| Humerus | 7 (5.69%) | 12 (12.12%) | |
| Pelvis | 9 (7.32%) | 21 (21.21%) | |
| Others | 36 (29.67%) | 41 (41.41%) | |
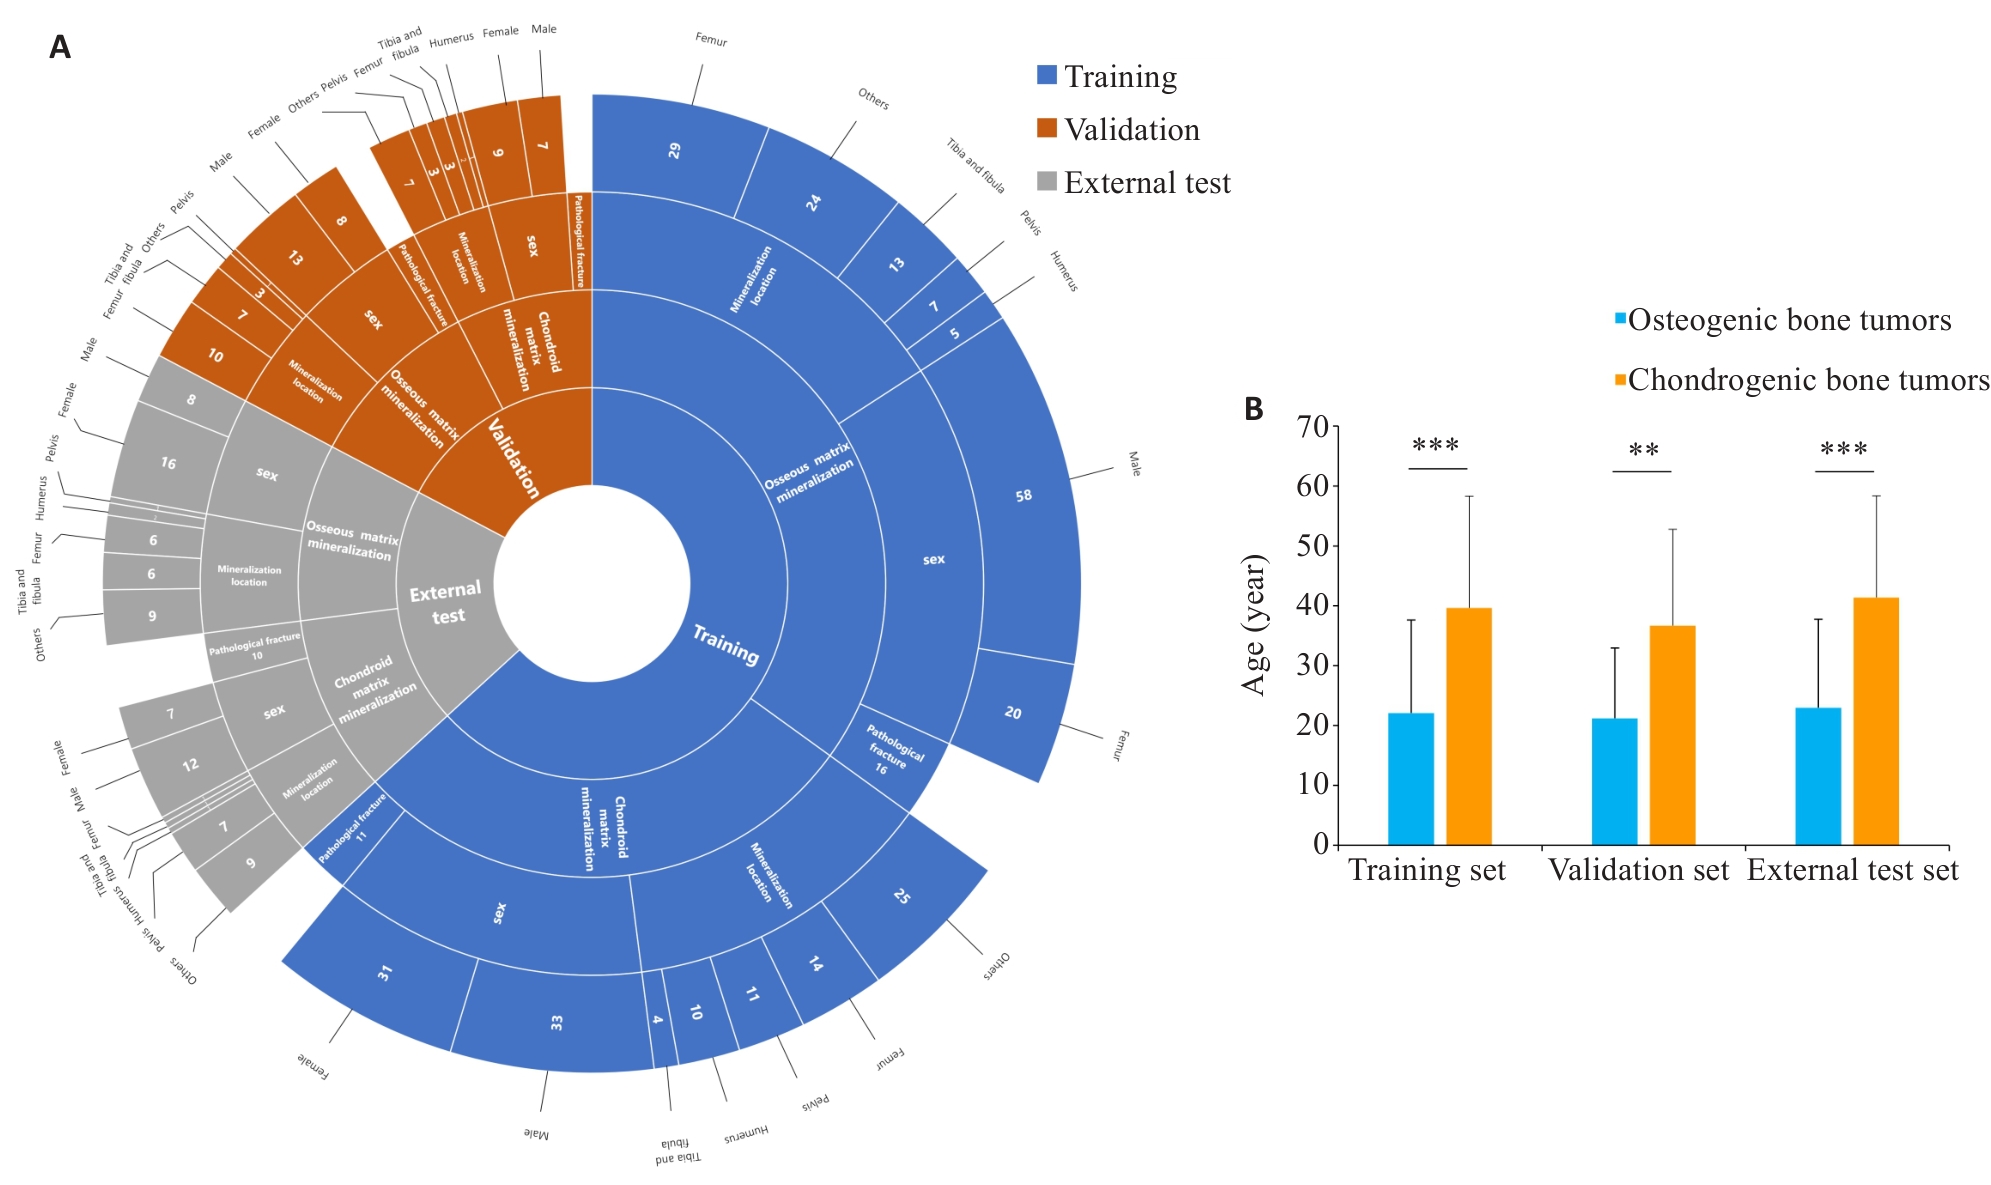
图2 训练集,验证集和测试集患者临床特征分布图
Fig. 2 Distribution of clinical features across training, validation, and external test sets. A: Sunburst chart showing the distribution of patient characteristics, including matrix mineralization pattern(osseous matrix mineralization, chondroid matrix mineralization), gender (male, female), mineralization location(femur, tibia and fibula, humerus, pelvis, others), and pathological fracture presence, across the training (blue), validation (red), and external test sets (gray). B: Histogram of patient age statistics, showing statistically significant differences in age distribution among the three groups. **P<0.01, ***P<0.001.
| Models | AUC (95% CI) | Accuracy (95% CI) | Sensitivity (95% CI) | Specificity (95% CI) | Precision (95% CI) | F1 score |
|---|---|---|---|---|---|---|
| DL model(R-Net) | 0.830 (0.700-0.961) | 0.730 (0.559-0.862) | 0.952 (0.762-0.999) | 0.438 (0.198-0.701) | 0.690 (0.492-0.847) | 0.800 |
| DL model (S-Net) | 0.774 (0.620-0.927) | 0.730 (0.559-0.862) | 0.810 (0.581-0.946) | 0.625 (0.354-0.848) | 0.739 (0.516-0.898) | 0.773 |
| DL model (RC-Net) | 0.857 (0.724-0.990) | 0.838 (0.680-0.938) | 0.810 (0.581-0.946) | 0.875 (0.617-0.984) | 0.895 (0.669-0.987) | 0.850 |
| DL model (SC-Net) | 0.869 (0.748-0.990) | 0.757 (0.588-0.882) | 0.905 (0.696-0.988) | 0.563 (0.299-0.802) | 0.731 (0.522-0.884) | 0.809 |
| ML model | 0.702 (0.531-0.874) | 0.676 (0.502-0.820) | 0.524 (0.298-0.743) | 0.875 (0.617-0.984) | 0.846 (0.546-0.981) | 0.647 |
| ML combined model | 0.830 (0.690-0.971) | 0.757 (0.588-0.882) | 0.762 (0.528-0.918) | 0.750 (0.476-0.927) | 0.800 (0.563-0.943) | 0.780 |
| DL: Deep learning; ML: Machine learning; AUC: Area under the curve; CI: Confidence interval. | ||||||
表2 深度学习、机器学习模型和融合模型在内部验证集的分类性能
Tab.2 Classification performance of deep learning models, machine learning models and combined models in the internal validation set
| Models | AUC (95% CI) | Accuracy (95% CI) | Sensitivity (95% CI) | Specificity (95% CI) | Precision (95% CI) | F1 score |
|---|---|---|---|---|---|---|
| DL model(R-Net) | 0.830 (0.700-0.961) | 0.730 (0.559-0.862) | 0.952 (0.762-0.999) | 0.438 (0.198-0.701) | 0.690 (0.492-0.847) | 0.800 |
| DL model (S-Net) | 0.774 (0.620-0.927) | 0.730 (0.559-0.862) | 0.810 (0.581-0.946) | 0.625 (0.354-0.848) | 0.739 (0.516-0.898) | 0.773 |
| DL model (RC-Net) | 0.857 (0.724-0.990) | 0.838 (0.680-0.938) | 0.810 (0.581-0.946) | 0.875 (0.617-0.984) | 0.895 (0.669-0.987) | 0.850 |
| DL model (SC-Net) | 0.869 (0.748-0.990) | 0.757 (0.588-0.882) | 0.905 (0.696-0.988) | 0.563 (0.299-0.802) | 0.731 (0.522-0.884) | 0.809 |
| ML model | 0.702 (0.531-0.874) | 0.676 (0.502-0.820) | 0.524 (0.298-0.743) | 0.875 (0.617-0.984) | 0.846 (0.546-0.981) | 0.647 |
| ML combined model | 0.830 (0.690-0.971) | 0.757 (0.588-0.882) | 0.762 (0.528-0.918) | 0.750 (0.476-0.927) | 0.800 (0.563-0.943) | 0.780 |
| DL: Deep learning; ML: Machine learning; AUC: Area under the curve; CI: Confidence interval. | ||||||
| Models | AUC (95% CI) | Accuracy (95% CI) | Sensitivity (95% CI) | Specificity (95% CI) | Precision (95% CI) | F1 score |
|---|---|---|---|---|---|---|
| DL model(R-Net) | 0.768 (0.620-0.915) | 0.698 (0.539-0.828) | 0.833 (0.626-0.953) | 0.526 (0.289-0.756) | 0.690 (0.492-0.847) | 0.755 |
| DL model (S-Net) | 0.818 (0.694-0.942) | 0.767 (0.614-0.882) | 1.000 (0.858-1.000) | 0.474 (0.244-0.711) | 0.706 (0.525,0.849) | 0.828 |
| DL model (RC-Net) | 0.890 (0.802-0.988) | 0.791 (0.640-0.900) | 0.833 (0.626-0.953) | 0.737 (0.488-0.909) | 0.800 (0.593-0.932) | 0.816 |
| DL model (SC-Net) | 0.901 (0.803-1.00) | 0.837 (0.693-0.932) | 0.875 (0.676-0.973) | 0.789 (0.544-0.939) | 0.840 (0.639-0.955) | 0.857 |
| ML model | 0.761 (0.619-0.903) | 0.721 (0.563-0.847) | 0.583 (0.366-0.779) | 0.895 (0.669-0.987) | 0.875 (0.617-0.984) | 0.700 |
| ML combined model | 0.791 (0.655-0.926) | 0.744 (0.588-0.865) | 0.625 (0.406-0.812) | 0.895 (0.669-0.987) | 0.882 (0.636-0.985) | 0.732 |
| Radiologist 3 | - | 0.744 (0.588-0.865) | 0.792 (0.578-0.929) | 0.684 (0.475-0.874) | 0.760 (0.549-0.906) | 0.776 |
| Radiologist 4 | - | 0.814 (0.666-0.916) | 0.875 (0.676-0.973) | 0.737 (0.488-0.909) | 0.808 (0.606-0.934) | 0.840 |
| DL: Deep learning; ML: Machine learning; AUC: Area under the curve; CI: Confidence interval; Radiologist 3: Junior radiologist; Radiologist 4: Senior radiologist. | ||||||
表 3 深度学习、机器学习模型和融合模型在外部测试集的分类性能
Tab.3 Classification performance of deep learning models, machine learning models and combined models on the external test set
| Models | AUC (95% CI) | Accuracy (95% CI) | Sensitivity (95% CI) | Specificity (95% CI) | Precision (95% CI) | F1 score |
|---|---|---|---|---|---|---|
| DL model(R-Net) | 0.768 (0.620-0.915) | 0.698 (0.539-0.828) | 0.833 (0.626-0.953) | 0.526 (0.289-0.756) | 0.690 (0.492-0.847) | 0.755 |
| DL model (S-Net) | 0.818 (0.694-0.942) | 0.767 (0.614-0.882) | 1.000 (0.858-1.000) | 0.474 (0.244-0.711) | 0.706 (0.525,0.849) | 0.828 |
| DL model (RC-Net) | 0.890 (0.802-0.988) | 0.791 (0.640-0.900) | 0.833 (0.626-0.953) | 0.737 (0.488-0.909) | 0.800 (0.593-0.932) | 0.816 |
| DL model (SC-Net) | 0.901 (0.803-1.00) | 0.837 (0.693-0.932) | 0.875 (0.676-0.973) | 0.789 (0.544-0.939) | 0.840 (0.639-0.955) | 0.857 |
| ML model | 0.761 (0.619-0.903) | 0.721 (0.563-0.847) | 0.583 (0.366-0.779) | 0.895 (0.669-0.987) | 0.875 (0.617-0.984) | 0.700 |
| ML combined model | 0.791 (0.655-0.926) | 0.744 (0.588-0.865) | 0.625 (0.406-0.812) | 0.895 (0.669-0.987) | 0.882 (0.636-0.985) | 0.732 |
| Radiologist 3 | - | 0.744 (0.588-0.865) | 0.792 (0.578-0.929) | 0.684 (0.475-0.874) | 0.760 (0.549-0.906) | 0.776 |
| Radiologist 4 | - | 0.814 (0.666-0.916) | 0.875 (0.676-0.973) | 0.737 (0.488-0.909) | 0.808 (0.606-0.934) | 0.840 |
| DL: Deep learning; ML: Machine learning; AUC: Area under the curve; CI: Confidence interval; Radiologist 3: Junior radiologist; Radiologist 4: Senior radiologist. | ||||||
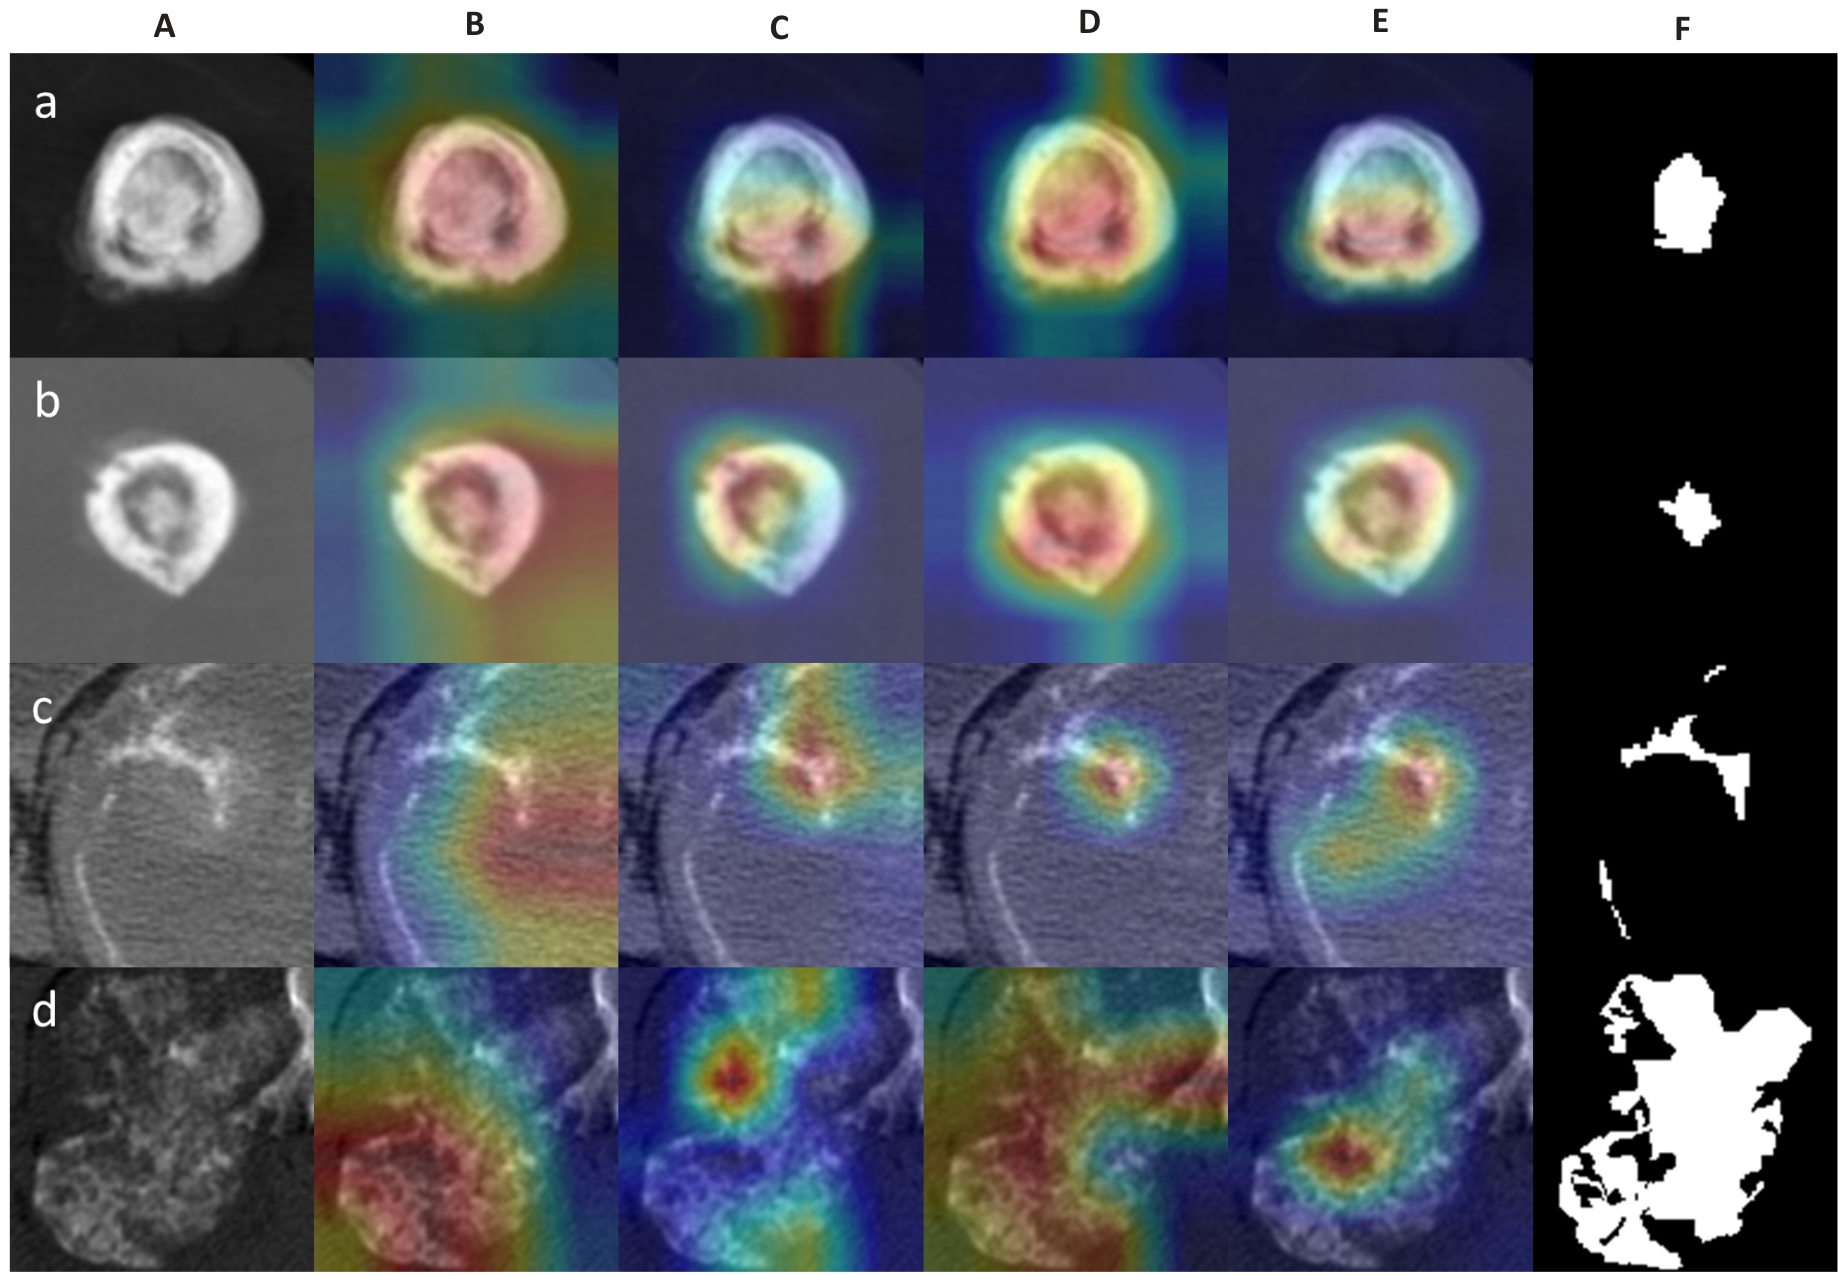
图3 深度学习模型激活热图示例
Fig. 3 Examples of activation heatmaps of the deep learning models. A: Original CT images. B-E: Regions of interest (ROIs) focused on by the deep learning models (red color indicates areas of primary concern for the model). F: Manually outlined ROIs. The rows a, b, c, and d show the original and processed images of osteosarcoma of the femur (osteoid matrix mineralization) in a 18-year-old patient, osteosarcoma of the humerus (osteoid matrix mineralization) in a 15-year-old female patient, chondrosarcoma of the rib (chondroid matrix mineralization) in a 53-year-old male patient, and chondrosarcoma of the rib near the thoracic vertebrae (chondroid matrix mineralization) in a 36-year-old male patient, respectively.
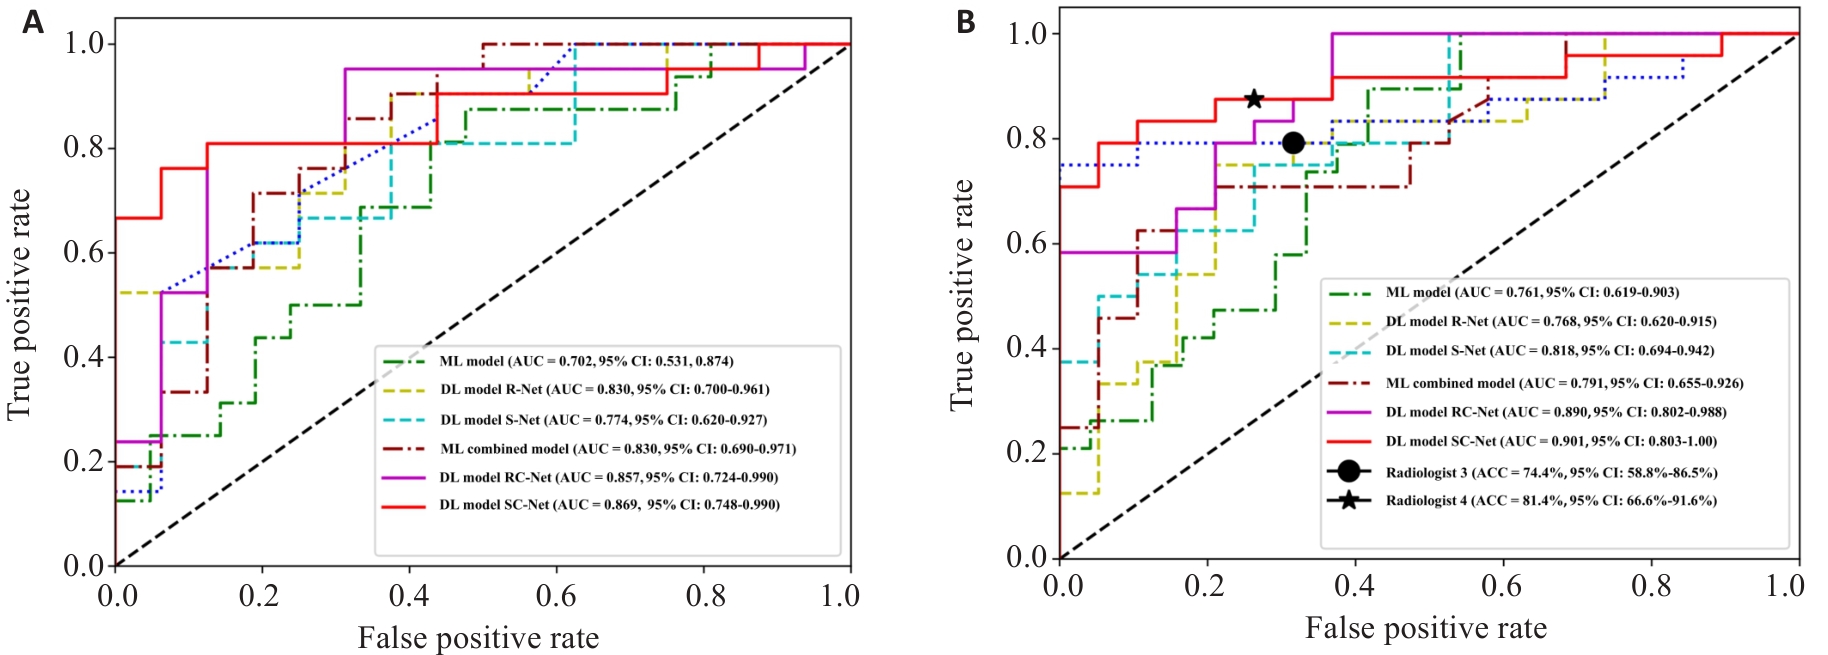
图4 验证集和外部测试集深度学习模型与机器学习模型的ROC曲线
Fig. 4 ROC curves of deep learning models and machine learning models on the validation set (A) and external test set (B).
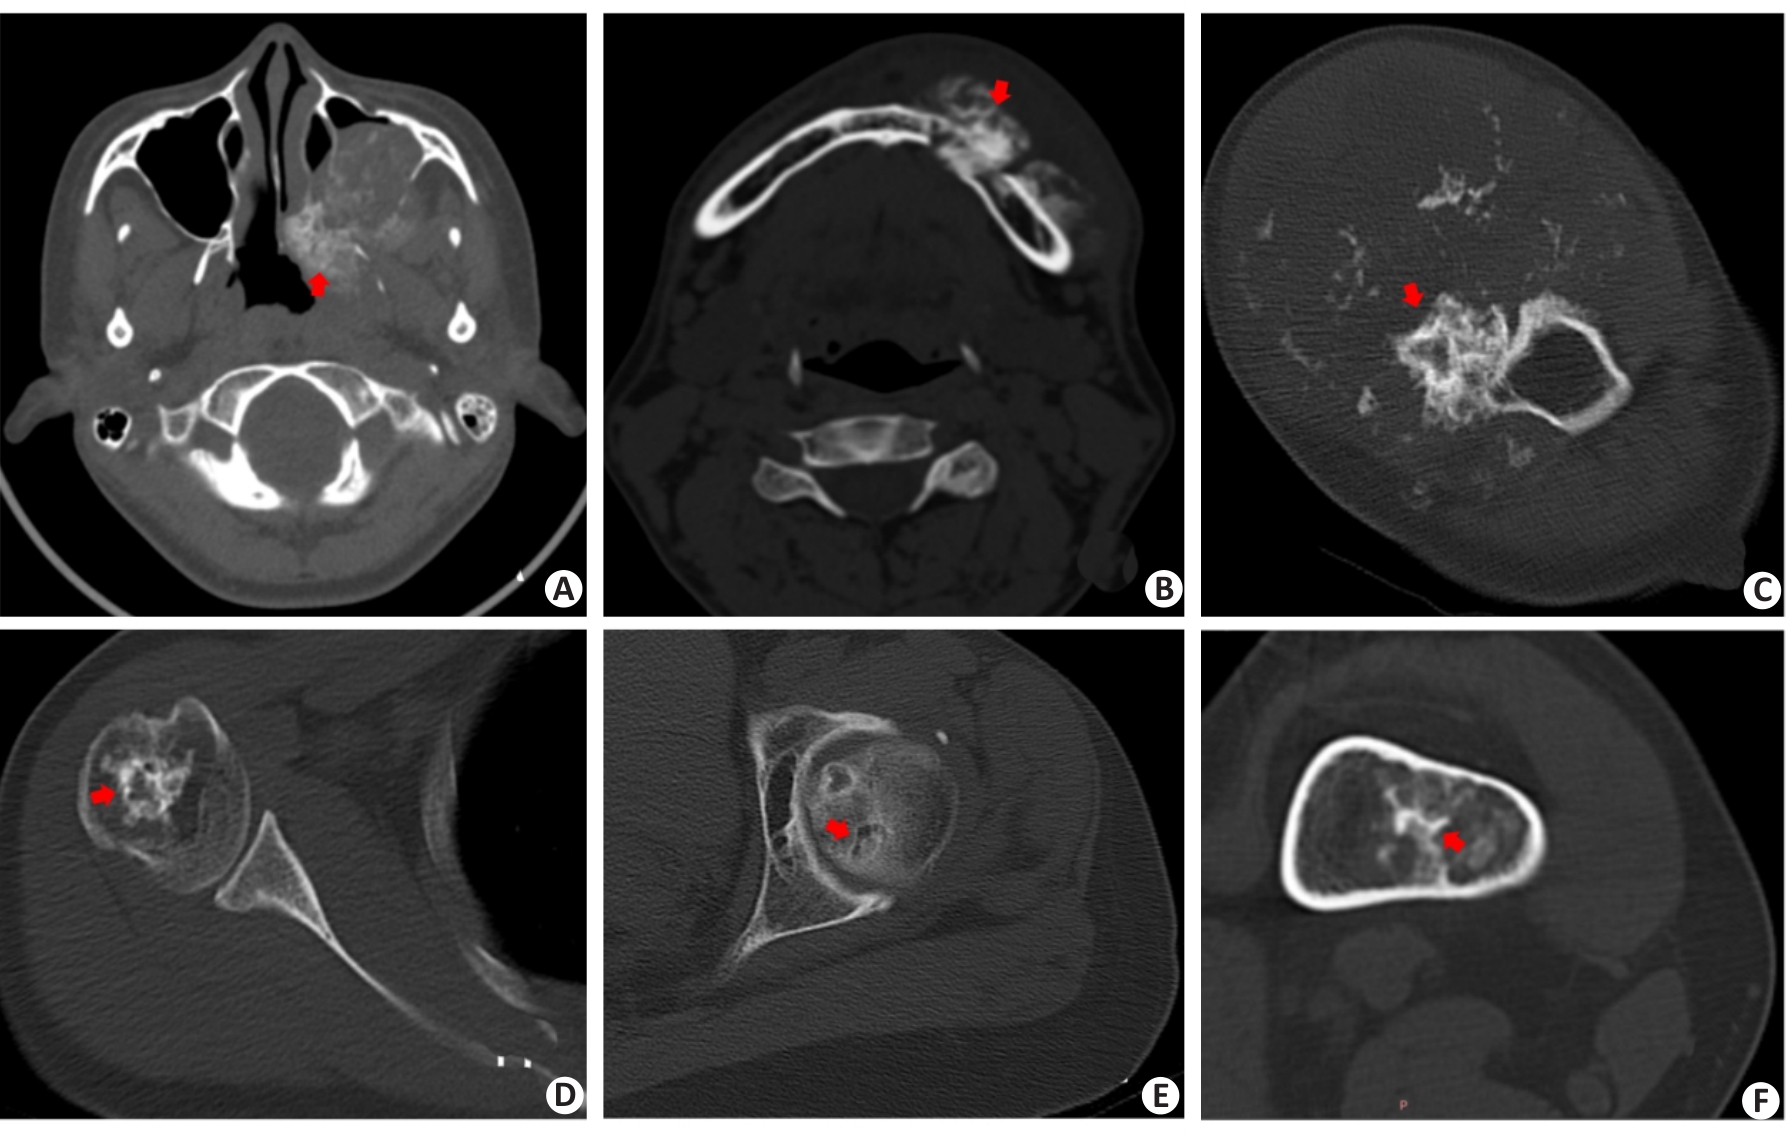
图5 深度学习模型或放射医生分类错误病例
Fig.5 Cases of misclassification by deep learning model or machine learning model or Radiologist. DL: deep learning; ML: machine learning.A: Female,16 years; Pathological result: Osteosarcoma of the jawbone; Matrix mineralization pattern: Osteoid matrix (red arrow); Accurate classification: Senior radiologist; Inaccurate classification: Junior radiologist, DL model R-Net; B: Male, 37 years; Pathological result: Osteosarcoma of the jawbone; Matrix mineralization pattern: Osteoid matrix (red arrow); Accurate classification: Senior radiologist; Inaccurate classification: Junior radiologist, DL model R-Net;C: Male, 34 years; Pathological result; Chondrosarcoma of proximal humerus; Matrix mineralization pattern: Chondroid matrix (red arrow); Accurate Classification: Senior radiologist, DL model SC-Net; Inaccurate classification: Junior radiologist,ML model;D: Female, 44 years; Pathological result: Chondrosarcoma of proximal humerus; Matrix mineralization pattern: Chondroid matrix (red arrow); Accurate Classification: Senior radiologist, DL model SC-Net; Inaccurate classification: Junior radiologist, ML model; E: Female, 63 years; Pathological result: Intrafemoral chondroma; Matrix mineralization pattern: Chondroid matrix(red arrow); Accurate Classification: Junior, Senior Radiologist; Inaccurate classification: ML model,ML combined model, DL model R-Net;F: Female, 42 years; Pathological result: Intrafemoral chondroma; Matrix mineralization pattern: Chondroid matrix(red arrow); Accurate Classification: Junior,Senior Radiologist; Inaccurate classification: ML model, ML combined model, DL model R-Net.
| 1 | 崔久法. 双能量CT多参数成像技术对骨肿瘤瘤骨与瘤软骨钙化的鉴别诊断价值研究[D]. 青岛: 青岛大学, 2018. |
| 2 | Sweet DE, Madewell JE, Ragsdale BD. Radiologic and pathologic analysis of solitary bone lesions. Part III: matrix patterns[J]. Radiol Clin North Am, 1981, 19(4): 785-814. |
| 3 | 陈冠宇, 王仁法. 典型皮质旁骨肉瘤一例[J]. 放射学实践, 2016, 31(5): 466-7. |
| 4 | Erlemann R. Imaging and differential diagnosis of primary bone tumors and tumor-like lesions of the spine[J]. Eur J Radiol, 2006, 58(1): 48-67. |
| 5 | 张立华, 袁慧书. 脊柱软骨源性肿瘤的影像分析及鉴别[J]. 临床放射学杂志, 2020, 39(7): 1379-83. |
| 6 | 吴杰芳, 秦耿耿, 童 凯, 等. 肩胛骨肿瘤的临床及影像学分析[J]. 医学影像学杂志, 2021, 31(2): 317-21. |
| 7 | Abd-el-Naby W, Hammond T, Court-Brown CM. Atypical osteochondroma of the distal femur[J]. Orthopedics, 2000, 23(7): 725-6. |
| 8 | Berberat J, Grobholz R, Boxheimer L, et al. Differentiation between calcification and hemorrhage in brain tumors using susceptibility-weighted imaging: a pilot study[J]. AJR Am J Roentgenol, 2014, 202(4): 847-50. |
| 9 | Lambin P, Rios-Velazquez E, Leijenaar R, et al. Radiomics: extracting more information from medical images using advanced feature analysis[J]. Eur J Cancer, 2012, 48(4): 441-6. |
| 10 | Tomaszewski MR, Gillies RJ. The biological meaning of radiomic features[J]. Radiology, 2021, 298(3): 505-16. |
| 11 | Napel S, Mu W, Jardim-Perassi BV, et al. Quantitative imaging of cancer in the postgenomic era: radio(geno)mics, deep learning, and habitats[J]. Cancer, 2018, 124(24): 4633-49. |
| 12 | Litjens G, Kooi T, Bejnordi BE, et al. A survey on deep learning in medical image analysis[J]. Med Image Anal, 2017, 42: 60-88. |
| 13 | 袁 源, 王晨曦, 叶 凯, 等. 基于CT的影像组学在鉴别脊柱骨肉瘤与软骨肉瘤中的价值[J]. 临床放射学杂志, 2024, 43(8): 1384-7. |
| 14 | 潘洁琳, 姜云萍, 占颖莺, 等. 基于MRI平扫的影像组学模型鉴别软骨肉瘤与内生软骨瘤[J]. 南方医科大学学报, 2020, 40(4): 483-90. |
| 15 | Archer L, Snell KIE, Ensor J, et al. Minimum sample size for external validation of a clinical prediction model with a continuous outcome[J]. Stat Med, 2021, 40(1): 133-46. |
| 16 | Lafata KJ, Wang YQ, Konkel B, et al. Radiomics: a primer on high-throughput image phenotyping[J]. Abdom Radiol, 2022, 47(9): 2986-3002. |
| 17 | Guiot J, Vaidyanathan A, Deprez L, et al. A review in radiomics: making personalized medicine a reality via routine imaging[J]. Med Res Rev, 2022, 42(1): 426-40. |
| 18 | Zhou ZJ. Artificial intelligence on MRI for molecular subtyping of diffuse gliomas: feature comparison, visualization, and correlation between radiomics and deep learning[J]. Eur Radiol, 2022, 32(2): 745-6. |
| 19 | Pak M, Kim S. A review of deep learning in image recognition [C]. Proc 2017 4th Int Conf Comput Appl Inf Process Technol (CAIPT), Kuta Bali, Indonesia: IEEE, 2017: 1-3. |
| 20 | He KM, Zhang XY, Ren SQ, et al. Deep residual learning for image recognition[C]//2016 IEEE Conference on Computer Vision and Pattern Recognition (CVPR). June 27-30, 2016. Las Vegas, NV, USA. IEEE, 2016: 770-8. |
| 21 | Toseef M, Olayemi Petinrin O, Wang FZ, et al. Deep transfer learning for clinical decision-making based on high-throughput data: comprehensive survey with benchmark results[J]. Brief Bioinform, 2023, 24(4): bbad254. |
| 22 | Yosinski J, Clune J, Bengio Y, et al. How transferable are features in deep neural networks?[C]//Adv Neural Inf Process Syst 27 (NIPS 2014. PressMIT, 2014: 3320-8. |
| 23 | Vaswani A, Shazeer N, Parmar N, et al. Attention Is All You Need [C]//Adv Neural Inf Process Syst 30 (NIPS 2017. Associates Curran, Inc., 2017: 5998-6008. |
| 24 | Wang Y, Wang H, Li YM, et al. High-accuracy, direct aberration determination using self-attention-armed deep convolutional neural networks[J]. J Microsc, 2022, 286(1): 13-21. |
| 25 | Naraghi AM, Mohankumar R, Linda D, et al. Bone tumors: imaging features of common and rare benign entities[J]. Radiol Clin North Am, 2022, 60(2): 205-19. |
| 26 | Park S, Lee IS, Song YS, et al. Diagnostic performance of tomosynthesis for evaluation of bone tumors and tumor-like lesions: a comparison with radiography[J]. Acta Radiol, 2022, 63(8): 1086-92. |
| 27 | Deventer N, Deventer N, Gosheger G, et al. Chondroblastoma: is intralesional curettage with the use of adjuvants a sufficient way of therapy[J]? J Bone Oncol, 2021, 26: 100342. |
| 28 | Tepelenis K, Skandalakis GP, Papathanakos G, et al. Osteoid osteoma: an updated review of epidemiology, pathogenesis, clinical presentation, radiological features, and treatment option[J]. In Vivo, 2021, 35(4): 1929-38. |
| 29 | Limaiem F, Byerly D W, Singh R. Osteoblastoma [M]. StatPearls (Internet). Treasure Island (FL): StatPearls Publishing. 2023:3-4. |
| 30 | Fu P, Shi Y, Chen G, et al. Prognostic factors in patients with osteosarcoma with the surveillance, epidemiology, and end results database[J]. Technol Cancer Res Treat, 2020, 19: 1533033820947701. |
| 31 | Zamora T. Enchondroma[M]// Bone Tumors. London: Springer, 2021: 57-62. |
| 32 | Biondi NL, Varacallo M. Enchondroma [M]//StatPearls [Internet]. Treasure Island (FL): StatPearls Publishing, 2024:5-7. |
| 33 | Bhure U, Roos JE, Strobel K. Osteoid osteoma: multimodality imaging with focus on hybrid imaging[J]. Eur J Nucl Med Mol Imaging, 2019, 46(4): 1019-36. |
| 34 | Czarnecka AM, Synoradzki K, Firlej W, et al. Molecular biology of osteosarcoma[J]. Cancers, 2020, 12(8): 2130. |
| 35 | Pan JL, Zhang K, Le HB, et al. Radiomics nomograms based on non-enhanced MRI and clinical risk factors for the differentiation of chondrosarcoma from enchondroma[J]. J Magn Reson Imaging, 2021, 54(4): 1314-23. |
| 36 | Weinschenk RC, Wang WL, Lewis VO. Chondrosarcoma[J]. J Am Acad Orthop Surg, 2021, 29(13): 553-62. |
| 37 | Jia Q, Liu C, Yang J, et al. Clinical features, treatments and long-term follow-up outcomes of spinal chondroblastoma: report of 13 clinical cases in a single center[J]. J Neurooncol, 2018, 140(1): 99-106. |
| 38 | Zoccali C, Novello M, Arrigoni F, et al. Osteoblastoma: when the treatment is not minimally invasive, an overview[J]. J Clin Med, 2021, 10(20): 4645. |
| 39 | Kumar N, Gupta B. Global incidence of primary malignant bone tumors[J]. Curr Orthop Pract, 2016, 27(5): 530-4. |
| 40 | Chlap P, Min H, Vandenberg N, et al. A review of medical image data augmentation techniques for deep learning applications[J]. J Med Imaging Radiat Oncol, 2021, 65(5): 545-63. |
| 41 | Cheung TH, Yeung DY. A survey of automated data augmentation for image classification: learning to compose, mix, and generate[J]. IEEE Trans Neural Netw Learn Syst, 2024, 35(10): 13185-205. |
| 42 | Garcea F, Serra A, Lamberti F, et al. Data augmentation for medical imaging: a systematic literature review[J]. Comput Biol Med, 2023, 152: 106391. |
| [1] | 方威扬, 肖慧, 王爽, 林晓明, 陈超敏. 基于MRI影像和临床参数特征融合的深度学习模型预测术前肝细胞癌的细胞角蛋白19状态[J]. 南方医科大学学报, 2024, 44(9): 1738-1751. |
| [2] | 欧嘉志, 詹长安, 杨丰. 一维卷积神经网络的自编码癫痫发作异常检测模型[J]. 南方医科大学学报, 2024, 44(9): 1796-1804. |
| [3] | 汪辰, 蒙铭强, 李明强, 王永波, 曾栋, 边兆英, 马建华. 基于双域Transformer耦合特征学习的CT截断数据重建模型[J]. 南方医科大学学报, 2024, 44(5): 950-959. |
| [4] | 龙楷兴, 翁丹仪, 耿 舰, 路艳蒙, 周志涛, 曹 蕾. 基于多模态多示例学习的免疫介导性肾小球疾病自动分类方法[J]. 南方医科大学学报, 2024, 44(3): 585-593. |
| [5] | 肖 慧, 方威扬, 林铭俊, 周振忠, 费洪文, 陈超敏. 基于两阶段分析的多尺度颈动脉斑块检测方法[J]. 南方医科大学学报, 2024, 44(2): 387-396. |
| [6] | 弥 佳, 周宇佳, 冯前进. 基于正交视角X线图像重建的3D/2D配准方法[J]. 南方医科大学学报, 2023, 43(9): 1636-1643. |
| [7] | 楚智钦, 屈耀铭, 钟 涛, 梁淑君, 温志波, 张 煜. 磁共振酰胺质子转移模态的胶质瘤IDH基因分型识别:基于深度学习的Dual-Aware框架[J]. 南方医科大学学报, 2023, 43(8): 1379-1387. |
| [8] | 于佳弘, 张昆鹏, 靳 爽, 苏 哲, 徐晓桐, 张 华. 弦图插值结合UNIT网络图像转换的CT金属伪影校正[J]. 南方医科大学学报, 2023, 43(7): 1214-1223. |
| [9] | 滕 琳, 王 斌, 冯前进. 头颈癌放疗计划剂量分布的预测方法:基于深度学习的算法[J]. 南方医科大学学报, 2023, 43(6): 1010-1016. |
| [10] | 周 昊, 曾 栋, 边兆英, 马建华. 基于半监督网络的组织感知CT图像对比度的增强方法[J]. 南方医科大学学报, 2023, 43(6): 985-993. |
| [11] | 吴雪扬, 张 煜, 张 华, 钟 涛. 基于注意力机制和多模态特征融合的猕猴脑磁共振图像全脑分割[J]. 南方医科大学学报, 2023, 43(12): 2118-2125. |
| [12] | 和法伟, 王永波, 陶 熙, 朱曼曼, 洪梓璇, 边兆英, 马建华. 基于噪声水平估计的低剂量螺旋CT投影数据恢复[J]. 南方医科大学学报, 2022, 42(6): 849-859. |
| [13] | 王 蕾, 王永波, 边兆英, 马建华, 黄 静. 基于非局部能谱相似特征的基物质分解方法用于双能CT图像去噪[J]. 南方医科大学学报, 2022, 42(5): 724-732. |
| [14] | 符 帅, 李明强, 边兆英, 马建华. 低剂量CT图像重建算法对脑出血检测性能的影响[J]. 南方医科大学学报, 2022, 42(2): 223-231. |
| [15] | 黄进红, 周根娇, 喻泽峰, 胡文玉. 基于复值损失函数的并行MRI的深度重建[J]. 南方医科大学学报, 2022, 42(12): 1755-1764. |
| 阅读次数 | ||||||
|
全文 |
|
|||||
|
摘要 |
|
|||||