Journal of Southern Medical University ›› 2026, Vol. 46 ›› Issue (2): 466-472.doi: 10.12122/j.issn.1673-4254.2026.02.24
Keke LI( ), Lishan XU, Milai YU, Shengli AN()
Received:2025-07-22
Online:2026-02-20
Published:2026-03-10
Contact:
Shengli AN
E-mail:kk20001205@163.com;1069766473@qq.com
Keke LI, Lishan XU, Milai YU, Shengli AN. Comparison of missing data handling methods for AC1 coefficient estimation[J]. Journal of Southern Medical University, 2026, 46(2): 466-472.
Add to citation manager EndNote|Ris|BibTeX
URL: https://www.j-smu.com/EN/10.12122/j.issn.1673-4254.2026.02.24
| Rater A | Rater B | ||||||
|---|---|---|---|---|---|---|---|
| Random ratings | Certain ratings | ||||||
| 1 | ... | k | 1 | ... | k | ||
| Random ratings | 1 | n11RR | ... | n1kRR | n11RC | ... | n1kRC |
| ... | ... | njj'RR | ... | ... | njj'RC | ... | |
| k | nk1RR | ... | nkkRR | nk1RC | ... | nkkRC | |
| Certain ratings | 1 | n11CR | ... | n1kCR | n11CC | ... | 0 |
| ... | ... | njj'CR | ... | ... | njj'CC | ... | |
| k | nk1CR | ... | nkkCR | 0 | ... | nkkCC | |
Tab.1 Contingency table for random and certain ratings
| Rater A | Rater B | ||||||
|---|---|---|---|---|---|---|---|
| Random ratings | Certain ratings | ||||||
| 1 | ... | k | 1 | ... | k | ||
| Random ratings | 1 | n11RR | ... | n1kRR | n11RC | ... | n1kRC |
| ... | ... | njj'RR | ... | ... | njj'RC | ... | |
| k | nk1RR | ... | nkkRR | nk1RC | ... | nkkRC | |
| Certain ratings | 1 | n11CR | ... | n1kCR | n11CC | ... | 0 |
| ... | ... | njj'CR | ... | ... | njj'CC | ... | |
| k | nk1CR | ... | nkkCR | 0 | ... | nkkCC | |
| Scenario | ||
|---|---|---|
| Two Raters (r=2) | ||
| Multiple Raters (r≥3) |
Tab.2 AC1 coefficient formulas
| Scenario | ||
|---|---|---|
| Two Raters (r=2) | ||
| Multiple Raters (r≥3) |
| Rater A | Rater B | Total | |||
|---|---|---|---|---|---|
| 1 | ... | k | Missing | ||
| 1 | n11 | ... | n1k | n1m | n1+ |
| ... | ... | njj' | ... | … | … |
| k | nk1 | ... | nkk | nkm | nk+ |
| Missing | nm1 | … | nmk | nmm | nm+ |
| Total | n+1 | … | n+k | n+m | n |
Tab.3 Contingency table for response category with missing ratings
| Rater A | Rater B | Total | |||
|---|---|---|---|---|---|
| 1 | ... | k | Missing | ||
| 1 | n11 | ... | n1k | n1m | n1+ |
| ... | ... | njj' | ... | … | … |
| k | nk1 | ... | nkk | nkm | nk+ |
| Missing | nm1 | … | nmk | nmm | nm+ |
| Total | n+1 | … | n+k | n+m | n |
| Parameters | 2 Raters+2 Categories | 8 Raters+4 Categories |
|---|---|---|
| n | 25, 50, 100, 200 | 25, 50, 100, 200 |
| Pr | Skewed: (0.90, 0.10) Balanced: (0.50, 0.50) | Skewed: (0.70, 0.15, 0.10, 0.05) Balanced: (0.25, 0.25, 0.25, 0.25) |
| rq | Low: r1 = 0.05, r2 = 0.05 High: r1 = 0.20, r2 = 0.20 Mixed: r1 = 0.05, r2 = 0.20 | Low: rq = 0.05, q =1, …, 8 High: rq = 0.20, q =1, …, 8 Mixed: rq =0.05, rq+1 = 0.20, q =1, 3, 5, 7 |
| M | 5%, 10%, 15%, 20%, 25%, 30%, 35%, 40%, 45%, 50% | 5%, 10%, 15%, 20%, 25%, 30%, 35%, 40%, 45%, 50% |
Tab.4 Setting of the simulation parameters
| Parameters | 2 Raters+2 Categories | 8 Raters+4 Categories |
|---|---|---|
| n | 25, 50, 100, 200 | 25, 50, 100, 200 |
| Pr | Skewed: (0.90, 0.10) Balanced: (0.50, 0.50) | Skewed: (0.70, 0.15, 0.10, 0.05) Balanced: (0.25, 0.25, 0.25, 0.25) |
| rq | Low: r1 = 0.05, r2 = 0.05 High: r1 = 0.20, r2 = 0.20 Mixed: r1 = 0.05, r2 = 0.20 | Low: rq = 0.05, q =1, …, 8 High: rq = 0.20, q =1, …, 8 Mixed: rq =0.05, rq+1 = 0.20, q =1, 3, 5, 7 |
| M | 5%, 10%, 15%, 20%, 25%, 30%, 35%, 40%, 45%, 50% | 5%, 10%, 15%, 20%, 25%, 30%, 35%, 40%, 45%, 50% |
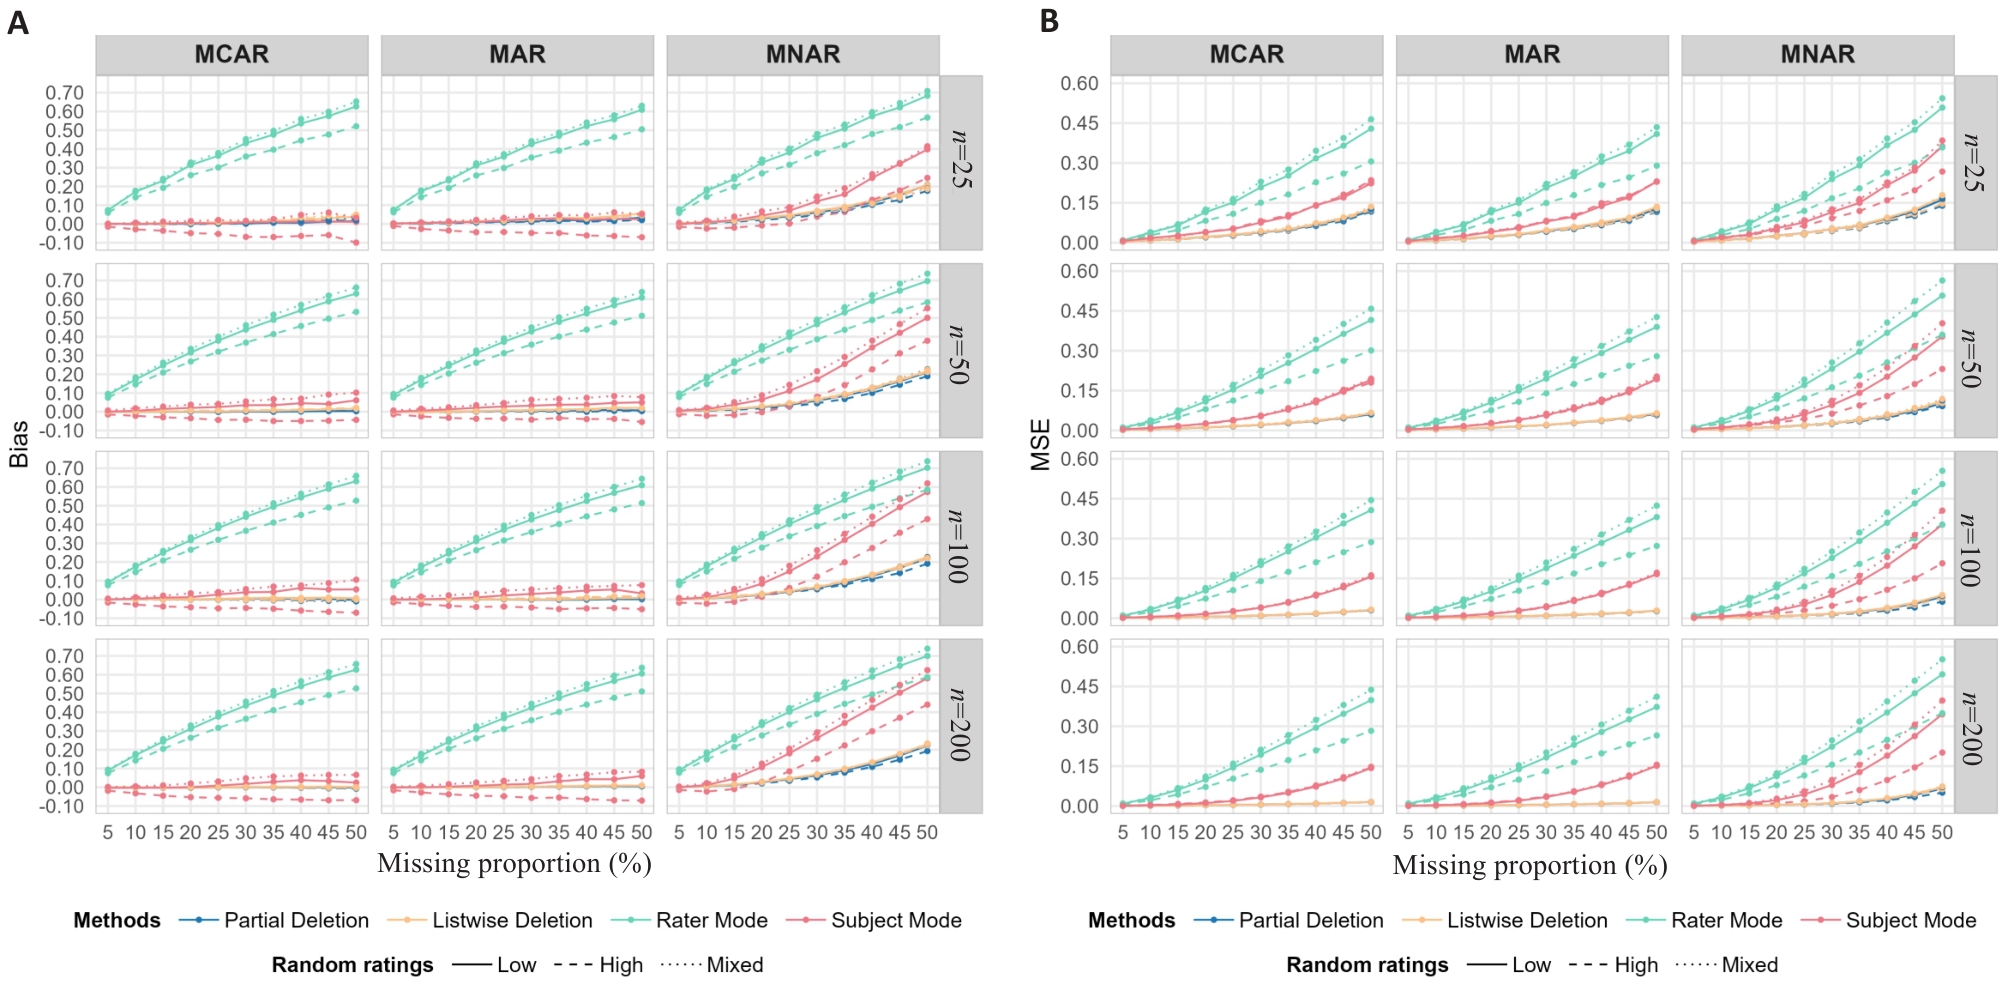
Fig.1 Bias or Mean squared error (MSE) under balanced disease prevalence for 2 raters and 2 categories. A: Bias; B: MSE. Partial Deletion: excluding subjects with zero ratings; Listwise Deletion: Excluding subjects with incomplete ratings; Rater Mode: Imputation by rater mode; Subject Mode: Imputation by subject mode; Random ratings: Random rating probabilities; Low: r1=0.05, r2=0.05; High: r1=0.20, r2=0.20; Mixed: r1= 0.05, r2=0.20. Different colors represent different methods, and different line types represent different random rating probabilities. For example, the green solid line shows the bias or MSE of Rater Mode with low random rating probabilities; the green dashed line, with high random rating probabilities; and the green dotted line, with mixed random rating probabilities.
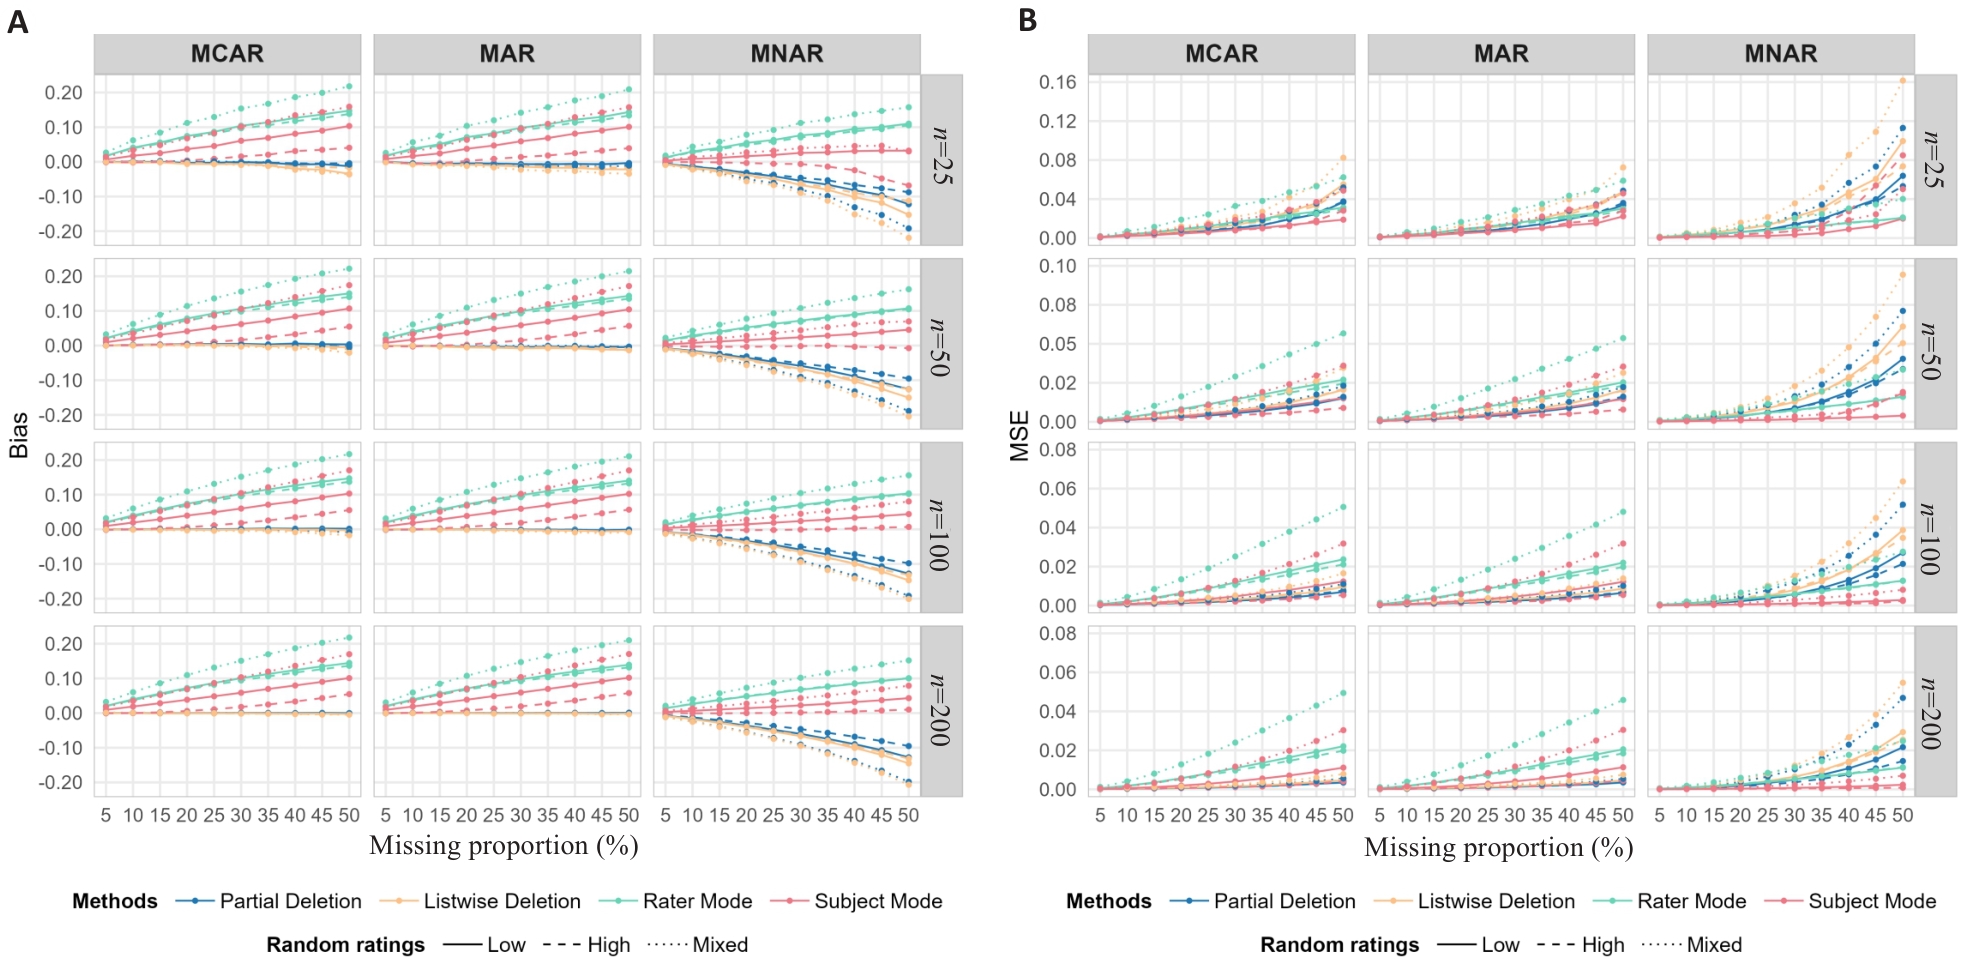
Fig.2 Bias or Mean squared error (MSE) under skewed disease prevalence for 2 raters and 2 categories. A: Bias; B: MSE.
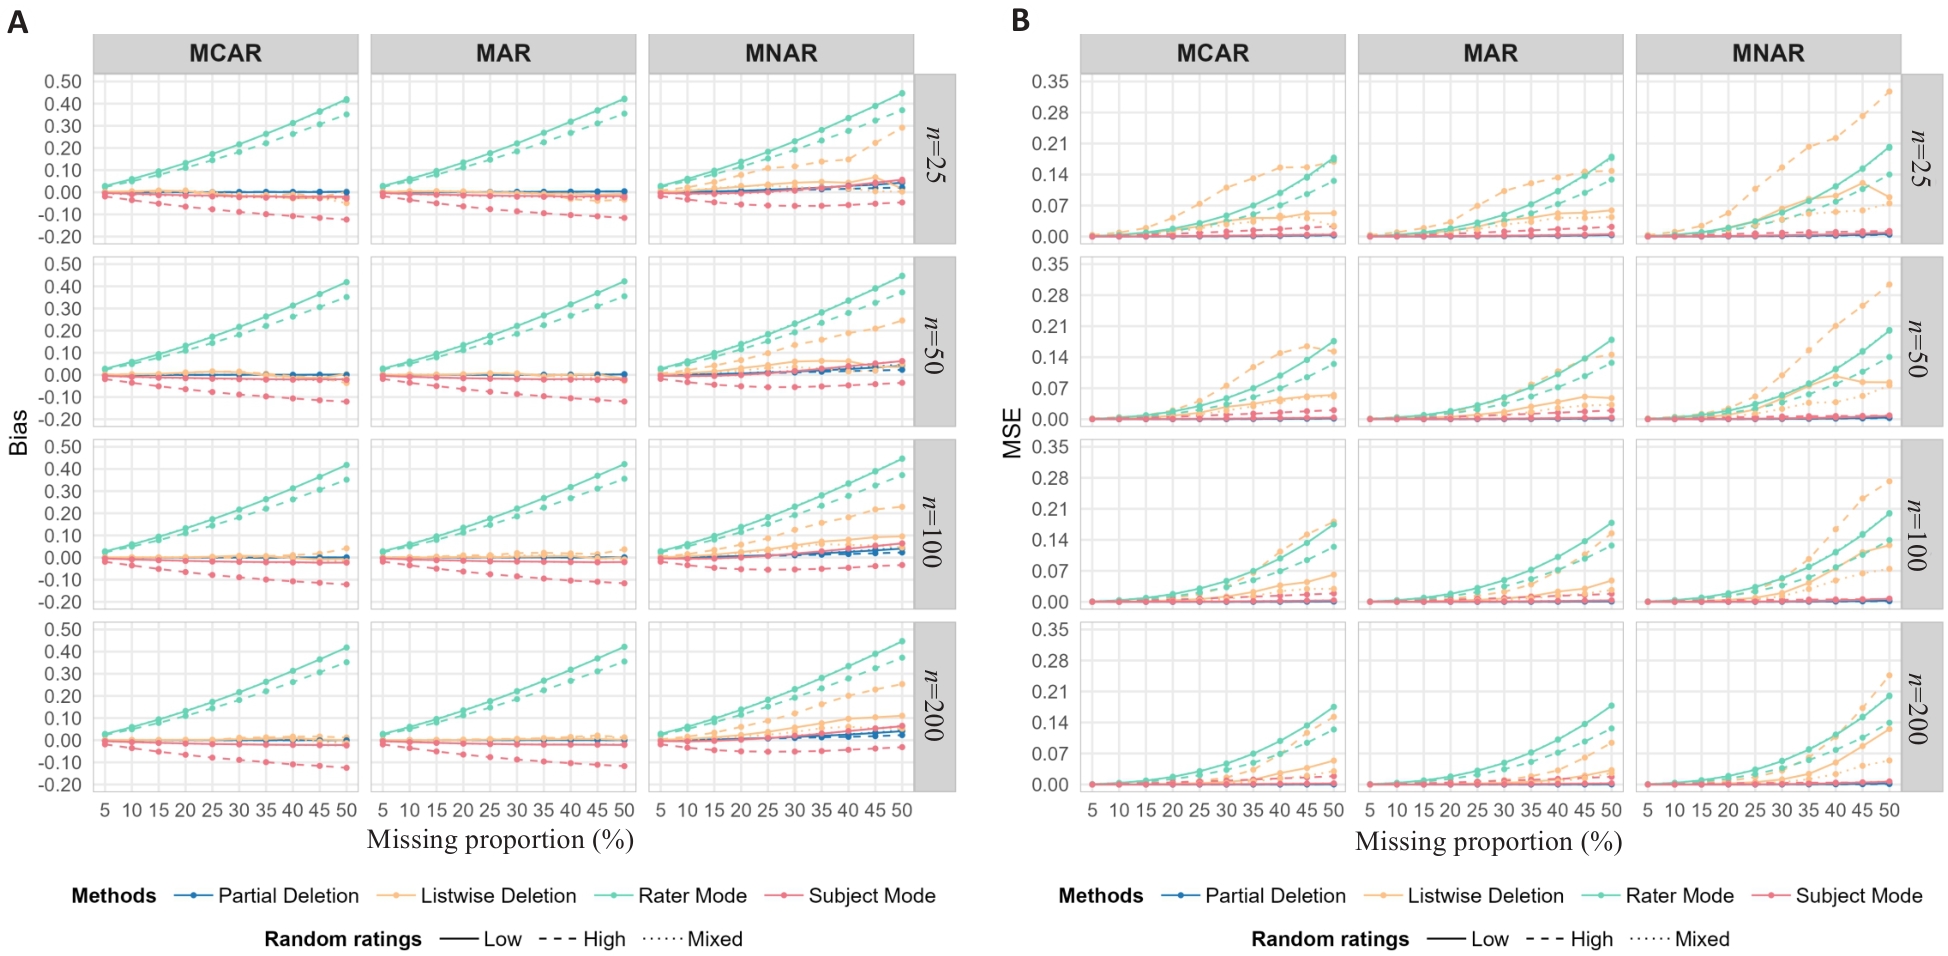
Fig.3 Bias or mean squared error (MSE) under balanced disease prevalence for 4 raters and 8 categories. A: Bias. B: MSE. Low: rq = 0.05, q=1, …, 8; High: rq =0.20, q=1, …, 8; Mixed: rq =0.05, rq +1=0.20, q=1, 3, 5, 7. Different colors represent different methods, and different line types represent different random rating probabilities.
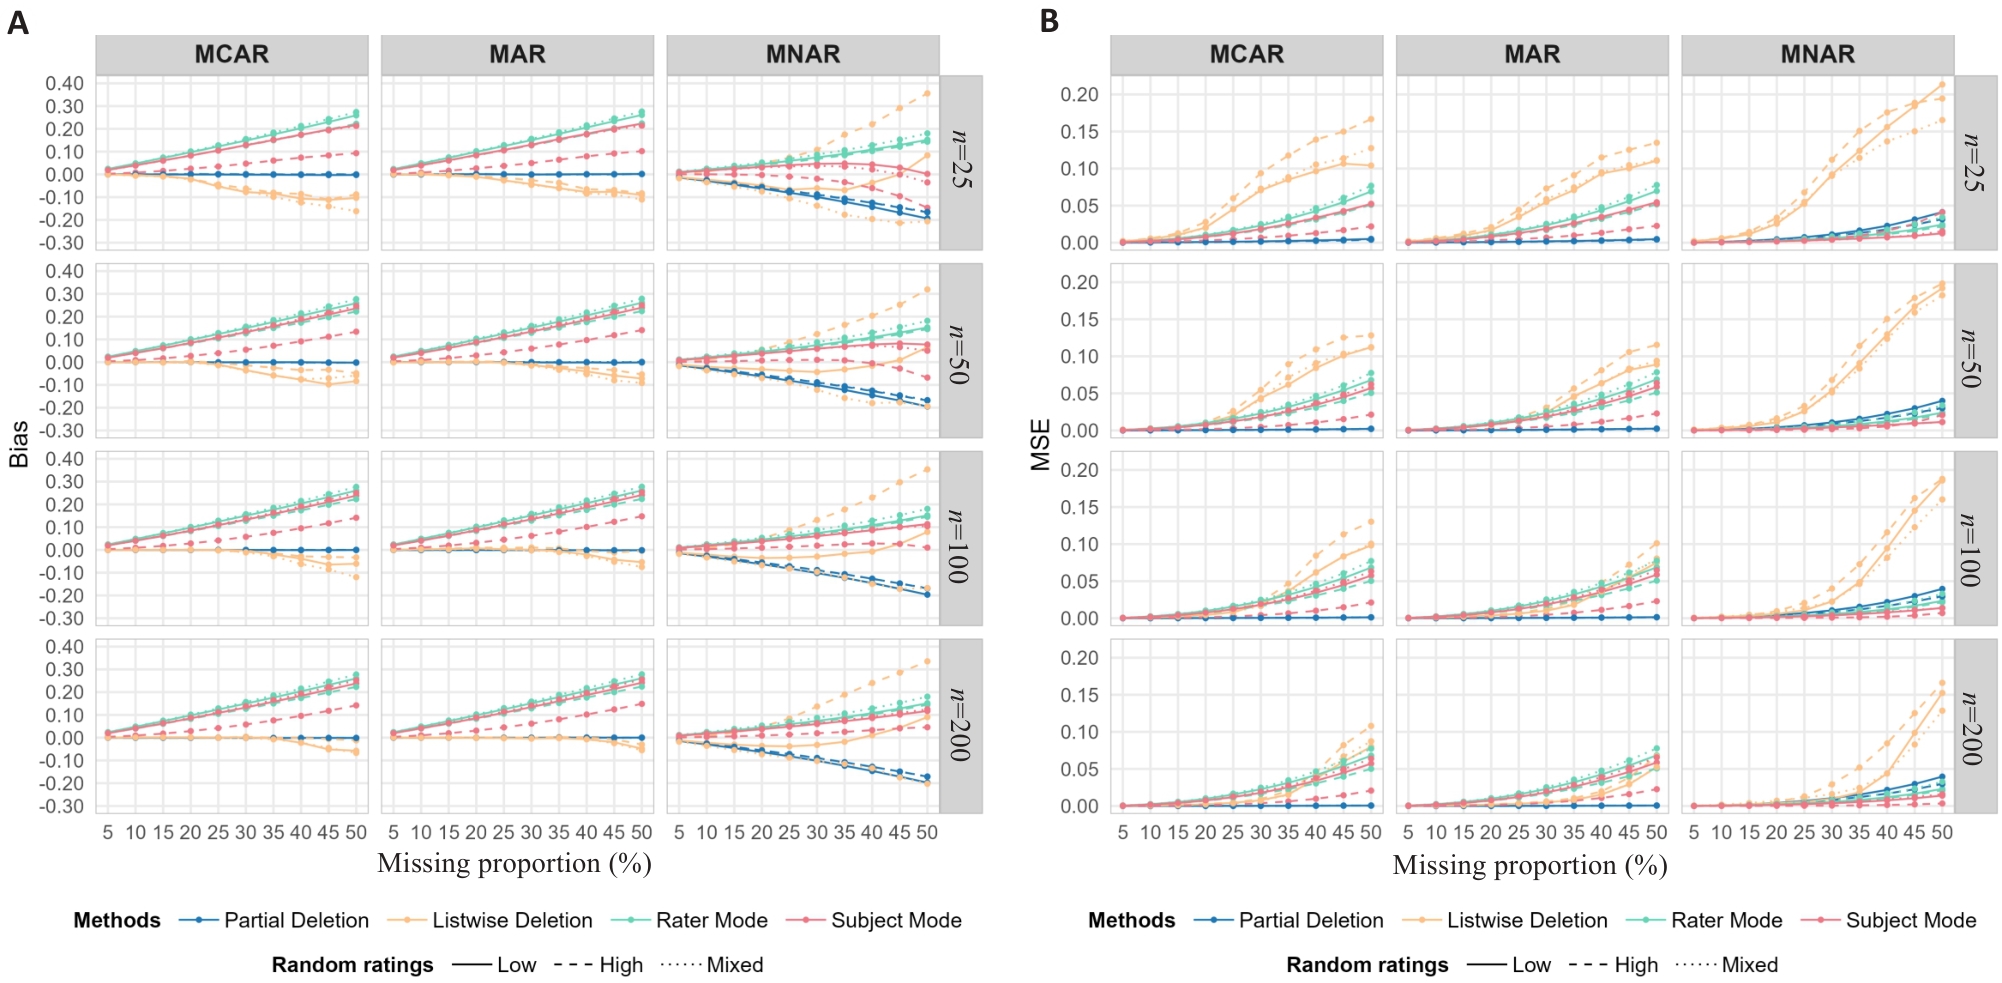
Fig.4 Bias or mean squared error (MSE) under skewed disease prevalence for 4 raters and 8 categories. A: Bias. B: MSE. Low: rq =0.05, q=1, …, 8; High: rq =0.20, q=1, …, 8; Mixed: rq =0.05, rq +1=0.20, q=1, 3, 5, 7. Different colors represent different methods, and different line types represent different random rating probabilities.
| [1] | Ghoshal A, Enninghorst N, Sisak K, et al. An interobserver reliability comparison between the orthopaedic trauma association's open fracture classification and the gustilo and anderson classification[J]. Bone Joint J, 2018, 100-B(2): 242-6. doi:10.1302/0301-620x.100b2.bjj-2017-0367.r1 |
| [2] | Herzog R, Elgort DR, Flanders AE, et al. Variability in diagnostic error rates of 10 MRI centers performing lumbar spine MRI examinations on the same patient within a 3-week period[J]. Spine J, 2017, 17(4): 554-61. doi:10.1016/j.spinee.2016.11.009 |
| [3] | Nordgaard J, Jessen K, Sæbye D, et al. Variability in clinical diagnoses during the ICD-8 and ICD-10 era[J]. Soc Psychiatry Psychiatr Epidemiol, 2016, 51(9): 1293-9. doi:10.1007/s00127-016-1265-9 |
| [4] | Gisev N, Bell JS, Chen TF. Interrater agreement and interrater reliability: key concepts, approaches, and applications[J]. Res Soc Adm Pharm, 2013, 9(3): 330-8. doi:10.1016/j.sapharm.2012.04.004 |
| [5] | Andrés AM, Marzo PF. Delta: a new measure of agreement between two raters[J]. Br J Math Stat Psychol, 2004, 57(Pt 1): 1-19. doi:10.1348/000711004849268 |
| [6] | Byrt T, Bishop J, Carlin JB. Bias, prevalence and kappa[J]. J Clin Epidemiol, 1993, 46(5): 423-9. doi:10.1016/0895-4356(93)90018-v |
| [7] | Mandrekar JN. Measures of interrater agreement[J]. J Thorac Oncol, 2011, 6(1): 6-7. doi:10.1097/jto.0b013e318200f983 |
| [8] | Feinstein AR, Cicchetti DV. High agreement but low kappa: I. the problems of two paradoxes[J]. J Clin Epidemiol, 1990, 43(6): 543-9. doi:10.1016/0895-4356(90)90158-l |
| [9] | Gwet KL. Computing inter-rater reliability and its variance in the presence of high agreement[J]. Br J Math Stat Psychol, 2008, 61(Pt 1): 29-48. doi:10.1348/000711006x126600 |
| [10] | Gwet KL. Variance estimation of nominal-scale inter-rater reliability with random selection of raters[J]. Psychometrika, 2008, 73(3): 407-30. doi:10.1007/s11336-007-9054-8 |
| [11] | Wongpakaran N, Wongpakaran T, Wedding D, et al. A comparison of Cohen's Kappa and Gwet's AC1 when calculating inter-rater reliability coefficients: a study conducted with personality disorder samples[J]. BMC Med Res Methodol, 2013, 13: 61. doi:10.1186/1471-2288-13-61 |
| [12] | Kuppens S, Holden G, Barker K, et al. A kappa-related decision: , Y, G, or AC1[J]. Soc Work Res, 2011, 35(3): 185-9. doi:10.1093/swr/35.3.185 |
| [13] | 公为洁, 赵 志, 顾豪高, 等. 二分类资料的五种一致性评价指标应用效果比较[J]. 中国卫生统计, 2016, 33(4): 636-8, 640. |
| [14] | Popplewell M, Reizes J, Zaslawski C. Appropriate statistics for determining chance-removed interpractitioner agreement[J]. J Altern Complement Med, 2019, 25(11): 1115-20. doi:10.1089/acm.2017.0297 |
| [15] | 邓建新, 单路宝, 贺德强, 等. 缺失数据的处理方法及其发展趋势[J]. 统计与决策, 2019, 35(23): 28-34. |
| [16] | De Raadt A, Warrens MJ, Bosker RJ, et al. Kappa coefficients for missing data[J]. Educ Psychol Meas, 2019, 79(3): 558-76. doi:10.1177/0013164418823249 |
| [17] | Little R, Rubin D. Statistical Analysis with Missing Data [M]. 3th ed, John Wiley & Sons, 2019. doi:10.1002/9781119482260 |
| [18] | 熊中敏, 郭怀宇, 吴月欣. 缺失数据处理方法研究综述[J]. 计算机工程与应用, 2021, 57(14): 27-38. |
| [19] | Naberezhneva N, Uleberg O, Dahlhaug M, et al. Excellent agreement of Norwegian trauma registry data compared to corresponding data in electronic patient records[J]. Scand J Trauma Resusc Emerg Med, 2023, 31(1): 50. doi:10.1186/s13049-023-01118-5 |
| [20] | Shrive FM, Stuart H, Quan HD, et al. Dealing with missing data in a multi-question depression scale: a comparison of imputation methods[J]. BMC Med Res Methodol, 2006, 6: 57. doi:10.1186/1471-2288-6-57 |
| [21] | Varmdal T, Ellekjær H, Fjærtoft H, et al. Inter-rater reliability of a national acute stroke register[J]. BMC Res Notes, 2015, 8: 584. doi:10.1186/s13104-015-1556-3 |
| [22] | Gwet KL. Handbook of Inter-Rater Reliability: The Definitive Guide to Measuring the Extent of Agreement Among Raters [M]. 4th ed, Advanced Analytics, 2014. |
| [23] | Heumann P, Aguado-Barrera ME, Avuzzi B, et al. Comparing symptom reporting by prostate cancer patients and healthcare professionals in the international multicentre REQUITE study[J]. Radiother Oncol, 2023, 178: 109426. doi:10.1016/j.radonc.2022.11.015 |
| [24] | Vestergaard T, Prasad SC, Schuster A, et al. Diagnostic accuracy and interobserver concordance: teledermoscopy of 600 suspicious skin lesions in southern Denmark[J]. J Eur Acad Dermatol Venereol, 2020, 34(7): 1601-8. doi:10.1111/jdv.16275 |
| [25] | Xu XY, Xia LZ, Zhang QM, et al. The ability of different imputation methods for missing values in mental measurement questionnaires[J]. BMC Med Res Methodol, 2020, 20(1): 42. doi:10.1186/s12874-020-00932-0 |
| [26] | 梁绮红, 陈昭宇, 张 峥, 等. 一致性评价系数应用于无序多分类资料的效果评价[J]. 南方医科大学学报, 2021, 41(9): 1374-80. |
| [27] | Nelson KP, Edwards D. Measures of agreement between many raters for ordinal classifications[J]. Stat Med, 2015, 34(23): 3116-32. doi:10.1002/sim.6546 |
| [28] | Heymans MW, Twisk JWR. Handling missing data in clinical research[J]. J Clin Epidemiol, 2022, 151: 185-8. doi:10.1016/j.jclinepi.2022.08.016 |
| [29] | 黎剑锋, 张静怡, 李立康, 等. 临床试验中缺失值的处理方法探讨[J]. 协和医学杂志, 2024, 15(5): 1165-72. |
| [30] | van Oest R, Girard JM. Weighting schemes and incomplete data: a generalized Bayesian framework for chance-corrected interrater agreement[J]. Psychol Methods, 2022, 27(6): 1069-88. |
| [31] | de Raadt A. Comparison studies on agreement coefficients with emphasis on missing data [M]. University of Groningen, 2020. |
| [32] | Hyun K. The prevention and handling of the missing data[J]. Korean J Anesthesiol, 2013, 64(5): 402-6. doi:10.4097/kjae.2013.64.5.402 |
| [33] | Permutt T. Sensitivity analysis for missing data in regulatory submissions[J]. Stat Med, 2016, 35(17): 2876-9. doi:10.1002/sim.6753 |
| [34] | Kanukula R, McKenzie JE, Cashin AG, et al. Variation observed in consensus judgments between pairs of reviewers when assessing the risk of bias due to missing evidence in a sample of published meta-analyses of nutrition research[J]. J Clin Epidemiol, 2024, 166: 111244. doi:10.1016/j.jclinepi.2023.111244 |
| [35] | Lang KM, Wu W. A comparison of methods for creating multiple imputations of nominal variables[J]. Multivariate Behav Res, 2017, 52(3): 290-304. doi:10.1080/00273171.2017.1289360 |
| [1] | Zihan LU, Fangjun HUANG, Guangyao CAI, Jihong LIU, Xin ZHEN. A multi-constraint representation learning model for identification of ovarian cancer with missing laboratory indicators [J]. Journal of Southern Medical University, 2025, 45(1): 170-178. |
| [2] | LIANG Qihong, CHEN Zhaoyu, ZHANG Zheng, HUANG Shuang, AN Shengli. Application of Coefficient for Evaluating Agreement in disordered multi-classification data [J]. Journal of Southern Medical University, 2021, 41(9): 1374-1380. |
| Viewed | ||||||
|
Full text |
|
|||||
|
Abstract |
|
|||||