Journal of Southern Medical University ›› 2026, Vol. 46 ›› Issue (1): 122-130.doi: 10.12122/j.issn.1673-4254.2026.01.13
Previous Articles Next Articles
Kai LI( ), Wenqian ZENG, Yanzi ZHANG, Xiuling ZHU, Bing GUO()
Received:2025-07-07
Online:2026-01-20
Published:2026-01-16
Contact:
Bing GUO
E-mail:likai05132024@163.com;guobing0111@scu.edu.cn
Supported by:Kai LI, Wenqian ZENG, Yanzi ZHANG, Xiuling ZHU, Bing GUO. Exposures to volatile organic compounds are positively correlated with risks of metabolic dysfunction-associated steatotic liver disease[J]. Journal of Southern Medical University, 2026, 46(1): 122-130.
Add to citation manager EndNote|Ris|BibTeX
URL: https://www.j-smu.com/EN/10.12122/j.issn.1673-4254.2026.01.13
| 92.6% | |||
| 99.5% | |||
| 99.7% | |||
| 94.0% | |||
| 99.4% | |||
| 99.1% | |||
| 87.2% | |||
| 99.9% | |||
| 95.2% | |||
| 99.8% | |||
| 98.8% | |||
| 99.4% | |||
| 99.9% | |||
| 97.2% | |||
| 99.9% |
Tab.1 Fifteen types of volatile organic compound metabolites (mVOCs) with detection rates exceeding 80% in the urine samples
| 92.6% | |||
| 99.5% | |||
| 99.7% | |||
| 94.0% | |||
| 99.4% | |||
| 99.1% | |||
| 87.2% | |||
| 99.9% | |||
| 95.2% | |||
| 99.8% | |||
| 98.8% | |||
| 99.4% | |||
| 99.9% | |||
| 97.2% | |||
| 99.9% |
| Variable | Overall (n=2122) | Non-MASLD (n=1149) | MASLD (n=973) | P |
|---|---|---|---|---|
| Age (year, Mean±SD) | 45.30 (14.17) | 43.43 (14.63) | 47.52 (13.27) | <0.001 |
| Gender [n (%)] | <0.001 | |||
| Male | 1168 (55%) | 602 (52%) | 566 (58%) | |
| Female | 954 (45%) | 547 (48%) | 407 (42%) | |
| Education level [n (%)] | 0.13 | |||
| Less than high school | 354 (17%) | 181 (16%) | 173 (18%) | |
| High school or equivalent | 413 (19%) | 212 (18%) | 201 (21%) | |
| College or above | 1355 (64%) | 756 (66%) | 599 (62%) | |
| Income level [n (%)] | 0.03 | |||
| Low income | 519 (24%) | 283 (25%) | 236 (24%) | |
| Middle income | 804 (38%) | 408 (36%) | 396 (41%) | |
| High income | 799 (38%) | 458 (40%) | 341 (35%) | |
| Marital status [n (%)] | <0.001 | |||
| Married | 1400 (66%) | 734 (64%) | 666 (68%) | |
| Divorced | 329 (16%) | 166 (14%) | 163 (17%) | |
| Single | 393 (19%) | 249 (22%) | 144 (15%) | |
| BMI (kg/m2, Mean±SD) | 29.19 (6.83) | 24.88 (3.48) | 34.27 (6.31) | <0.001 |
| Diabetes [n (%)] | 216 (10%) | 63 (5.5%) | 153 (16%) | <0.001 |
| Hypertension [n (%)] | 620 (29%) | 219 (19%) | 401 (41%) | <0.001 |
| Total cholesterol level (mmol/L, Mean±SD) | 4.94 (1.06) | 4.80 (1.00) | 5.11 (1.10) | <0.001 |
| Urinary creatinine level (mg/100 mL, Mean±SD) | 122.22 (79.13) | 113.38 (76.69) | 132.66 (80.72) | <0.001 |
Tab.2 General characteristics of the study population
| Variable | Overall (n=2122) | Non-MASLD (n=1149) | MASLD (n=973) | P |
|---|---|---|---|---|
| Age (year, Mean±SD) | 45.30 (14.17) | 43.43 (14.63) | 47.52 (13.27) | <0.001 |
| Gender [n (%)] | <0.001 | |||
| Male | 1168 (55%) | 602 (52%) | 566 (58%) | |
| Female | 954 (45%) | 547 (48%) | 407 (42%) | |
| Education level [n (%)] | 0.13 | |||
| Less than high school | 354 (17%) | 181 (16%) | 173 (18%) | |
| High school or equivalent | 413 (19%) | 212 (18%) | 201 (21%) | |
| College or above | 1355 (64%) | 756 (66%) | 599 (62%) | |
| Income level [n (%)] | 0.03 | |||
| Low income | 519 (24%) | 283 (25%) | 236 (24%) | |
| Middle income | 804 (38%) | 408 (36%) | 396 (41%) | |
| High income | 799 (38%) | 458 (40%) | 341 (35%) | |
| Marital status [n (%)] | <0.001 | |||
| Married | 1400 (66%) | 734 (64%) | 666 (68%) | |
| Divorced | 329 (16%) | 166 (14%) | 163 (17%) | |
| Single | 393 (19%) | 249 (22%) | 144 (15%) | |
| BMI (kg/m2, Mean±SD) | 29.19 (6.83) | 24.88 (3.48) | 34.27 (6.31) | <0.001 |
| Diabetes [n (%)] | 216 (10%) | 63 (5.5%) | 153 (16%) | <0.001 |
| Hypertension [n (%)] | 620 (29%) | 219 (19%) | 401 (41%) | <0.001 |
| Total cholesterol level (mmol/L, Mean±SD) | 4.94 (1.06) | 4.80 (1.00) | 5.11 (1.10) | <0.001 |
| Urinary creatinine level (mg/100 mL, Mean±SD) | 122.22 (79.13) | 113.38 (76.69) | 132.66 (80.72) | <0.001 |
| VOC | Model 1 | Model 2 | ||
|---|---|---|---|---|
| OR (95% CI) | P | OR (95% CI) | P | |
| 2-MHA | 1.02 (0.77-1.36) | 0.871 | 1.05 (0.93-1.18) | 0.427 |
| 3,4-MHA | 0.95 (0.78-1.15) | 0.582 | 1.03 (0.94-1.13) | 0.532 |
| AMCC | 0.85 (0.48-1.48) | 0.558 | 0.98 (0.90-1.08) | 0.743 |
| ATCA | 1.06 (0.95-1.18) | 0.279 | 1.13 (1.03-1.25) | 0.008 |
| BMA | 1.02 (0.94-1.12) | 0.585 | 1.07 (0.94-1.22) | 0.297 |
| CEMA | 1.98 (1.53-2.56) | <0.001 | 1.28 (1.11-1.46) | <0.001 |
| CYMA | 0.76 (0.55-1.04) | 0.086 | 0.98 (0.89-1.08) | 0.682 |
| DHBMA | 1.33 (1.14-1.56) | <0.001 | 1.29 (1.17-1.43) | <0.001 |
| 2HPMA | 1.00 (0.91-1.09) | 0.975 | 1.03 (0.94-1.12) | 0.539 |
| 3HPMA | 0.59 (0.46-0.76) | <0.001 | 1.02 (0.93-1.12) | 0.697 |
| MA | 1.12 (0.60-2.09) | 0.713 | 1.17 (0.94-1.46) | 0.164 |
| PGA | 0.95 (0.54-1.66) | 0.849 | 1.15 (0.94-1.42) | 0.181 |
| AAMA | 0.81 (0.67-0.99) | 0.036 | 1.00 (0.91-1.10) | 0.963 |
| MHBMA3 | 0.87 (0.64-1.18) | 0.357 | 1.05 (0.95-1.15) | 0.359 |
| HMPMA | 1.57 (1.11-2.21) | 0.011 | 1.09 (0.99-1.21) | 0.083 |
Tab.3 Correlation between single mVOC and metabolic dysfunction-associated steatotic liver disease (MASLD)
| VOC | Model 1 | Model 2 | ||
|---|---|---|---|---|
| OR (95% CI) | P | OR (95% CI) | P | |
| 2-MHA | 1.02 (0.77-1.36) | 0.871 | 1.05 (0.93-1.18) | 0.427 |
| 3,4-MHA | 0.95 (0.78-1.15) | 0.582 | 1.03 (0.94-1.13) | 0.532 |
| AMCC | 0.85 (0.48-1.48) | 0.558 | 0.98 (0.90-1.08) | 0.743 |
| ATCA | 1.06 (0.95-1.18) | 0.279 | 1.13 (1.03-1.25) | 0.008 |
| BMA | 1.02 (0.94-1.12) | 0.585 | 1.07 (0.94-1.22) | 0.297 |
| CEMA | 1.98 (1.53-2.56) | <0.001 | 1.28 (1.11-1.46) | <0.001 |
| CYMA | 0.76 (0.55-1.04) | 0.086 | 0.98 (0.89-1.08) | 0.682 |
| DHBMA | 1.33 (1.14-1.56) | <0.001 | 1.29 (1.17-1.43) | <0.001 |
| 2HPMA | 1.00 (0.91-1.09) | 0.975 | 1.03 (0.94-1.12) | 0.539 |
| 3HPMA | 0.59 (0.46-0.76) | <0.001 | 1.02 (0.93-1.12) | 0.697 |
| MA | 1.12 (0.60-2.09) | 0.713 | 1.17 (0.94-1.46) | 0.164 |
| PGA | 0.95 (0.54-1.66) | 0.849 | 1.15 (0.94-1.42) | 0.181 |
| AAMA | 0.81 (0.67-0.99) | 0.036 | 1.00 (0.91-1.10) | 0.963 |
| MHBMA3 | 0.87 (0.64-1.18) | 0.357 | 1.05 (0.95-1.15) | 0.359 |
| HMPMA | 1.57 (1.11-2.21) | 0.011 | 1.09 (0.99-1.21) | 0.083 |
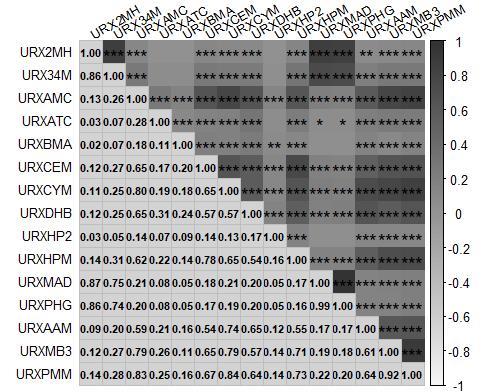
Fig.1 Correlation between the 15 mVOCs included in the study. The numbers in the figure represent the correlation coefficients between two VOCs. Darkest shades indicate a strong positive correlation (close to 1), while the light shades indicate a strong negative correlation (close to -1). The asterisks (*) within the squares denote the statistical significance of the correlation coefficients. *P<0.05, ** P<0.01, ***P<0.001).
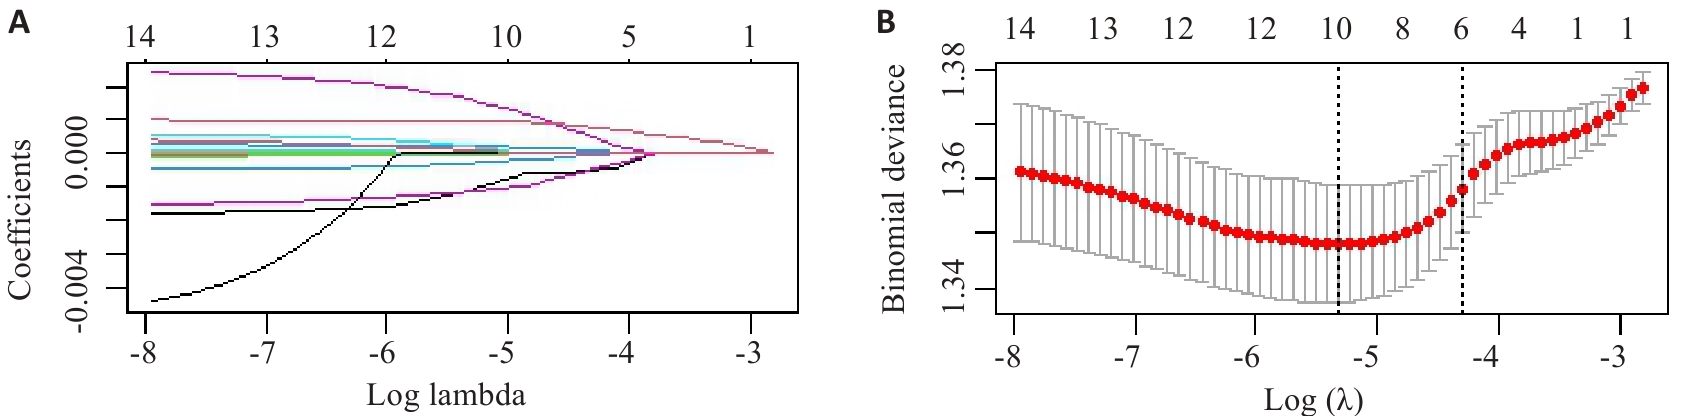
Fig.2 LASSO regression analysis of the 15 types of mVOCs included in the study. A: Screening pathway for mVOCs associated with MASLD risk. B: Correlation between log-transformed λ and MSE. The red dashed line and its error bars in B represent the mean MSE values and their corresponding 95% confidence intervals (95% CI). The left black dashed line indicates the optimal λ value yielding the minimum MSE, while the right black dashed line shows the λ value from the simplest model obtained at one standard error below the minimum MSE.
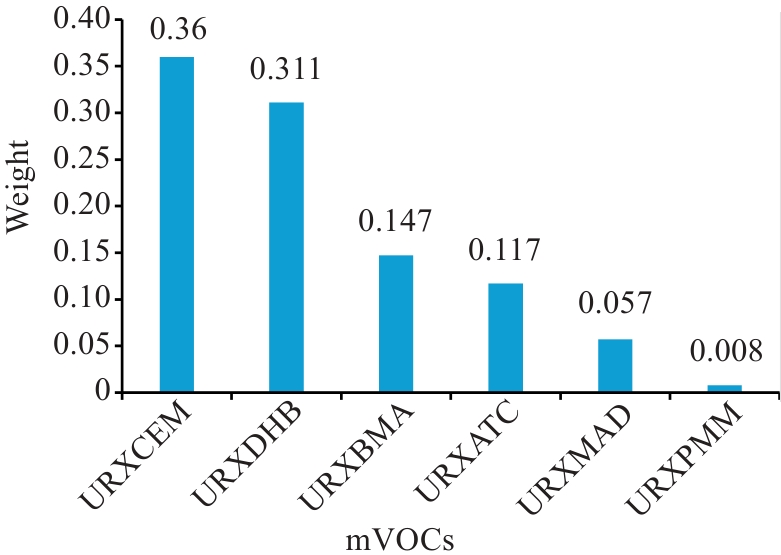
Fig. 3 WQS model forward regression of mVOCs mixtures with MASLD weight plots. The chart above were adjusted for age, gender, ethnicity, dietary patterns, income level, marital status, occupation, diabetes, hypertension, smoking status, and total cholesterol levels.
| Subgroup | OR (95% CI) | P | |
|---|---|---|---|
| Gender | |||
| Male | 1.21 (0.99, 1.47) | 0.056 | |
| Female | 1.06 (0.86, 1.30) | 0.579 | |
| Smoking status | |||
| Non-smoker | 1.10 (0.83, 1.46) | 0.501 | |
| Secondhand smoker | 1.27 (1.02, 1.57) | 0.031 | |
| Current smoker | 1.49 (1.19, 1.87) | <0.001 | |
Tab.4 Associations between different groupings of mVOCs and MASLD
| Subgroup | OR (95% CI) | P | |
|---|---|---|---|
| Gender | |||
| Male | 1.21 (0.99, 1.47) | 0.056 | |
| Female | 1.06 (0.86, 1.30) | 0.579 | |
| Smoking status | |||
| Non-smoker | 1.10 (0.83, 1.46) | 0.501 | |
| Secondhand smoker | 1.27 (1.02, 1.57) | 0.031 | |
| Current smoker | 1.49 (1.19, 1.87) | <0.001 | |
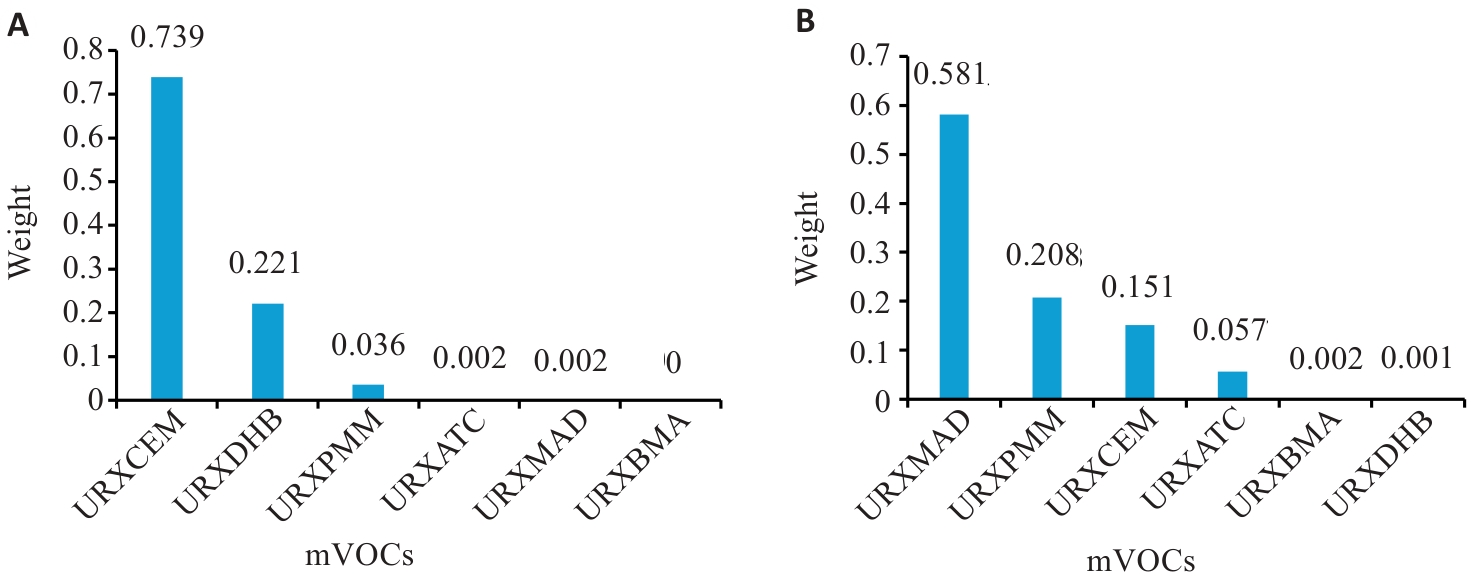
Fig. 4 WQS model forward regression of mVOCs mixtures with MASLD weight plots in groups with different smoking statuses. A: Weight map of mVOCs in the smoking group after adjusting for confounding factors. B: Weight map of mVOCs in the secondhand smoking exposure group after adjusting for confounding factors.
| [1] | Trefts E, Gannon M, Wasserman DH. The liver[J]. Curr Biol, 2017, 27(21): R1147-51. doi:10.1016/j.cub.2017.09.019 |
| [2] | Chalasani N, Younossi Z, Lavine JE, et al. The diagnosis and management of nonalcoholic fatty liver disease: Practice guidance from the American Association for the Study of Liver Diseases[J]. Hepatology, 2018, 67(1): 328-57. doi:10.1002/hep.29367 |
| [3] | Younossi ZM, Golabi P, Paik JM, et al. The global epidemiology of nonalcoholic fatty liver disease (NAFLD) and nonalcoholic steatohepatitis (NASH): a systematic review[J]. Hepatology, 2023, 77(4): 1335-47. doi:10.1097/hep.0000000000000004 |
| [4] | Inamdar AA, Morath S, Bennett JW. Fungal volatile organic compounds: more than just a funky smell?[J]. Annu Rev Microbiol, 2020, 74: 101-16. doi:10.1146/annurev-micro-012420-080428 |
| [5] | Zhou XH, Zhou X, Wang CM, et al. Environmental and human health impacts of volatile organic compounds: a perspective review[J]. Chemosphere, 2023, 313: 137489. doi:10.1016/j.chemosphere.2022.137489 |
| [6] | Lei T, Qian H, Yang JX, et al. The association analysis between exposure to volatile organic chemicals and obesity in the general USA population: a cross-sectional study from NHANES program[J]. Chemosphere, 2023, 315: 137738. doi:10.1016/j.chemosphere.2023.137738 |
| [7] | Hanna GB, Boshier PR, Markar SR, et al. Accuracy and methodologic challenges of volatile organic compound-based exhaled breath tests for cancer diagnosis: a systematic review and meta-analysis[J]. JAMA Oncol, 2019, 5(1): e182815. doi:10.1001/jamaoncol.2018.2815 |
| [8] | Wahlang B, Hardesty JE, Head KZ, et al. Hepatic injury caused by the environmental toxicant vinyl chloride is sex-dependent in mice[J]. Toxicol Sci, 2020, 174(1): 79-91. doi:10.1093/toxsci/kfz236 |
| [9] | Wang F, Liu F, Liu H, et al. Effects of immunological and hematological parameter in mice exposed to mixture of volatile organic compounds[J]. Inhal Toxicol, 2016, 28(4): 164-9. doi:10.3109/08958378.2016.1148087 |
| [10] | Duan XX, Chen ZH, Liao J, et al. The association analysis between exposure to volatile organic compounds and fatty liver disease in US Adults[J]. Dig Liver Dis, 2025, 57(2): 535-41. doi:10.1016/j.dld.2024.09.027 |
| [11] | Liu W, Cao ST, Shi D, et al. Single-chemical and mixture effects of multiple volatile organic compounds exposure on liver injury and risk of non-alcoholic fatty liver disease in a representative general adult population[J]. Chemosphere, 2023, 339: 139753. doi:10.1016/j.chemosphere.2023.139753 |
| [12] | Targher G, Byrne CD, Tilg H. MASLD: a systemic metabolic disorder with cardiovascular and malignant complications[J]. Gut, 2024, 73(4): 691-702. doi:10.1136/gutjnl-2023-330595 |
| [13] | Lazarus JV, Newsome PN, Francque SM, et al. Reply: a multi-society Delphi consensus statement on new fatty liver disease nomenclature[J]. Hepatology, 2024, 79(3): E93-4. doi:10.1097/hep.0000000000000696 |
| [14] | Billionnet C, Sherrill D, Annesi-Maesano I. Estimating the health effects of exposure to multi-pollutant mixture[J]. Ann Epidemiol, 2012, 22(2): 126-41. doi:10.1016/j.annepidem.2011.11.004 |
| [15] | Johnson CL, Paulose-Ram R, Ogden CL, et al. National health and nutrition examination survey: analytic guidelines, 1999-2010[J]. Vital Health Stat 2, 2013(161): 1-24. |
| [16] | Marti-Aguado D, Calleja JL, Vilar-Gomez E, et al. Low-to-moderate alcohol consumption is associated with increased fibrosis in individuals with metabolic dysfunction-associated steatotic liver disease[J]. J Hepatol, 2024, 81(6): 930-40. doi:10.1016/j.jhep.2024.06.036 |
| [17] | Alwis KU, Blount BC, Britt AS, et al. Simultaneous analysis of 28 urinary VOC metabolites using ultra high performance liquid chromatography coupled with electrospray ionization tandem mass spectrometry (UPLC-ESI/MSMS)[J]. Anal Chim Acta, 2012, 750: 152-60. doi:10.1016/j.aca.2012.04.009 |
| [18] | Bedogni G, Bellentani S, Miglioli L, et al. The Fatty Liver Index: a simple and accurate predictor of hepatic steatosis in the general population[J]. BMC Gastroenterol, 2006, 6: 33. doi:10.1186/1471-230x-6-33 |
| [19] | Park J, Kim G, Kim BS, et al. The associations of hepatic steatosis and fibrosis using fatty liver index and BARD score with cardiovascular outcomes and mortality in patients with new-onset type 2 diabetes: a nationwide cohort study[J]. Cardiovasc Diabetol, 2022, 21(1): 53. doi:10.1186/s12933-022-01483-y |
| [20] | Niu ZP, Duan ZZ, He WX, et al. Kidney function decline mediates the adverse effects of per- and poly-fluoroalkyl substances (PFAS) on uric acid levels and hyperuricemia risk[J]. J Hazard Mater, 2024, 471: 134312. doi:10.1016/j.jhazmat.2024.134312 |
| [21] | Dong R, Chang D, Shen C, et al. Association of volatile organic compound exposure with metabolic syndrome and its components: a nationwide cross-sectional study[J]. BMC Public Health, 2024, 24(1): 671. doi:10.1186/s12889-024-18198-2 |
| [22] | Oyerinde AS, Selvaraju V, Babu JR, et al. Potential role of oxidative stress in the production of volatile organic compounds in obesity[J]. Antioxidants: Basel, 2023, 12(1): 129. doi:10.3390/antiox12010129 |
| [23] | 国务院办公厅关于印发新污染物治理行动方案的通知. 中华人民共和国国务院公报(2022.16号). |
| [24] | 张伟霞, 陈柄旭. 国内外VOCs控制技术面面观[J]. 中国经济周刊, 2017, (17): 72-3. |
| [25] | Zhang WP, Lin AQ, Chen WQ. The effect of dietary oxidation balance scores and volatile organic compounds exposures on inflammation[J]. Ecotoxicol Environ Saf, 2024, 286: 117163. doi:10.1016/j.ecoenv.2024.117163 |
| [26] | Hu YZ, Niu ZP, Cao CS, et al. Volatile organic compounds (VOC) metabolites in urine are associated with increased systemic inflammation levels, and smokers are identified as a vulnerable population[J]. Ecotoxicol Environ Saf, 2024, 288: 117398. doi:10.1016/j.ecoenv.2024.117398 |
| [27] | McGraw KE, Domingo-Relloso A, Riggs DW, et al. Exposure to volatile organic compounds and blood pressure in NHANES 2011 to 2018[J]. Hypertension, 2025, 82(1): 136-48. doi:10.1161/hypertensionaha.124.23695 |
| [28] | Kuang HX, Feng JL, Li ZL, et al. Volatile organic compounds from second-hand smoke may increase susceptibility of children through oxidative stress damage[J]. Environ Res, 2022, 207: 112227. doi:10.1016/j.envres.2021.112227 |
| [29] | Mohammad MK, Avila D, Zhang JW, et al. Acrolein cytotoxicity in hepatocytes involves endoplasmic reticulum stress, mitochondrial dysfunction and oxidative stress[J]. Toxicol Appl Pharmacol, 2012, 265(1): 73-82. doi:10.1016/j.taap.2012.09.021 |
| [30] | Moghe A, Ghare S, Lamoreau B, et al. Molecular mechanisms of acrolein toxicity: relevance to human disease[J]. Toxicol Sci, 2015, 143(2): 242-55. doi:10.1093/toxsci/kfu233 |
| [31] | Wang B, Wang X, Yu LL, et al. Acrylamide exposure increases cardiovascular risk of general adult population probably by inducing oxidative stress, inflammation, and TGF-β1: a prospective cohort study[J]. Environ Int, 2022, 164: 107261. doi:10.1016/j.envint.2022.107261 |
| [32] | Wang B, Liu W, Yu L, et al. Acrolein exposure impaired glucose homeostasis and increased risk of type 2 diabetes: an urban adult population-based cohort study with repeated measures[J]. Environ Sci Technol, 2023, 57(18): 7162-73. doi:10.1021/acs.est.2c09299 |
| [33] | Lang AL, Beier JI. Interaction of volatile organic compounds and underlying liver disease: a new paradigm for risk[J]. Biol Chem, 2018, 399(11): 1237-48. doi:10.1515/hsz-2017-0324 |
| [34] | Tan X, Zhao T, Wang Z, et al. Acrylamide defects the expression pattern of the circadian clock and mitochondrial dynamics in C57BL/6J mice liver and HepG2 cells[J]. J Agric Food Chem, 2018, 66(39): 10252-66. doi:10.1021/acs.jafc.8b02473 |
| [35] | Chen WY, Wang M, Zhang JW, et al. Acrolein disrupts tight junction proteins and causes endoplasmic reticulum stress-mediated epithelial cell death leading to intestinal barrier dysfunction and permeability[J]. Am J Pathol, 2017, 187(12): 2686-97. doi:10.1016/j.ajpath.2017.08.015 |
| [36] | Lu Y, Zhang Y, Deng Y, et al. Uptake and accumulation of polystyrene microplastics in zebrafish (Danio rerio) and toxic effects in liver[J]. Environ Sci Technol, 2016, 50(7): 4054-60. doi:10.1021/acs.est.6b00183 |
| [37] | Wang Y, Yu Y, Zhang X, et al. Combined association of urinary volatile organic compounds with chronic bronchitis and emphysema among adults in NHANES 2011-2014: The mediating role of inflammation[J]. Chemosphere, 2024, 361: 141485. doi:10.1016/j.chemosphere.2024.141485 |
| [38] | Costello S, Picciotto S, Rehkopf DH, et al. Social disparities in heart disease risk and survivor bias among autoworkers: an examination based on survival models and g-estimation[J]. Occup Environ Med, 2015, 72(2): 138-44. doi:10.1136/oemed-2014-102168 |
| [39] | Konkle SL, Zierold KM, Taylor KC, et al. National secular trends in ambient air volatile organic compound levels and biomarkers of exposure in the United States[J]. Environ Res, 2020, 182: 108991. doi:10.1016/j.envres.2019.108991 |
| No related articles found! |
| Viewed | ||||||
|
Full text |
|
|||||
|
Abstract |
|
|||||