Journal of Southern Medical University ›› 2024, Vol. 44 ›› Issue (6): 1209-1216.doi: 10.12122/j.issn.1673-4254.2024.06.23
Chang SUN1( ), Shiyao ZHENG1,3, Mei LI1,4, Ming YANG1, Mengyuan QIN1, Yuan XU1, Weihua LIANG1, Jianmin HU1, Lianghai WANG1, Feng LI1,2, Hong ZHOU5, Lan YANG1()
Received:2023-10-11
Online:2024-06-20
Published:2024-07-01
Contact:
Lan YANG
E-mail:sunchangyysw@163.com;yl-branda@163.com
Supported by:Chang SUN, Shiyao ZHENG, Mei LI, Ming YANG, Mengyuan QIN, Yuan XU, Weihua LIANG, Jianmin HU, Lianghai WANG, Feng LI, Hong ZHOU, Lan YANG. High expression of the stemness-associated molecule Nanog in esophageal squamous cell carcinoma tissues promotes tumor invasion and metastasis by activating the TGF‑β signaling pathway[J]. Journal of Southern Medical University, 2024, 44(6): 1209-1216.
Add to citation manager EndNote|Ris|BibTeX
URL: https://www.j-smu.com/EN/10.12122/j.issn.1673-4254.2024.06.23
| Clinicopathological parameters | n | Percentage (%) |
|---|---|---|
| Age (year) | ||
| <60 | 73 | 57.48 |
| ≥60 | 54 | 42.52 |
| Gender | ||
| Male | 78 | 61.42 |
| Female | 49 | 38.58 |
| Differentiation | ||
| High | 40 | 31.5 |
| Medium | 72 | 56.69 |
| Low | 15 | 11.81 |
| T stage | ||
| T1 | 16 | 12.6 |
| T2 | 52 | 40.94 |
| T3-T4 | 40 | 46.46 |
| Lymph node metastasis | ||
| + | 84 | 66.14 |
| - | 43 | 33.86 |
Tab.1 Clinical and pathological characteristics of 127 esophageal cancer patients
| Clinicopathological parameters | n | Percentage (%) |
|---|---|---|
| Age (year) | ||
| <60 | 73 | 57.48 |
| ≥60 | 54 | 42.52 |
| Gender | ||
| Male | 78 | 61.42 |
| Female | 49 | 38.58 |
| Differentiation | ||
| High | 40 | 31.5 |
| Medium | 72 | 56.69 |
| Low | 15 | 11.81 |
| T stage | ||
| T1 | 16 | 12.6 |
| T2 | 52 | 40.94 |
| T3-T4 | 40 | 46.46 |
| Lymph node metastasis | ||
| + | 84 | 66.14 |
| - | 43 | 33.86 |
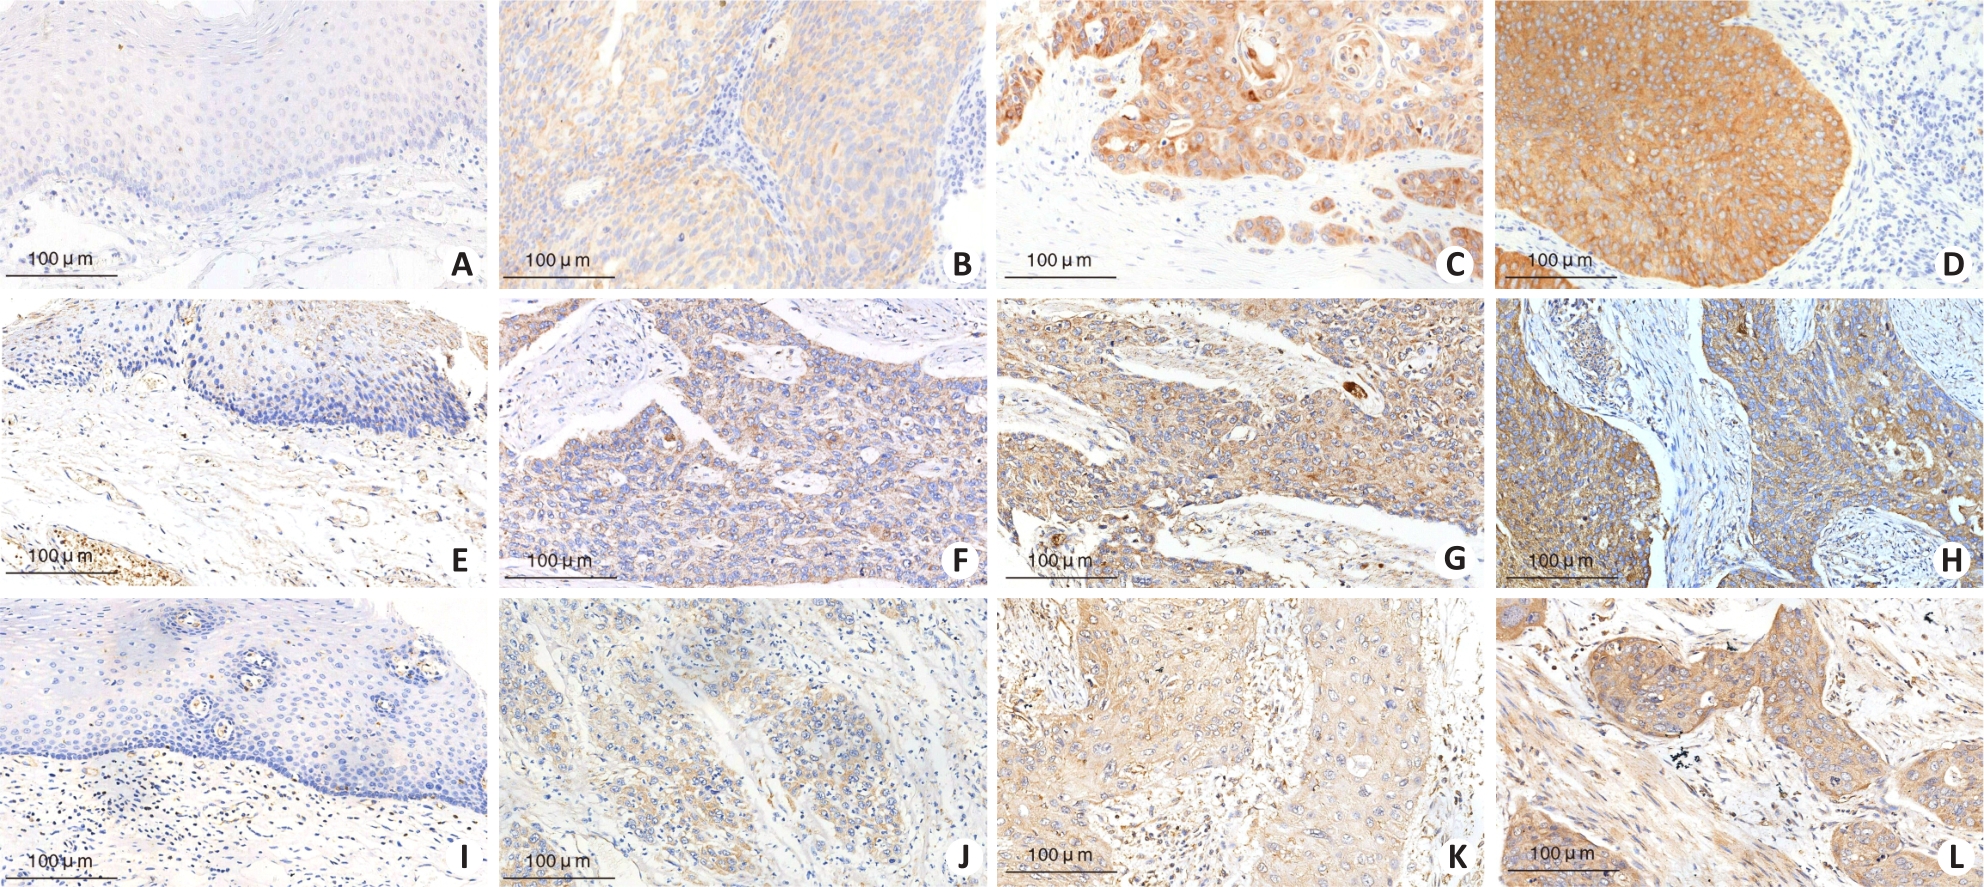
Fig.1 Immunohistochemical staining of Nanog, MMP-2, and MMP-9 proteins in esophageal squamous cell carcinoma tissues and adjacent normal tissues. A: Negative expression of Nanog in adjacent normal tissues. B: Weak positive expression (1+) of Nanog in esophageal squamous cell carcinoma tissues. C: Moderate positive expression (2+) of Nanog in esophageal squamous cell carcinoma tissues. D: Strong positive expression (3+) of Nanog in esophageal squamous cell carcinoma tissues. E: Negative expression of MMP-2 in adjacent normal tissues. F: Weak positive expression (1+) of MMP-2 in esophageal squamous cell carcinoma tissues. G: Moderate positive expression (2+) of MMP-2 in esophageal squamous cell carcinoma tissues. H: Strong positive expression (3+) of MMP-2 in esophageal squamous cell carcinoma tissues. I: Negative expression (-) of MMP-9 in adjacent normal tissues. J: Weak positive expression (1+) of MMP-9 in esophageal squamous cell carcinoma tissues. K: Moderate positive expression (2+) of MMP-9 in esophageal squamous cell carcinoma tissues. L: Strong positive expression (3+) of MMP-9 in esophageal squamous cell carcinoma tissues.
| Protein | Tissue samples | n | High expression | Low expression | χ2 | P |
|---|---|---|---|---|---|---|
| Nanog | ESCC tissue | 122 | 79 | 43 | 70.475 | <0.01 |
| paraneoplastic tissue | 79 | 4 | 75 | |||
| MMP-2 | ESCC tissue | 99 | 58 | 41 | 35.415 | <0.01 |
| paraneoplastic tissue | 73 | 10 | 63 | |||
| MMP-9 | ESCC tissue | 119 | 60 | 59 | 46.605 | <0.01 |
| paraneoplastic tissue | 81 | 3 | 78 |
Tab.2 Expression of Nanog, MMP-2 and MMP-9 protein in esophageal squamous cell carcinoma and adjacent tissues
| Protein | Tissue samples | n | High expression | Low expression | χ2 | P |
|---|---|---|---|---|---|---|
| Nanog | ESCC tissue | 122 | 79 | 43 | 70.475 | <0.01 |
| paraneoplastic tissue | 79 | 4 | 75 | |||
| MMP-2 | ESCC tissue | 99 | 58 | 41 | 35.415 | <0.01 |
| paraneoplastic tissue | 73 | 10 | 63 | |||
| MMP-9 | ESCC tissue | 119 | 60 | 59 | 46.605 | <0.01 |
| paraneoplastic tissue | 81 | 3 | 78 |
| Clinicopathological parameters | Nanog | χ2 | P | MMP-2 | χ2 | P | MMP-9 | χ2 | P | ||||||
|---|---|---|---|---|---|---|---|---|---|---|---|---|---|---|---|
| n | High expression | Low expression | n | High expression | Low expression | n | High expression | Low expression | |||||||
| Gender | |||||||||||||||
| Male | 76 | 50 | 26 | 0.095 | 0.758 | 57 | 31 | 26 | 0.977 | 0.41 | 69 | 35 | 34 | 0.006 | 1.000 |
| Female | 46 | 29 | 17 | 42 | 27 | 15 | 50 | 25 | 25 | ||||||
| Age (year) | |||||||||||||||
| <60 | 70 | 45 | 25 | 0.016 | 0.900 | 60 | 40 | 20 | 4.099 | 0.060 | 72 | 37 | 35 | 0.068 | 0.852 |
| ≥60 | 52 | 34 | 18 | 39 | 18 | 21 | 47 | 23 | 24 | ||||||
| T stage | |||||||||||||||
| T1 | 15 | 2 | 13 | 23.90 | <0.01 | 8 | 2 | 6 | 6.029 | 0.049 | 14 | 1 | 13 | 11.89 | 0.003 |
| T2 | 50 | 31 | 19 | 45 | 31 | 14 | 50 | 28 | 22 | ||||||
| T3-T4 | 57 | 46 | 11 | 46 | 25 | 21 | 55 | 31 | 24 | ||||||
| Lymph node metastasis | |||||||||||||||
| + | 80 | 55 | 25 | 1.626 | 0.202 | 66 | 46 | 20 | 10.08 | 0.020 | 79 | 46 | 33 | 5.731 | 0.020 |
| - | 42 | 24 | 18 | 33 | 12 | 21 | 40 | 14 | 26 | ||||||
| Differentiation | |||||||||||||||
| High | 36 | 19 | 17 | 5.483 | 0.064 | 31 | 18 | 13 | 0.268 | 0.875 | 13 | 6 | 7 | 2.534 | 0.282 |
| Medium | 71 | 47 | 24 | 59 | 34 | 25 | 67 | 38 | 29 | ||||||
| Low | 15 | 13 | 2 | 9 | 6 | 3 | 39 | 16 | 23 | ||||||
Tab.3 Clinical-pathological parameters of patients with esophageal squamous cell carcinoma having high or low Nanog, MMP-2 and MMP-9 protein expressions
| Clinicopathological parameters | Nanog | χ2 | P | MMP-2 | χ2 | P | MMP-9 | χ2 | P | ||||||
|---|---|---|---|---|---|---|---|---|---|---|---|---|---|---|---|
| n | High expression | Low expression | n | High expression | Low expression | n | High expression | Low expression | |||||||
| Gender | |||||||||||||||
| Male | 76 | 50 | 26 | 0.095 | 0.758 | 57 | 31 | 26 | 0.977 | 0.41 | 69 | 35 | 34 | 0.006 | 1.000 |
| Female | 46 | 29 | 17 | 42 | 27 | 15 | 50 | 25 | 25 | ||||||
| Age (year) | |||||||||||||||
| <60 | 70 | 45 | 25 | 0.016 | 0.900 | 60 | 40 | 20 | 4.099 | 0.060 | 72 | 37 | 35 | 0.068 | 0.852 |
| ≥60 | 52 | 34 | 18 | 39 | 18 | 21 | 47 | 23 | 24 | ||||||
| T stage | |||||||||||||||
| T1 | 15 | 2 | 13 | 23.90 | <0.01 | 8 | 2 | 6 | 6.029 | 0.049 | 14 | 1 | 13 | 11.89 | 0.003 |
| T2 | 50 | 31 | 19 | 45 | 31 | 14 | 50 | 28 | 22 | ||||||
| T3-T4 | 57 | 46 | 11 | 46 | 25 | 21 | 55 | 31 | 24 | ||||||
| Lymph node metastasis | |||||||||||||||
| + | 80 | 55 | 25 | 1.626 | 0.202 | 66 | 46 | 20 | 10.08 | 0.020 | 79 | 46 | 33 | 5.731 | 0.020 |
| - | 42 | 24 | 18 | 33 | 12 | 21 | 40 | 14 | 26 | ||||||
| Differentiation | |||||||||||||||
| High | 36 | 19 | 17 | 5.483 | 0.064 | 31 | 18 | 13 | 0.268 | 0.875 | 13 | 6 | 7 | 2.534 | 0.282 |
| Medium | 71 | 47 | 24 | 59 | 34 | 25 | 67 | 38 | 29 | ||||||
| Low | 15 | 13 | 2 | 9 | 6 | 3 | 39 | 16 | 23 | ||||||
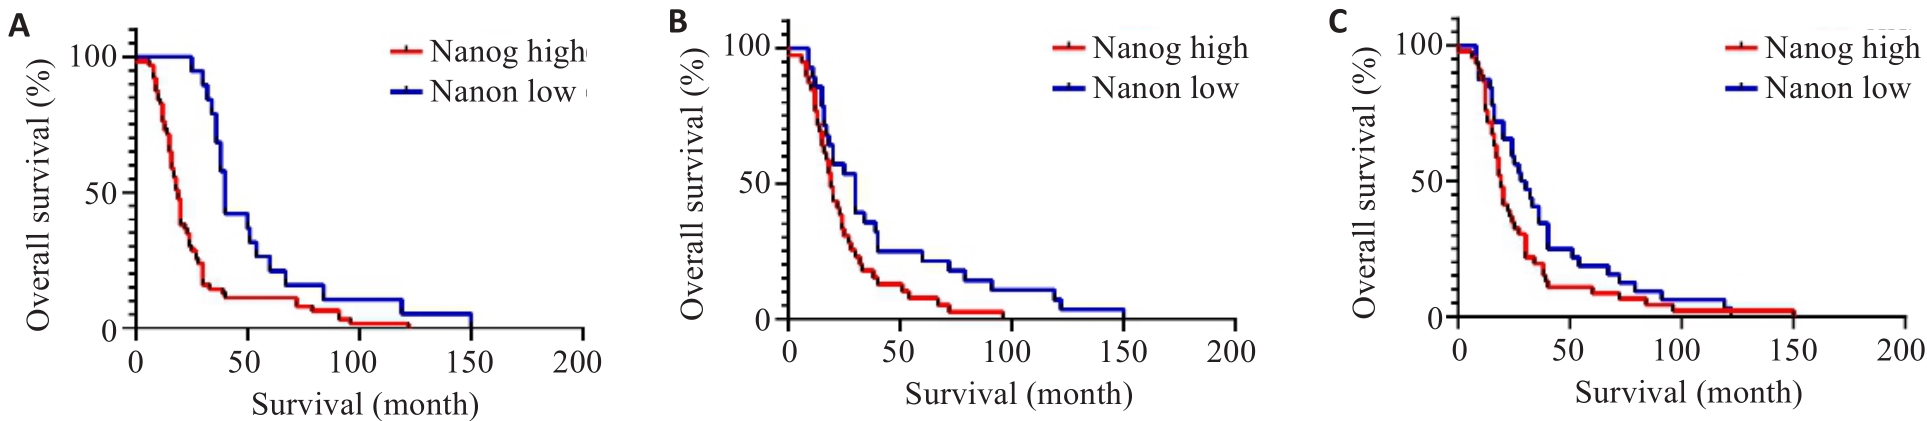
Fig.2 Postoperative survival curves of esophageal squamous cell carcinoma patients with low and high Nanog, MMP-2 and MMP-9 protein expressions. A: Survival curves of patients with high and low Nanog expressions (P<0.001). B: Survival curves of patients with high and low MMP-2 protein expression (P=0.004). C: Survival curves of patients with high and low MMP-9 protein expressions (P=0.017).
| Nanog | MMP-2 | r | P | MMP-9 | r | P | ||||
|---|---|---|---|---|---|---|---|---|---|---|
| n | High expression | Low expression | n | High expression | Low expression | |||||
| High expression | 66 | 43 | 23 | 0.205 | 0.045 | 74 | 46 | 28 | 0.307 | 0.001 |
| Low expression | 30 | 13 | 17 | 40 | 12 | 28 | ||||
Tab.4 Correlation between expressions of Nanog and invasion- and migration-related proteins in esophageal cancer
| Nanog | MMP-2 | r | P | MMP-9 | r | P | ||||
|---|---|---|---|---|---|---|---|---|---|---|
| n | High expression | Low expression | n | High expression | Low expression | |||||
| High expression | 66 | 43 | 23 | 0.205 | 0.045 | 74 | 46 | 28 | 0.307 | 0.001 |
| Low expression | 30 | 13 | 17 | 40 | 12 | 28 | ||||
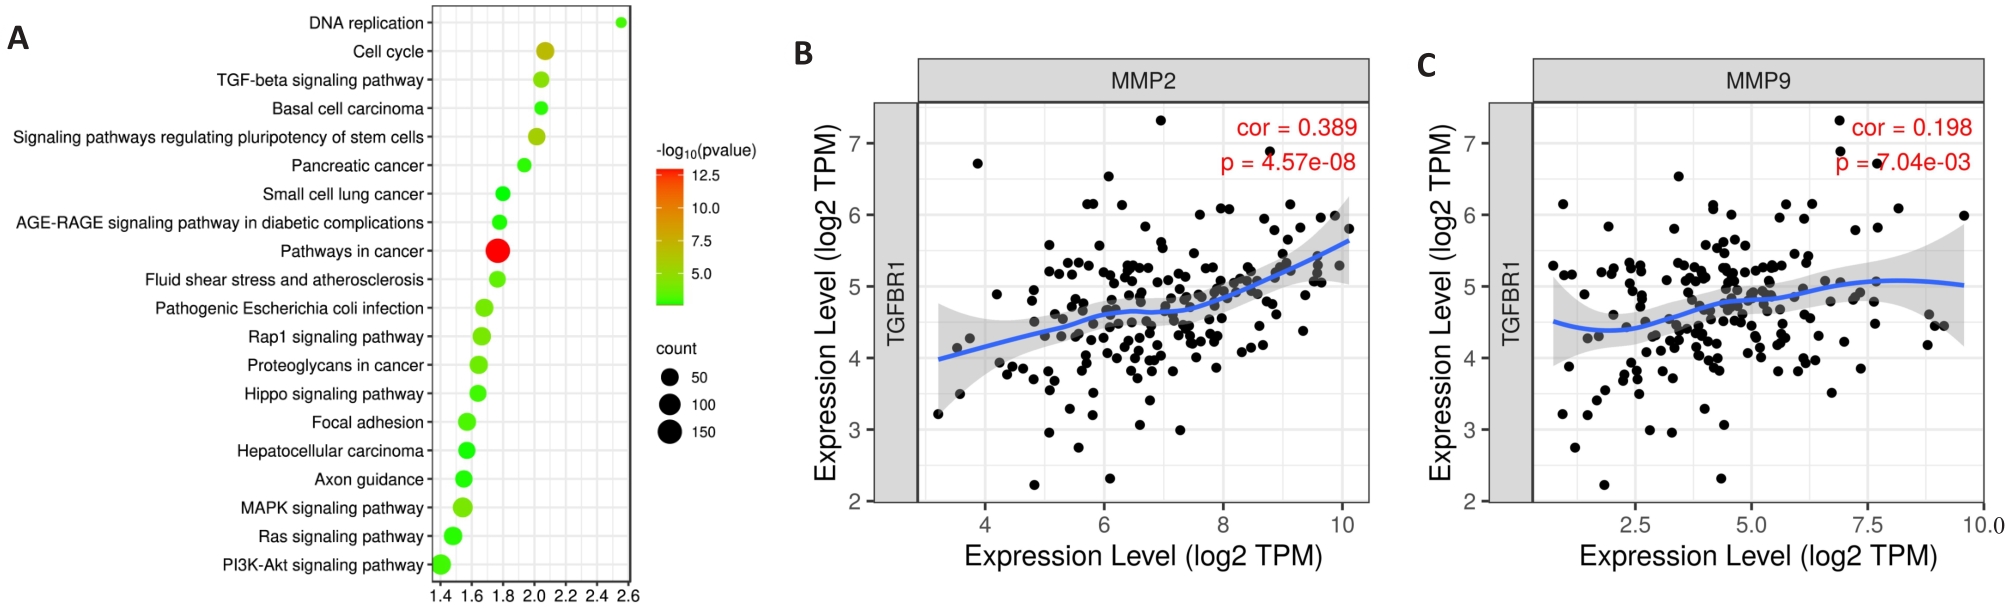
Fig.3 Bioinformatics analysis. A: KEGG pathway enrichment analysis of differentially expressed genes in the gene chip dataset GSE13834. B: Scatter plot showing the correlation between TβR1 and MMP-2 expression in esophageal cancer. C: Scatter plot showing the correlation between TβR1 and MMP-9 expression in esophageal cancer.
| Protein | TβR1 | r | P | p-Smad2/3 | r | P | |||||
|---|---|---|---|---|---|---|---|---|---|---|---|
| n High expression | Low expression | n High expression | Low expression | ||||||||
| Nanog | High expression | 68 | 50 | 18 | 0.318 | 0.001 | 68 | 50 | 18 | 0.301 | 0.002 |
| Low expression | 32 | 13 | 19 | 35 | 15 | 20 | |||||
| MMP-2 | High expression | 56 | 47 | 9 | 0.448 | <0.001 | 52 | 40 | 12 | 0.303 | 0.004 |
| Low expression | 47 | 18 | 29 | 55 | 27 | 28 | |||||
| MMP-9 | High expression | 53 | 39 | 14 | 0.202 | 0.045 | 54 | 40 | 14 | 0.239 | 0.015 |
| Low expression | 50 | 26 | 24 | 51 | 27 | 24 | |||||
Tab.5 Correlation of Nanog, MMP-2 and MMP-9 protein expressions with expressions of TGF-β signaling pathway proteins in ESCC
| Protein | TβR1 | r | P | p-Smad2/3 | r | P | |||||
|---|---|---|---|---|---|---|---|---|---|---|---|
| n High expression | Low expression | n High expression | Low expression | ||||||||
| Nanog | High expression | 68 | 50 | 18 | 0.318 | 0.001 | 68 | 50 | 18 | 0.301 | 0.002 |
| Low expression | 32 | 13 | 19 | 35 | 15 | 20 | |||||
| MMP-2 | High expression | 56 | 47 | 9 | 0.448 | <0.001 | 52 | 40 | 12 | 0.303 | 0.004 |
| Low expression | 47 | 18 | 29 | 55 | 27 | 28 | |||||
| MMP-9 | High expression | 53 | 39 | 14 | 0.202 | 0.045 | 54 | 40 | 14 | 0.239 | 0.015 |
| Low expression | 50 | 26 | 24 | 51 | 27 | 24 | |||||
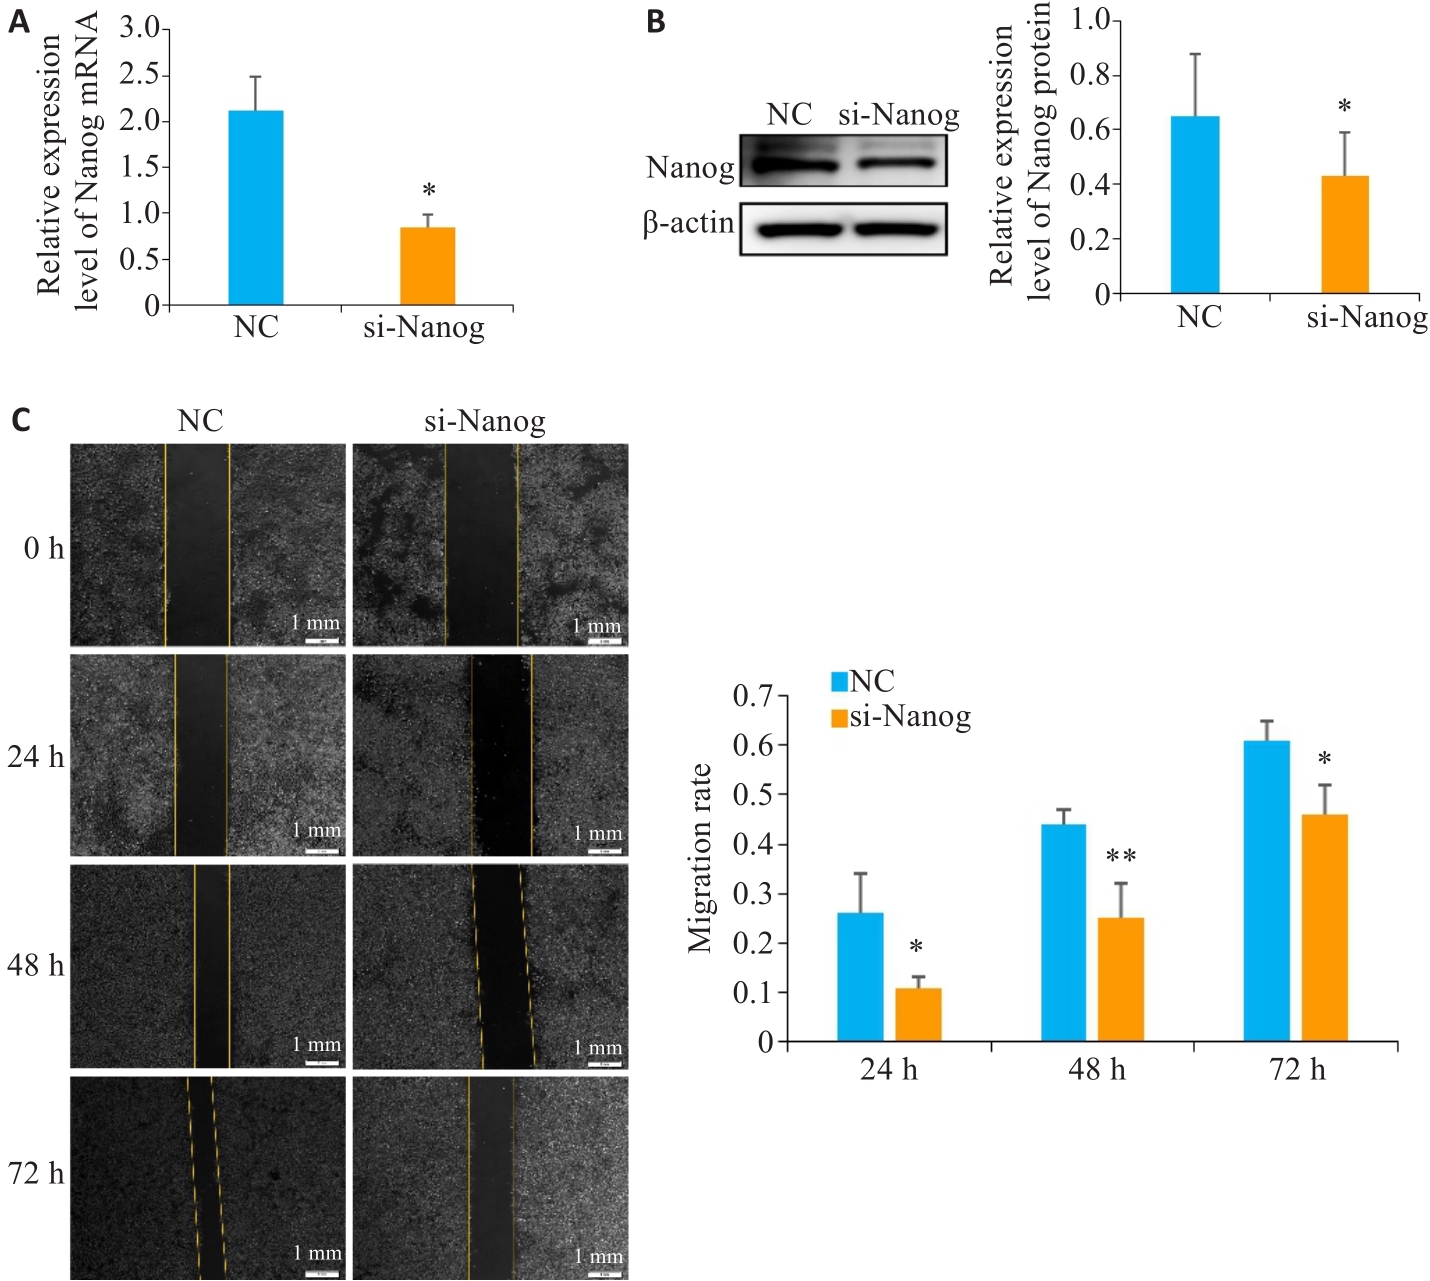
Fig.4 Effect of Nanog knockdown on migration of esophageal squamous cell carcinoma cells. A: qRT-PCR of Nanog mRNA expression levels after Nanog knockdown (P<0.05). B: Western blotting of Nanog protein expression after Nanog knockdown. C: Scratch assay for assessing changes in migration ability of TE-1 cells after Nanog knockdown. *P˂0.05, **P˂0.01 vs NC group.
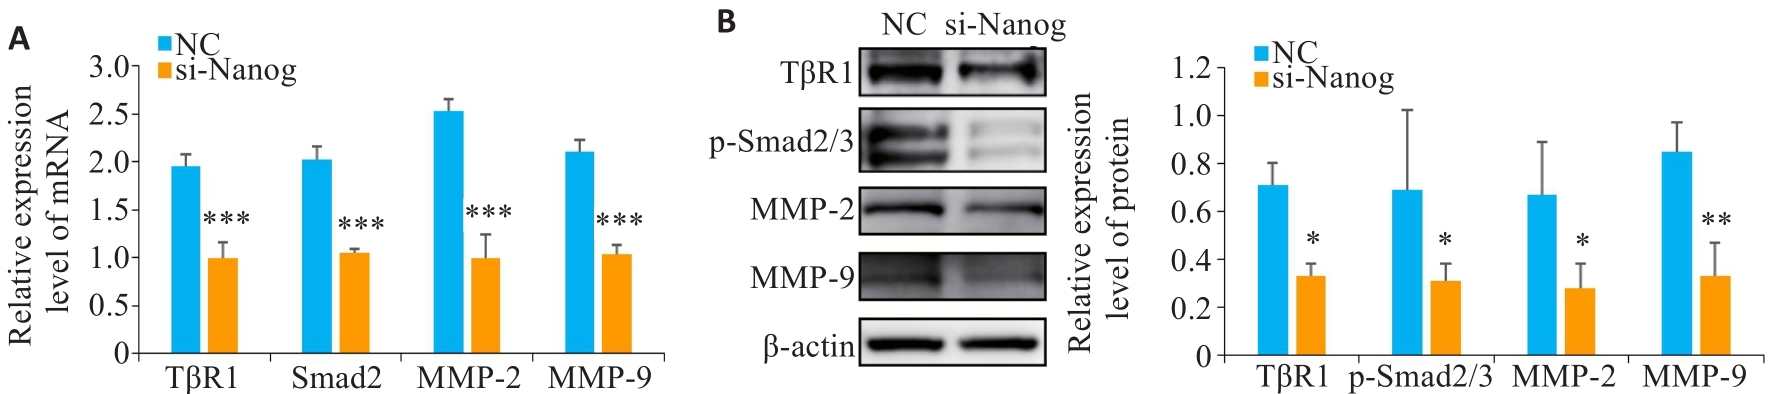
Fig.5 Expression of TGF-β signaling pathway and invasion- and migration-related molecules after Nanog knockdown. A: qRT-PCR of TβR1, Smad2, MMP-2, and MMP-9 mRNA levels after Nanog knockdown. B: Western blotting of TβR1, p-Smad2/3, MMP-2, and MMP-9 protein levels after Nanog knockdown. *P˂0.05, **P˂0.01, ***P<0.001 vs NC group.
| 1 | 郑荣寿, 陈 茹, 韩冰峰, 等. 2022年中国恶性肿瘤流行情况分析[J]. 中华肿瘤杂志, 2024, 46(3): 221-31. DOI: 10.3760/cma.j.cn112152-20240119-00035 |
| 2 | Zeng HM, Chen WQ, Zheng RS, et al. Changing cancer survival in China during 2003-15: a pooled analysis of 17 population-based cancer registries[J]. Lancet Glob Health, 2018, 6(5): e555-67. |
| 3 | Nafteux PR, Lerut AM, Moons J, et al. International multicenter study on the impact of extracapsular lymph node involvement in primary surgery adenocarcinoma of the esophagus on overall survival and staging systems[J]. Ann Surg, 2015, 262(5): 809-15. |
| 4 | Zhu ZP, Xu JH, Li LL, et al. Effect of gastric cancer stem cell on gastric cancer invasion, migration and angiogenesis[J]. Int J Med Sci, 2020, 17(13): 2040-51. |
| 5 | Li D, Peng XQ, He GP, et al. Crosstalk between autophagy and CSCs: molecular mechanisms and translational implications[J]. Cell Death Dis, 2023, 14(7): 409-13. |
| 6 | Pádua D, Figueira P, Ribeiro I, et al. The relevance of transcription factors in gastric and colorectal cancer stem cells identification and eradication[J]. Front Cell Dev Biol, 2020, 8: 442-9. |
| 7 | Vasefifar P, Motafakkerazad R, Maleki LA, et al. Nanog, as a key cancer stem cell marker in tumor progression[J]. Gene, 2022, 827: 146448-57. |
| 8 | Deng L, Zhang XP, Xiang XC, et al. NANOG promotes cell proliferation, invasion, and stemness via IL-6/STAT3 signaling in esophageal squamous carcinoma[J]. Technol Cancer Res Treat, 2021, 20: 11038492-56. |
| 9 | Serej ZA, Ebrahimi A, Kazemi T, et al. NANOG gene suppression and replacement of let-7 modulate the stemness, invasion, and apoptosis in breast cancer[J]. Gene, 2021, 801: 145844-53. |
| 10 | Vasefifar P, Najafi S, Motafakkerazad R, et al. Targeting Nanog expression increased Cisplatin chemosensitivity and inhibited cell migration in Gastric cancer cells[J]. Exp Cell Res, 2023, 429(2): 113681-8. |
| 11 | Samantaray S, Sharma R, Chattopadhyaya TK, et al. Increased expression of MMP-2 and MMP-9 in esophageal squamous cell carcinoma[J]. J Cancer Res Clin Oncol, 2004, 130(1): 37-44. |
| 12 | Ma K, Zhang C, Li WY. Gamabufotalin suppressed osteosarcoma stem cells through the TGF‑β/periostin/PI3K/AKT pathway[J]. Chem Biol Interact, 2020, 331: 109275-83. |
| 13 | 杨 铭, 李 梅, 孙 畅, 等. TβR1和p-Smad2/3蛋白在哈萨克族食管鳞状细胞癌中的表达及临床意义[J]. 华中科技大学学报: 医学版, 2023, 52(2): 239-44. |
| 14 | Sung H, Ferlay J, Siegel RL, et al. Global cancer statistics 2020: GLOBOCAN estimates of incidence and mortality worldwide for 36 cancers in 185 countries[J]. CA Cancer J Clin, 2021, 71(3): 209-49. |
| 15 | Nimmakayala RK, Leon F, Rachagani S, et al. Metabolic programming of distinct cancer stem cells promotes metastasis of pancreatic ductal adenocarcinoma[J]. Oncogene, 2021, 40(1): 215-31. |
| 16 | Giri A, Kar S. Interlinked bi-stable switches govern the cell fate commitment of embryonic stem cells[J]. FEBS Lett, 2024, 598(8): 915-34. |
| 17 | Rodrigues MFSD, Xavier FCA, Andrade NP, et al. Prognostic implications of CD44, NANOG, OCT4, and BMI1 expression in tongue squamous cell carcinoma[J]. Head Neck, 2018, 40(8): 1759-73. |
| 18 | Abdelbary AM, Atwa HA, Elfarargy OM, et al. Prognostic implications of CD24, SOX2, and nanog expression in invasive urothelial carcinoma[J]. Appl Immunohistochem Mol Morphol, 2023, 31(6): 421-8. |
| 19 | 李秀娟, 赵轶峰, 李明霞, 等. 食管鳞癌组织Nanog表达临床意义分析[J]. 中华肿瘤防治杂志, 2014, 21(24): 1962-5. |
| 20 | Stillebroer AB, Mulders PF, Boerman OC, et al. Carbonic anhydrase IX in renal cell carcinoma: implications for prognosis, diagnosis, and therapy[J]. Eur Urol, 2010, 58(1): 75-83. |
| 21 | Kashyap T, Nath N, Mishra P, et al. Pluripotency transcription factor Nanog and its association with overall oral squamous cell carcinoma progression, cisplatin-resistance, invasion and stemness acquisition[J]. Head Neck, 2020, 42(11): 3282-94. |
| 22 | Alaseem A, Alhazzani K, Dondapati P, et al. Matrix Metallo-proteinases: a challenging paradigm of cancer management[J]. Semin Cancer Biol, 2019, 56: 100-15. |
| 23 | Knapinska AM, Fields GB. The expanding role of MT1-MMP in cancer progression[J]. Pharmaceuticals, 2019, 12(2): 77-85. |
| 24 | Gobin E, Bagwell K, Wagner J, et al. A pan-cancer perspective of matrix metalloproteases (MMP) gene expression profile and their diagnostic/prognostic potential[J]. BMC Cancer, 2019, 19(1): 581-7. |
| 25 | Liu CM, Sheng MX, Lin LH, et al. NANOG regulates the proliferation of PCSCs via the TGF‑β1/SMAD pathway[J]. Open Med, 2020, 15(1): 841-9. |
| 26 | Muscella A, Vetrugno C, Cossa LG, et al. TGF-β1 activates RSC96 Schwann cells migration and invasion through MMP-2 and MMP-9 activities[J]. J Neurochem, 2020, 153(4): 525-38. |
| Viewed | ||||||
|
Full text |
|
|||||
|
Abstract |
|
|||||