南方医科大学学报 ›› 2024, Vol. 44 ›› Issue (6): 1141-1148.doi: 10.12122/j.issn.1673-4254.2024.06.15
申采玉1( ), 王帅2, 周锐盈1, 汪雨贺3, 高琴4, 陈兴智4, 杨枢1()
收稿日期:2024-01-15
出版日期:2024-06-20
发布日期:2024-07-01
通讯作者:
杨枢
E-mail:1224911076@qq.com;yangshu@bbmc.edu.cn
作者简介:申采玉,在读硕士研究生,E-mail: 1224911076@qq.com
基金资助:
Caiyu SHEN1(), Shuai WANG2, Ruiying ZHOU1, Yuhe WANG3, Qin GAO4, Xingzhi CHEN4, Shu YANG1()
Received:2024-01-15
Online:2024-06-20
Published:2024-07-01
Contact:
Shu YANG
E-mail:1224911076@qq.com;yangshu@bbmc.edu.cn
Supported by:摘要:
目的 使用可解释性机器学习方法预测慢性心力衰竭(CHF)合并肺部感染患者的院内死亡风险。 方法 回顾性分析MIMIC-IV数据库中诊断为CHF合并肺部感染的1415例患者病历信息。按病原体种类将患者划分为合并细菌性肺炎(841例)、合并非细菌性肺炎(574例)两个亚组,采用Kaplan-Meier生存曲线描述不同亚组的死亡风险差异。基于单因素分析和LASSO回归筛选特征。分别构建LR、AdaBoost、XGBoost、LightGBM模型,通过准确性、精确度、F1值、AUC等指标比较模型性能,使用eICU-CRD数据库进行外部验证。应用SHAP算法对XGBoost模型进行解释性分析。 结果 内部测试集中XGBoost模型预测CHF合并肺部感染患者院内死亡风险的准确性高于其他模型。外部测试集显示,合并细菌性肺炎、合并非细菌性肺炎两亚组中XGBoost模型的AUC值分别为0.691(95%CI:0.654~0.720)、0.725(95%CI:0.577~0.782)。相较于其他模型,XGBoost模型表现出了更好的预测能力和稳定性。 结论 在预测CHF合并肺部感染患者的院内死亡风险方面,XGBoost模型的综合表现优于其他3种模型。SHAP算法为模型提供了明确解释,有助于临床医生进行决策。
申采玉, 王帅, 周锐盈, 汪雨贺, 高琴, 陈兴智, 杨枢. 慢性心力衰竭合并肺部感染患者院内死亡风险预测:基于可解释性机器学习方法[J]. 南方医科大学学报, 2024, 44(6): 1141-1148.
Caiyu SHEN, Shuai WANG, Ruiying ZHOU, Yuhe WANG, Qin GAO, Xingzhi CHEN, Shu YANG. Prediction of risk of in-hospital death in patients with chronic heart failure complicated by lung infections using interpretable machine learning[J]. Journal of Southern Medical University, 2024, 44(6): 1141-1148.
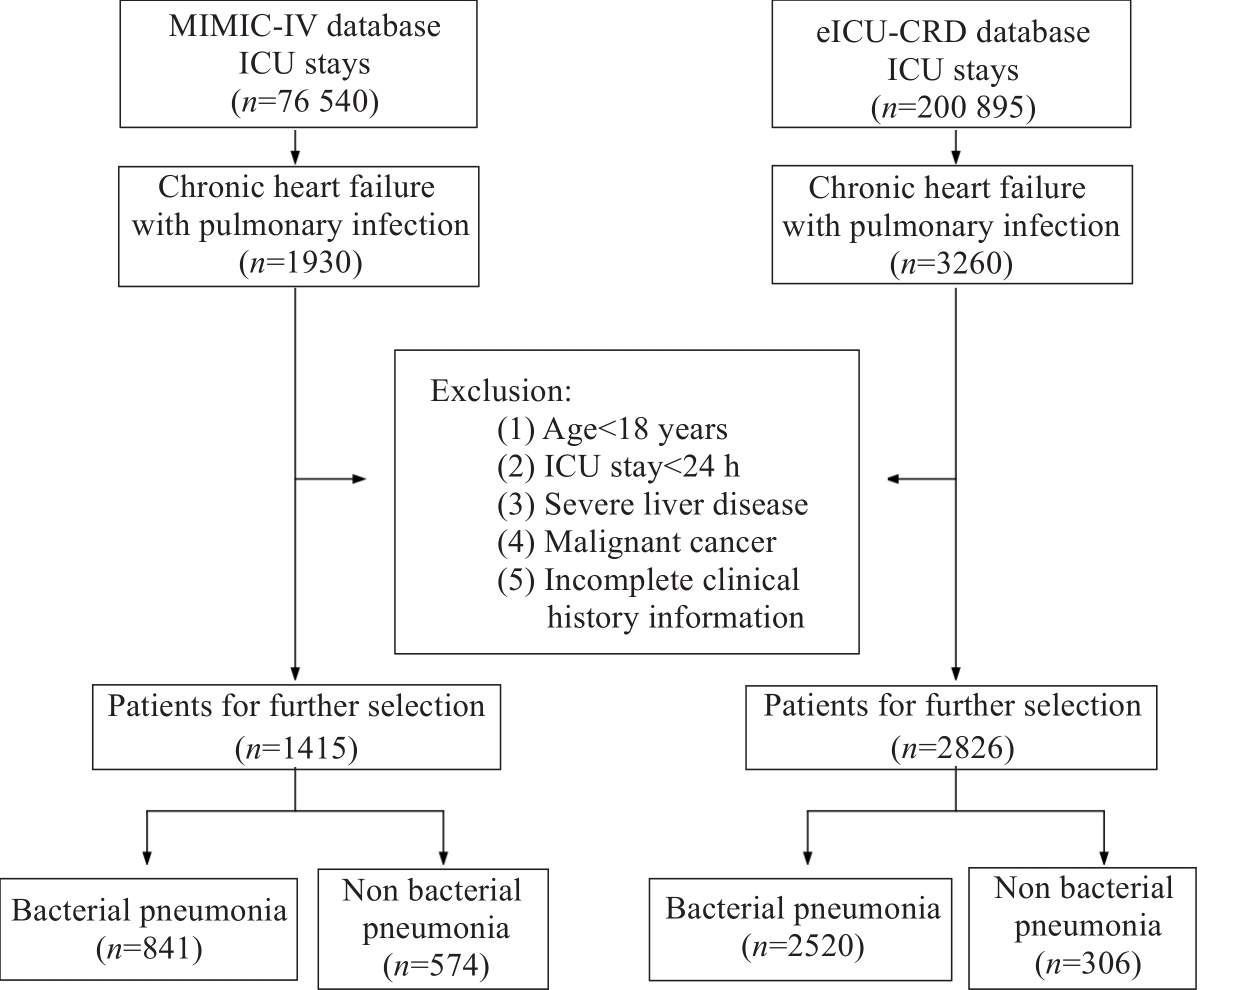
图1 患者筛选流程图
Fig.1 Flowchart of patient screening from two databases.
| Troponin T (ng/mL) | 0.7 (0.08, 0.53) | 0.64 (0.08, 0.52) | 0.88 (0.07, 0.62) | 0.834 |
| NT-proBNP (pg/mL) | 13207 (6192, 18491) | 12 852 (5555, 17906) | 14703 (8280, 20015) | <0.001 |
| PaO2 (mmHg) | 108 (71.0, 123.0) | 110 (71.2, 126.0) | 100 (69.0, 116.0) | 0.386 |
| PaCO2 (mmHg) | 43.6 (38.0, 47.0) | 43.6 (38.7, 47.0) | 43.4 (36.0, 48.0) | 0.069 |
| Lactate min (mmol/L) | 1.6 (1.0, 1.8) | 1.5 (1.0, 1.8) | 1.9 (1.1, 2.1) | <0.001 |
| Lactate max (mmol/L) | 2.8 (1.5, 3.3) | 2.6 (1.4, 3.0) | 3.4 (1.6, 4.1) | <0.001 |
| Bicarbonate min (mEq/L) | 25.9 (19.0, 26.0) | 23.0 (19.0, 26.0) | 21.3 (18.3, 25.0) | <0.001 |
| Bicarbonate max (mEq/L) | 25.7 (22.0, 29.0) | 26.1 (22.0, 29.0) | 25.0 (21.0, 28.0) | <0.001 |
| Urine output (mL) | 1759 (905, 2295) | 1848 (994, 2395) | 1382 (584, 1885) | <0.001 |
| Cerebrovascular disease [n(%)] | 221 (15.6) | 157 (13.7) | 64 (23.6) | <0.001 |
| Mild liver disease [n(%)] | 136 (9.6) | 97 (8.4) | 39 (14.4) | 0.003 |
| Myocardial infarct [n(%)] | 423 (29.9) | 338 (29.5) | 85 (31.4) | 0.556 |
| Peripheral vascular disease [n(%)] | 258 (18.2) | 210 (18.4) | 48 (17.7) | 0.805 |
| Dementia [n(%)] | 73 (5.2) | 58 (5.1) | 15 (5.5) | 0.756 |
| Chronic Pulmonary Disease [n(%)] | 608 (43.0) | 498 (43.5) | 110 (40.6) | 0.379 |
| Rheumatic disease [n(%)] | 69 (4.9) | 53 (4.6) | 16 (5.9) | 0.382 |
| Peptic ulcer disease [n(%)] | 38 (2.7) | 32 (2.8) | 6 (2.2) | 0.593 |
| Diabetes without cc [n(%)] | 448 (31.7) | 366 (32.0) | 82 (30.3) | 0.581 |
| Diabetes with cc [n(%)] | 276 (19.5) | 229 (20.0) | 47 (17.3) | 0.318 |
| Paraplegia [n(%)] | 66 (4.7) | 46 (4.0) | 20 (7.4) | 0.018 |
| Renal disease [n(%)] | 583 (41.2) | 456 (39.9) | 127 (46.9) | 0.035 |
| Metastatic solid tumor [n(%)] | 17 (1.2) | 9 (0.8) | 8 (0.3) | 0.003 |
| Aids [n(%)] | 12 (0.08) | 12 (0.1) | 0 | 0.090 |
| SOFA score | 6.9 (4.0, 9.0) | 6.3 (3.0, 9.0) | 9.2 (6.0, 12) | <0.001 |
| SAPSII score | 42.0 (32.0, 50.0) | 40.2 (31.0, 48.0) | 49.4 (40.0, 58.0) | <0.001 |
| GCS min score | 11.1 (8.0, 15.0) | 11.7 (9.0, 15.0) | 8.3 (3.0, 13.0) | <0.001 |
| Diuretic [n(%)] | 487 (34.4) | 388 (33.9) | 99 (36.5) | 0.415 |
| ACEI [n(%)] | 42 (0.03) | 32 (0.03) | 10 (0.036) | 0.436 |
表1 患者基线特征
Tab.1 Baseline patient characteristics [M (Q1, Q3)]
| Troponin T (ng/mL) | 0.7 (0.08, 0.53) | 0.64 (0.08, 0.52) | 0.88 (0.07, 0.62) | 0.834 |
| NT-proBNP (pg/mL) | 13207 (6192, 18491) | 12 852 (5555, 17906) | 14703 (8280, 20015) | <0.001 |
| PaO2 (mmHg) | 108 (71.0, 123.0) | 110 (71.2, 126.0) | 100 (69.0, 116.0) | 0.386 |
| PaCO2 (mmHg) | 43.6 (38.0, 47.0) | 43.6 (38.7, 47.0) | 43.4 (36.0, 48.0) | 0.069 |
| Lactate min (mmol/L) | 1.6 (1.0, 1.8) | 1.5 (1.0, 1.8) | 1.9 (1.1, 2.1) | <0.001 |
| Lactate max (mmol/L) | 2.8 (1.5, 3.3) | 2.6 (1.4, 3.0) | 3.4 (1.6, 4.1) | <0.001 |
| Bicarbonate min (mEq/L) | 25.9 (19.0, 26.0) | 23.0 (19.0, 26.0) | 21.3 (18.3, 25.0) | <0.001 |
| Bicarbonate max (mEq/L) | 25.7 (22.0, 29.0) | 26.1 (22.0, 29.0) | 25.0 (21.0, 28.0) | <0.001 |
| Urine output (mL) | 1759 (905, 2295) | 1848 (994, 2395) | 1382 (584, 1885) | <0.001 |
| Cerebrovascular disease [n(%)] | 221 (15.6) | 157 (13.7) | 64 (23.6) | <0.001 |
| Mild liver disease [n(%)] | 136 (9.6) | 97 (8.4) | 39 (14.4) | 0.003 |
| Myocardial infarct [n(%)] | 423 (29.9) | 338 (29.5) | 85 (31.4) | 0.556 |
| Peripheral vascular disease [n(%)] | 258 (18.2) | 210 (18.4) | 48 (17.7) | 0.805 |
| Dementia [n(%)] | 73 (5.2) | 58 (5.1) | 15 (5.5) | 0.756 |
| Chronic Pulmonary Disease [n(%)] | 608 (43.0) | 498 (43.5) | 110 (40.6) | 0.379 |
| Rheumatic disease [n(%)] | 69 (4.9) | 53 (4.6) | 16 (5.9) | 0.382 |
| Peptic ulcer disease [n(%)] | 38 (2.7) | 32 (2.8) | 6 (2.2) | 0.593 |
| Diabetes without cc [n(%)] | 448 (31.7) | 366 (32.0) | 82 (30.3) | 0.581 |
| Diabetes with cc [n(%)] | 276 (19.5) | 229 (20.0) | 47 (17.3) | 0.318 |
| Paraplegia [n(%)] | 66 (4.7) | 46 (4.0) | 20 (7.4) | 0.018 |
| Renal disease [n(%)] | 583 (41.2) | 456 (39.9) | 127 (46.9) | 0.035 |
| Metastatic solid tumor [n(%)] | 17 (1.2) | 9 (0.8) | 8 (0.3) | 0.003 |
| Aids [n(%)] | 12 (0.08) | 12 (0.1) | 0 | 0.090 |
| SOFA score | 6.9 (4.0, 9.0) | 6.3 (3.0, 9.0) | 9.2 (6.0, 12) | <0.001 |
| SAPSII score | 42.0 (32.0, 50.0) | 40.2 (31.0, 48.0) | 49.4 (40.0, 58.0) | <0.001 |
| GCS min score | 11.1 (8.0, 15.0) | 11.7 (9.0, 15.0) | 8.3 (3.0, 13.0) | <0.001 |
| Diuretic [n(%)] | 487 (34.4) | 388 (33.9) | 99 (36.5) | 0.415 |
| ACEI [n(%)] | 42 (0.03) | 32 (0.03) | 10 (0.036) | 0.436 |
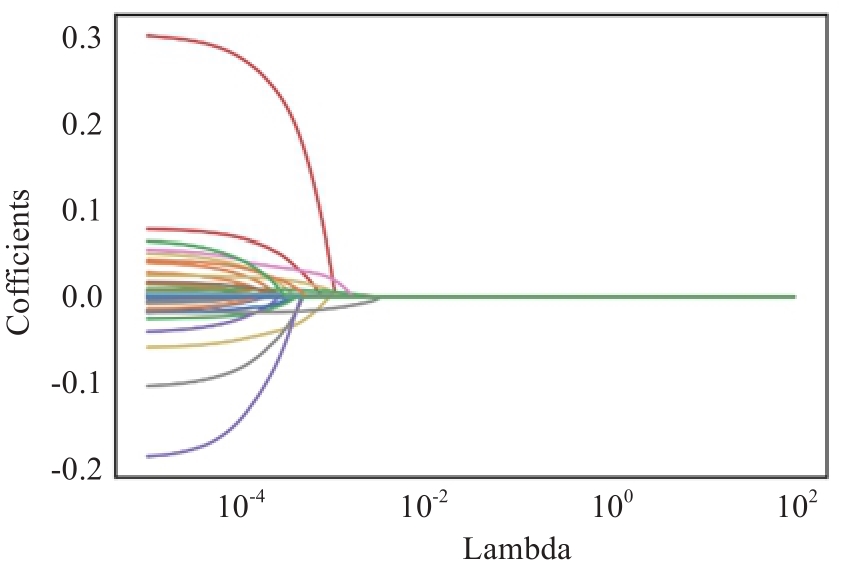
图2 Lambda与回归系数的关系
Fig.2 Lambda versus regression coefficients.
| Trait | Coefficient |
|---|---|
| Age | 0.000264 |
| Heart rate | 0.001311 |
| Systolic blood pressure | -0.000002 |
| Resp rate | 0.000995 |
| Temperature | -0.032731 |
| Peripheral vascular disease | -0.004364 |
| Cerebrovascular disease | 0.034564 |
| Peptic ulcer disease | -0.027540 |
| Mild liver disease | 0.001324 |
| Diabetes with cc | -0.000665 |
| Metastatic solid tumor | 0.202496 |
| Aids | -0.020164 |
| SOFA | 0.004093 |
| SAPS II | 0.000876 |
| GCS min | -0.017186 |
| Weight | -0.000768 |
| White blood cell | 0.008654 |
| Platelet | -0.000094 |
| Blood urea nitrogen | 0.001737 |
| PaO2 | 0.000110 |
| PaCO2 | -0.000313 |
| Lactate min | 0.033445 |
| Urine output | -0.000008 |
| Diuretic | 0.011216 |
表2 特征系数表
Tab.2 Characterization coefficients of the selected features
| Trait | Coefficient |
|---|---|
| Age | 0.000264 |
| Heart rate | 0.001311 |
| Systolic blood pressure | -0.000002 |
| Resp rate | 0.000995 |
| Temperature | -0.032731 |
| Peripheral vascular disease | -0.004364 |
| Cerebrovascular disease | 0.034564 |
| Peptic ulcer disease | -0.027540 |
| Mild liver disease | 0.001324 |
| Diabetes with cc | -0.000665 |
| Metastatic solid tumor | 0.202496 |
| Aids | -0.020164 |
| SOFA | 0.004093 |
| SAPS II | 0.000876 |
| GCS min | -0.017186 |
| Weight | -0.000768 |
| White blood cell | 0.008654 |
| Platelet | -0.000094 |
| Blood urea nitrogen | 0.001737 |
| PaO2 | 0.000110 |
| PaCO2 | -0.000313 |
| Lactate min | 0.033445 |
| Urine output | -0.000008 |
| Diuretic | 0.011216 |
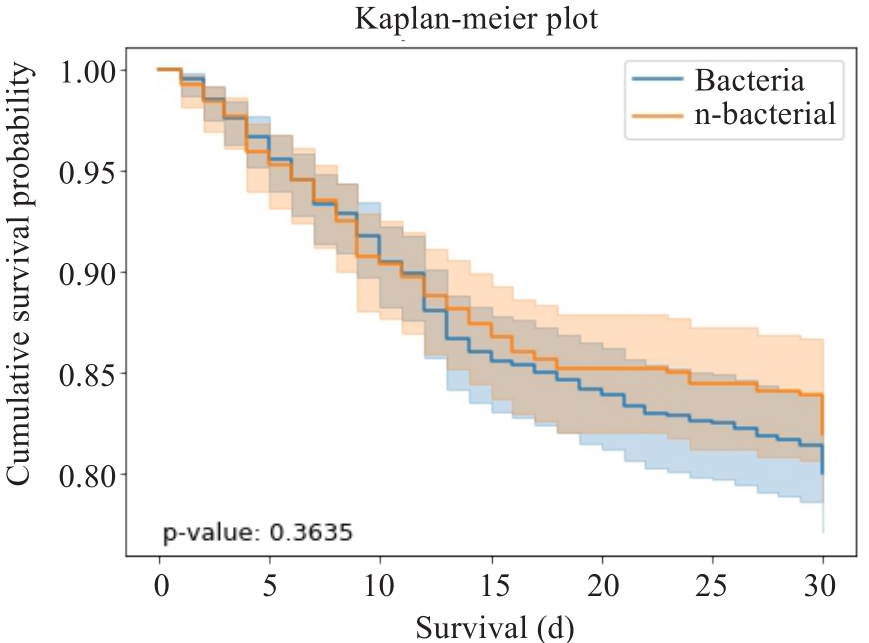
图3 两亚组生存曲线
Fig.3 Survival curves of the patients with bacterial and non-bacterial pneumonia.
| Mode | Accuracy | Precision | F1-score | AUC | AUC (95 %CI) |
|---|---|---|---|---|---|
| LR1 | 0.816 | 0.832 | 0.893 | 0.773 | (0.788, 0.839) |
| AdaBoost1 | 0.841 | 0.861 | 0.906 | 0.767 | (0.688, 0.803) |
| XGBoost1 | 0.845 | 0.855 | 0.909 | 0.829 | (0.785, 0.866) |
| LightGBM1 | 0.837 | 0.854 | 0.904 | 0.836 | (0.697, 0.869) |
| LR2 | 0.805 | 0.808 | 0.891 | 0.757 | (0.686, 0.786) |
| AdaBoost2 | 0.751 | 0.836 | 0.848 | 0.763 | (0.605, 0.779) |
| XGBoost2 | 0.811 | 0.842 | 0.889 | 0.810 | (0.709, 0.829) |
| LightGBM2 | 0.805 | 0.832 | 0.887 | 0.818 | (0.740, 0.846) |
| LR3 | 0.791 | 0.807 | 0.880 | 0.826 | (0.790, 0.841) |
| AdaBoost3 | 0.809 | 0.829 | 0.888 | 0.787 | (0.724, 0.848) |
| XGBoost3 | 0.835 | 0.840 | 0.904 | 0.846 | (0.788, 0.862) |
| LightGBM3 | 0.826 | 0.832 | 0.899 | 0.830 | (0.742, 0.860) |
表3 三种数据集模型性能对比表
Tab.3 Comparison of the performance of the 4 models using the 3 dataset
| Mode | Accuracy | Precision | F1-score | AUC | AUC (95 %CI) |
|---|---|---|---|---|---|
| LR1 | 0.816 | 0.832 | 0.893 | 0.773 | (0.788, 0.839) |
| AdaBoost1 | 0.841 | 0.861 | 0.906 | 0.767 | (0.688, 0.803) |
| XGBoost1 | 0.845 | 0.855 | 0.909 | 0.829 | (0.785, 0.866) |
| LightGBM1 | 0.837 | 0.854 | 0.904 | 0.836 | (0.697, 0.869) |
| LR2 | 0.805 | 0.808 | 0.891 | 0.757 | (0.686, 0.786) |
| AdaBoost2 | 0.751 | 0.836 | 0.848 | 0.763 | (0.605, 0.779) |
| XGBoost2 | 0.811 | 0.842 | 0.889 | 0.810 | (0.709, 0.829) |
| LightGBM2 | 0.805 | 0.832 | 0.887 | 0.818 | (0.740, 0.846) |
| LR3 | 0.791 | 0.807 | 0.880 | 0.826 | (0.790, 0.841) |
| AdaBoost3 | 0.809 | 0.829 | 0.888 | 0.787 | (0.724, 0.848) |
| XGBoost3 | 0.835 | 0.840 | 0.904 | 0.846 | (0.788, 0.862) |
| LightGBM3 | 0.826 | 0.832 | 0.899 | 0.830 | (0.742, 0.860) |
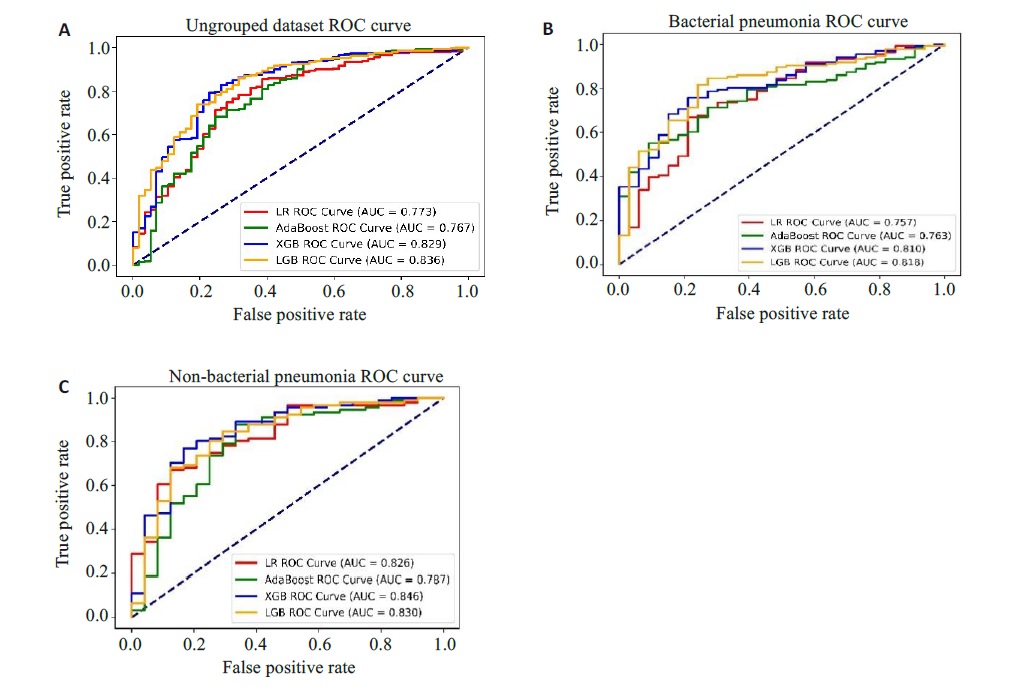
图4 三种数据集的ROC曲线
Fig.4 ROC curves of the patients before and after grouping. A: Ungrouped dataset ROC. B: ROC for bacterial pneumonia dataset. C: ROC for non-bacterial pneumonia dataset.
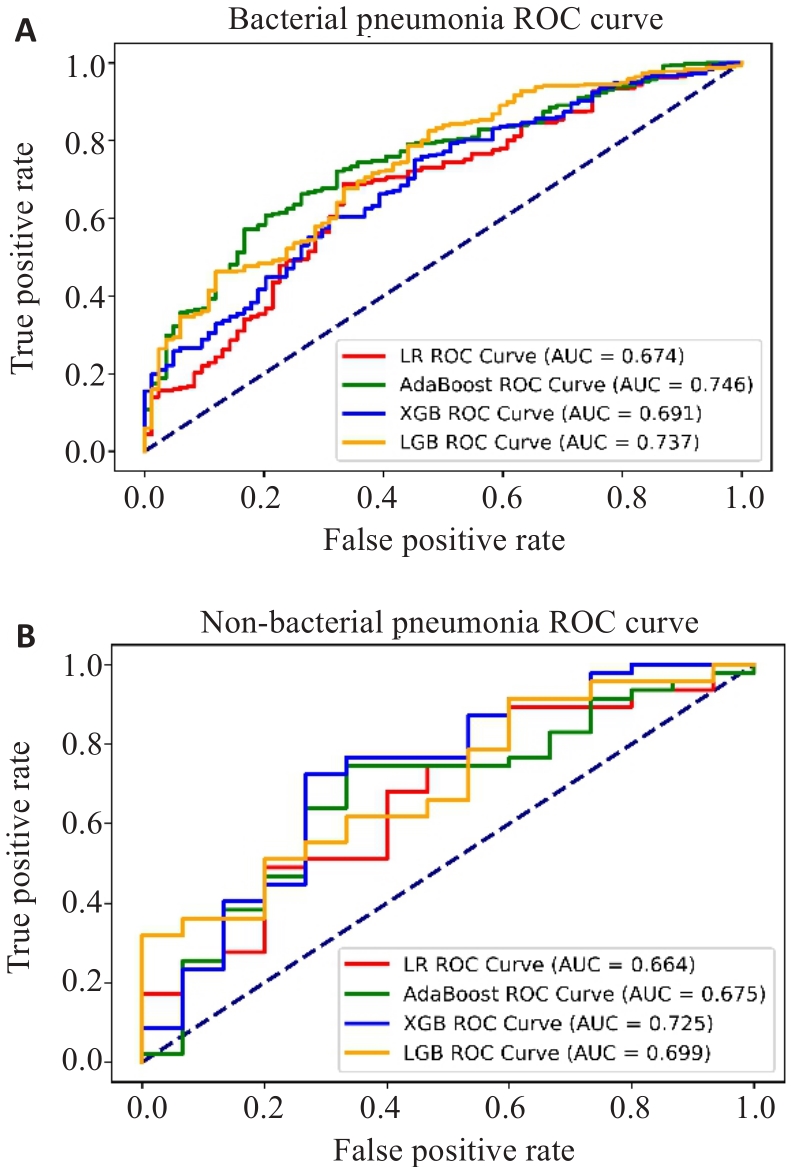
图5 eICU-CRD两亚组ROC曲线
Fig.5 ROC curves of the patients with bacterial pneumonia (A) and non-bacterial pneumonia (B) from eICU-CRD.
| Mode | Accuracy | Precision | F1-score | AUC | AUC (95% CI) |
|---|---|---|---|---|---|
| LR1 | 0.833 | 0.840 | 0.908 | 0.674 | (0.652, 0.697) |
| AdaBoost1 | 0.815 | 0.856 | 0.894 | 0.746 | (0.639, 0.788) |
| XGBoost1 | 0.827 | 0.851 | 0.903 | 0.691 | (0.654, 0.720) |
| LightGBM 1 | 0.829 | 0.845 | 0.904 | 0.737 | (0.647, 0.770) |
| LR2 | 0.742 | 0.772 | 0.846 | 0.664 | (0.567, 0.753) |
| AdaBoost2 | 0.710 | 0.784 | 0.816 | 0.675 | (0.549, 0.780) |
| XGBoost2 | 0.774 | 0.800 | 0.863 | 0.725 | (0.577, 0.782) |
| LightGBM 2 | 0.772 | 0.801 | 0.862 | 0.699 | (0.569, 0.786) |
表4 eICU-CRD两亚组模型性能对比表
Tab.4 Comparison of model performance for patients with bacterial pneumonia and non-bacterial pneumonia from eICU-CRD
| Mode | Accuracy | Precision | F1-score | AUC | AUC (95% CI) |
|---|---|---|---|---|---|
| LR1 | 0.833 | 0.840 | 0.908 | 0.674 | (0.652, 0.697) |
| AdaBoost1 | 0.815 | 0.856 | 0.894 | 0.746 | (0.639, 0.788) |
| XGBoost1 | 0.827 | 0.851 | 0.903 | 0.691 | (0.654, 0.720) |
| LightGBM 1 | 0.829 | 0.845 | 0.904 | 0.737 | (0.647, 0.770) |
| LR2 | 0.742 | 0.772 | 0.846 | 0.664 | (0.567, 0.753) |
| AdaBoost2 | 0.710 | 0.784 | 0.816 | 0.675 | (0.549, 0.780) |
| XGBoost2 | 0.774 | 0.800 | 0.863 | 0.725 | (0.577, 0.782) |
| LightGBM 2 | 0.772 | 0.801 | 0.862 | 0.699 | (0.569, 0.786) |
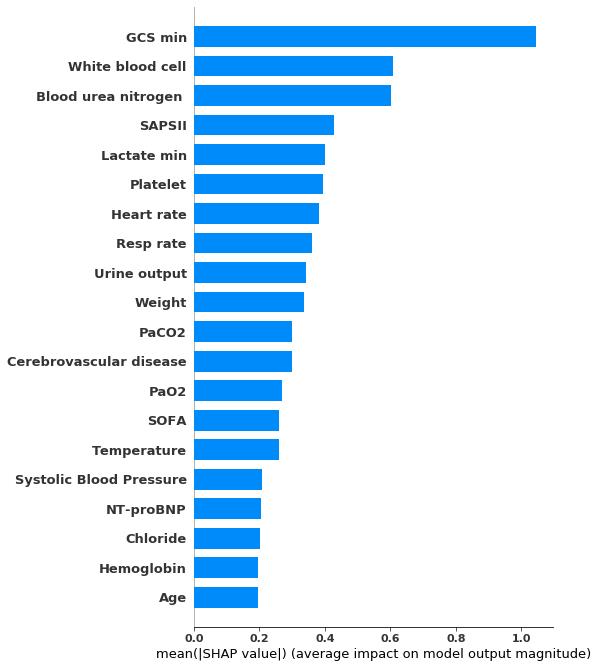
图6 SHAP特征重要性排序
Fig.6 Importance ranking of SHAP features.
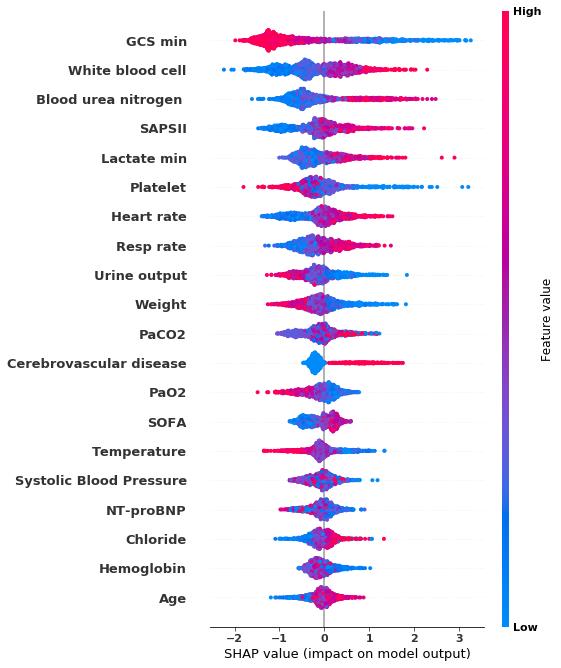
图7 特征对模型输出影响分布
Fig.7 Distribution of feature effects on model output.
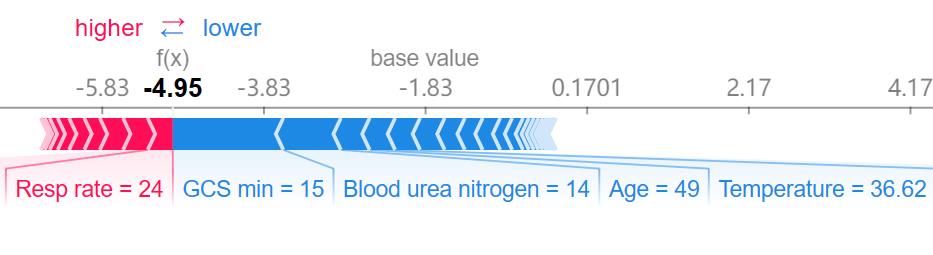
图8 CHF合并肺部感染存活患者特征贡献
Fig.8 Contribution of characteristics of surviving CHF patients with lung infections.
| 1 | 肖小菊, 黎励文. 《心力衰竭的通用定义和分类》解读[J]. 中国胸心血管外科临床杂志, 2021, 28(10): 1140-4. DOI: 10.7507/1007-4848.202106044 |
| 2 | 马丽媛, 王增武, 樊 静, 等. 《中国心血管健康与疾病报告2022》要点解读[J]. 中国全科医学, 2023, 26(32): 3975-94. DOI: 10.12114/j.issn.1007-9572.2023.0408 |
| 3 | Shen L, Jhund PS, Anand IS, et al. Incidence and outcomes of pneumonia in patients with heart failure[J]. J Am Coll Cardiol, 2021, 77(16): 1961-73. |
| 4 | Bo XW, Zhang YH, Liu Y, et al. Performance of the heart failure risk scores in predicting 1year mortality and short-term readmission of patients[J]. ESC Heart Fail, 2023, 10(1): 502-17. |
| 5 | Wang B, Li YX, Tian Y, et al. Novel pneumonia score based on a machine learning model for predicting mortality in pneumonia patients on admission to the intensive care unit[J]. Respir Med, 2023, 217: 107363. |
| 6 | Theunissen M, Browning J. Putting explainable AI in context: institutional explanations for medical AI[J]. Ethics Inf Technol, 2022, 24(2): 23-9. |
| 7 | Saqr M. Is GDPR failing? a tale of the many challenges in interpretations, applications, and enforcement[J]. Int J Health Sci, 2022, 16(5): 1-2. |
| 8 | 陈珂锐, 孟小峰. 机器学习的可解释性[J]. 计算机研究与发展, 2020, 57(9): 1971-86. DOI: 10.7544/issn1000-1239.2020.20190456 |
| 9 | Rogers P, Wang D, Lu ZY. Medical information mart for intensive care: a foundation for the fusion of artificial intelligence and real-world data[J]. Front Artif Intell, 2021, 4: 691626-35. |
| 10 | Pollard TJ, Johnson AEW, Raffa JD, et al. The eICU Collaborative Research Database, a freely available multi-center database for critical care research[J]. Sci Data, 2018, 5: 180178-83. |
| 11 | Chen YN, Chen H, Lu XD, et al. Automatic ICD-10 coding: deep semantic matching based on analogical reasoning[J]. Heliyon, 2023, 9(4): e15570-6. |
| 12 | 于翠香, 王西艳. 《中国成人医院获得性肺炎与呼吸机相关性肺炎诊断和治疗指南(2018年版)》解读[J]. 中国医刊, 2021, 56(9): 951-3. DOI: 10.3969/j.issn.1008-1070.2021.09.008 |
| 13 | 卓于迪, 朱陵群, 张立山, 等. 套索回归模型在中医临床研究数据的统计应用与R语言实践[J]. 世界中医药, 2023, 18(7): 1033-8. DOI: 10.3969/j.issn.1673-7202.2023.07.023 |
| 14 | 杨 柳, 王 钰. 泛化误差的各种交叉验证估计方法综述[J]. 计算机应用研究, 2015, 32(5): 1287-90, 1297. DOI: 10.3969/j.issn.1001-3695.2015.05.002 |
| 15 | Lynam AL, Dennis JM, Owen KR, et al. Logistic regression has similar performance to optimised machine learning algorithms in a clinical setting: application to the discrimination between type 1 and type 2 diabetes in young adults[J]. Diagn Progn Res, 2020, 4: 6-12. |
| 16 | Amendolara A, Pfister D, Settelmayer M, et al. An overview of machine learning applications in sports injury prediction[J]. Cureus, 2023, 15(9): e46170-8. |
| 17 | Chen RC, Caraka RE, Arnita NE, et al. An end to end of scalable tree boosting system[J]. Sylwan, 2020, 165(1): 1-11. |
| 18 | Li XQ, Xiong XY, Liang ZA, et al. A machine learning diagnostic model for Pneumocystis jirovecii pneumonia in patients with severe pneumonia[J]. Intern Emerg Med, 2023, 18(6): 1741-9. |
| 19 | Xu CG, Li HX, Yang JP, et al. Interpretable prediction of 3-year all-cause mortality in patients with chronic heart failure based on machine learning[J]. BMC Med Inform Decis Mak, 2023, 23(1): 267-79. |
| 20 | Petch J, Di S, Nelson W. Opening the black box: the promise and limitations of explainable machine learning in cardiology[J]. Can J Cardiol, 2022, 38(2): 204-13. |
| 21 | Cho YR, Kang M. Interpretable machine learning in bioinformatics[J]. Methods, 2020, 179: 1-2. |
| 22 | Ma MW, Liu RY, Wen CJ, et al. Predicting the molecular subtype of breast cancer and identifying interpretable imaging features using machine learning algorithms[J]. Eur Radiol, 2022, 32(3): 1652-62. |
| 23 | 鲍利改, 董 谦. 慢性心力衰竭合并肺部感染患者MIP-2、MMP-9、D-D、miR-21表达及与病原菌类型、心肌功能的关联性研究[J]. 临床误诊误治, 2022, 35(3): 78-83. DOI: 10.3969/j.issn.1002-3429.2022.03.018 |
| 24 | Mancini D, Gibson GT. Impact of pneumonia in HeartFailurePatients[J]. J Am Coll Cardiol, 2021, 77(16): 1974-6. |
| 25 | Chen ZJ, Li TM, Guo S, et al. Machine learning-based in-hospital mortality risk prediction tool for intensive care unit patients with heart failure[J]. Front Cardiovasc Med, 2023, 10: 1119699. |
| 26 | Chiotos K, Tamma PD, Gerber JS. Antibiotic stewardship in the intensive care unit: challenges and opportunities[J]. Infect Control Hosp Epidemiol, 2019, 40(6): 693-8. |
| 27 | Bifarin OO. Interpretable machine learning with tree-based shapley additive explanations: application to metabolomics datasets for binary classification[J]. PLoS One, 2023, 18(5): e0284315. |
| 28 | Chen JM, Li Y, Liu P, et al. A nomogram to predict the in-hospital mortality of patients with congestive heart failure and chronic kidney disease[J]. ESC Heart Fail, 2022, 9(5): 3167-76. |
| 29 | Aryee EK, Ozkan B, Ndumele CE. Heart failure and obesity: the latest pandemic[J]. Prog Cardiovasc Dis, 2023, 78: 43-8. |
| 30 | 孟广蕊, 纪志芳, 田 勇. 老年心力衰竭合并肺部感染病原菌分布及血清CRP、PCT水平变化[J]. 中国病原生物学杂志, 2023, 18(7): 821-4, 829. |
| [1] | 陈梅妹, 王洋, 雷黄伟, 张斐, 黄睿娜, 杨朝阳. 基于多种机器学习算法和语音情绪特征的阈下抑郁辨识模型构建[J]. 南方医科大学学报, 2025, 45(4): 711-717. |
| [2] | 申琳, 宋翠豪, 王聪敏, 高西, 安俊红, 李承新, 梁斌, 李霞. 溃疡性结肠炎并发坏疽性脓皮病患者发生营养风险的因素及预测模型[J]. 南方医科大学学报, 2025, 45(3): 514-521. |
| [3] | 陈志亮, 杨永刚, 黄霞, 成彦, 瞿媛, 衡琪琪, 符羽佳, 李可薇, 顾宁. 外泌体miRNA差异表达可作为诊断慢性心力衰竭合并高尿酸血症患者新型分子标志物及靶基因功能分析[J]. 南方医科大学学报, 2025, 45(1): 43-51. |
| [4] | 潘甚豪, 李炎坤, 伍哲维, 毛玉玲, 王春艳. 子宫内膜异位症患者新鲜胚胎移植临床妊娠率预测模型的建立与验证[J]. 南方医科大学学报, 2024, 44(7): 1407-1415. |
| [5] | 陈莉莉, 吴天宇, 张铭, 丁子夏, 张妍, 杨依清, 郑佳倩, 张小楠. 类风湿关节炎的潜在生物标志物及其免疫调控机制:基于GEO数据库[J]. 南方医科大学学报, 2024, 44(6): 1098-1108. |
| [6] | 左志威, 孟庆良, 崔家康, 郭克磊, 卞华. 基于硬皮病线粒体相关基因的人工神经网络模型的构建[J]. 南方医科大学学报, 2024, 44(5): 920-929. |
| [7] | 戈 悦, 李建伟, 梁宏开, 侯六生, 左六二, 陈 珍, 卢剑海, 赵 新, 梁静漪, 彭 岚, 包静娜, 段佳欣, 刘 俐, 毛可晴, 曾振华, 胡鸿彬, 陈仲清. VA-ECMO患者院内死亡风险预测模型的构建及验证:一项多中心、回顾性、病例对照研究[J]. 南方医科大学学报, 2024, 44(3): 491-498. |
| [8] | 金佳欣, 马鹏珍, 王尔玉, 谢颖桢. 急性缺血性卒中患者复发的独立影响因素及风险预测列线图模型构建:基于Lasso回归[J]. 南方医科大学学报, 2024, 44(12): 2375-2381. |
| [9] | 黄晓茵, 陈凤莲, 张煜, 梁淑君. 多参数多区域MRI影像组学特征与临床信息联合模型可有效预测脑胶质瘤患者生存期[J]. 南方医科大学学报, 2024, 44(10): 2004-2014. |
| [10] | 何慧珊, 郭二嘉, 蒙文仪, 王 彧, 王 雯, 何文乐, 吴元魁, 阳 维. 基于磁共振图像机器学习放射组学模型预测脑胶质瘤的强化[J]. 南方医科大学学报, 2024, 44(1): 194-200. |
| [11] | 罗 枭, 程 义, 吴 骋, 贺 佳. 预测重症缺血性脑卒中死亡风险的模型:基于内在可解释性机器学习方法[J]. 南方医科大学学报, 2023, 43(7): 1241-1247. |
| [12] | 高凯绩, 王一豪, 曹海坤, 贾建光. 机器学习模型和Cox回归模型预测食管胃结合部腺癌预后的效能[J]. 南方医科大学学报, 2023, 43(6): 952-963. |
| [13] | 张浩轩, 陆 进, 蒋成义, 方美芳. 基于人工智能技术的鼻咽癌风险预测模型的构建与评价[J]. 南方医科大学学报, 2023, 43(2): 271-279. |
| [14] | 孟令飞, 朱学研, 杨立明, 李忻阳, 程思宇, 郭师正, 庄小花, 邹洪斌, 崔文鹏. 腹膜透析相关腹膜炎患者治疗失败预测模型的构建和验证:一项多中心临床研究[J]. 南方医科大学学报, 2022, 42(4): 546-553. |
| [15] | 邓 亚, 王春艳, 付懿铭, 李忠斌, 纪 冬. 慢性药物性肝损伤的复发风险与肝纤维化程度高度相关[J]. 南方医科大学学报, 2022, 42(11): 1655-1661. |
| 阅读次数 | ||||||
|
全文 |
|
|||||
|
摘要 |
|
|||||