南方医科大学学报 ›› 2024, Vol. 44 ›› Issue (7): 1361-1370.doi: 10.12122/j.issn.1673-4254.2024.07.16
李和平( ), 李高桦, 张学华, 王亚楠()
收稿日期:2024-03-28
出版日期:2024-07-20
发布日期:2024-07-25
通讯作者:
王亚楠
E-mail:peace_li1985@163.com;wyn8116@163.com
作者简介:李和平,在读硕士研究生,主治医师,E-mail: peace_li1985@163.com
基金资助:
Heping LI(), Gaohua LI, Xuehua ZHANG, Yanan WANG()
Received:2024-03-28
Online:2024-07-20
Published:2024-07-25
Contact:
Yanan WANG
E-mail:peace_li1985@163.com;wyn8116@163.com
摘要:
目的 利用孟德尔随机化(MR)方法,探索炎症蛋白因子与直肠癌风险之间的因果关系,为直肠癌的预防和治疗提供新的策略。 方法 从全基因组关联分析(GWAS)数据集中选取与直肠癌相关的信息,使用91个炎症蛋白因子作为暴露变量。采用双样本MR分析模型评估炎症蛋白因子与直肠癌的因果联系,并通过异质性、多效性和敏感性分析评估结果的稳健性。使用5种MR分析模型,包括逆方差加权法(IVW)、加权中位数法(Weighted median)、模型选择法(MR-Egger)、简单模型法和加权模型法。选择2021年12月~2023年12月南方医科大学南方医院收治的86 例未经治疗的直肠腺癌患者开展临床研究,使用RT-qPCR技术定量分析程序性死亡配体1(PD-L1)、轴突诱导蛋白1(AXIN1)和β-神经生长因子(β-NGF)基因表达,使用Spearman秩相关系数分析基因表达与临床特征(包括吸烟情况、肿瘤最大直径、是否有转移、肿瘤-淋巴结-转移分期、分化程度和病理分型)之间的相关性。 结果 MR分析显示AXIN1(OR=0.866,95% CI:0.754-0.994,P=0.040;IVW模型)、β-NGF(OR=0.914,95% CI:0.843-0.990,P=0.028;IVW模型)(OR=0.884,95% CI:0.784-0.998,P=0.047,Weighted median模型)和PD-L1(OR=0.903,95% CI:0.824-0.989,P=0.028,IVW模型)风险降低有与直肠癌显著的因果关系。研究中不存在异质性(IVW法和MR Egger法检测的P>0.05),不存在多效性(P>0.05),模型稳定。敏感性分析显示,AXIN1、β-NGF和PD-L1的剩余单核苷酸多态性(SNP)效应值的均值分别为-0.1425、-0.0973和-0.1011,均与各自的主效应值-0.144、-0.1和-0.1接近,验证了结果的可靠性。临床研究显示,PD-L1基因的表达量与直肠癌的TNM分期显著相关,尤其是在TNM分期IV期患者中,PD-L1的表达量显著高于I、II、III期(P=0.007)。AXIN1和β-NGF基因的表达量与肿瘤的分化程度显著相关;低分化的直肠癌样本中,AXIN1和β-NGF的表达量显著高于中分化和高分化样本(P<0.001)。 结论 炎症蛋白因子AXIN1、β-NGF和PD-L1的水平降低与直肠癌风险降低有显著的因果关系,且这些因子的表达量与直肠癌的TNM分期和肿瘤分化程度相关,可能是直肠癌治疗和预防的新靶点。
李和平, 李高桦, 张学华, 王亚楠. 直肠癌炎症蛋白因子的遗传驱动:孟德尔随机化方法在临床预后研究中的应用[J]. 南方医科大学学报, 2024, 44(7): 1361-1370.
Heping LI, Gaohua LI, Xuehua ZHANG, Yanan WANG. Genetic drivers for inflammatory protein markers in colorectal cancer: a Mendelian randomization approach to clinical prognosis study[J]. Journal of Southern Medical University, 2024, 44(7): 1361-1370.
| Gene | Forward primer (5'-3') | Reverse primer (5'-3') |
|---|---|---|
| PD-L1 | 5'-TGGCATTTGCTGAACGCAT-3' | 5'-TGCTTGTCCAGATGACTTCG-3' |
| AXIN1 | 5'-AGCCTGCTGTACTGCTGCTA-3' | 5'-TGCAGAGTGAGCGTGTACTC-3' |
| β-NGF | 5'-GCTACATCGAGGAGGCTGTT-3' | 5'-CACAGTGTCCTCAGGTTTGG-3' |
| GAPDH | 5'-ACCACAGTCCATGCCATCAC-3' | 5'-TCCACCACCCTGTTGCTGTA-3' |
表1 PD-L1、AXIN1和β-NGF基因的特异性引物序列设计(GAPDH为内参基因)
Tab.1 Primer sequences for RT-qPCR of PD-L1, AXIN1, and β-NGF genes (with GAPDH as the internal control)
| Gene | Forward primer (5'-3') | Reverse primer (5'-3') |
|---|---|---|
| PD-L1 | 5'-TGGCATTTGCTGAACGCAT-3' | 5'-TGCTTGTCCAGATGACTTCG-3' |
| AXIN1 | 5'-AGCCTGCTGTACTGCTGCTA-3' | 5'-TGCAGAGTGAGCGTGTACTC-3' |
| β-NGF | 5'-GCTACATCGAGGAGGCTGTT-3' | 5'-CACAGTGTCCTCAGGTTTGG-3' |
| GAPDH | 5'-ACCACAGTCCATGCCATCAC-3' | 5'-TCCACCACCCTGTTGCTGTA-3' |
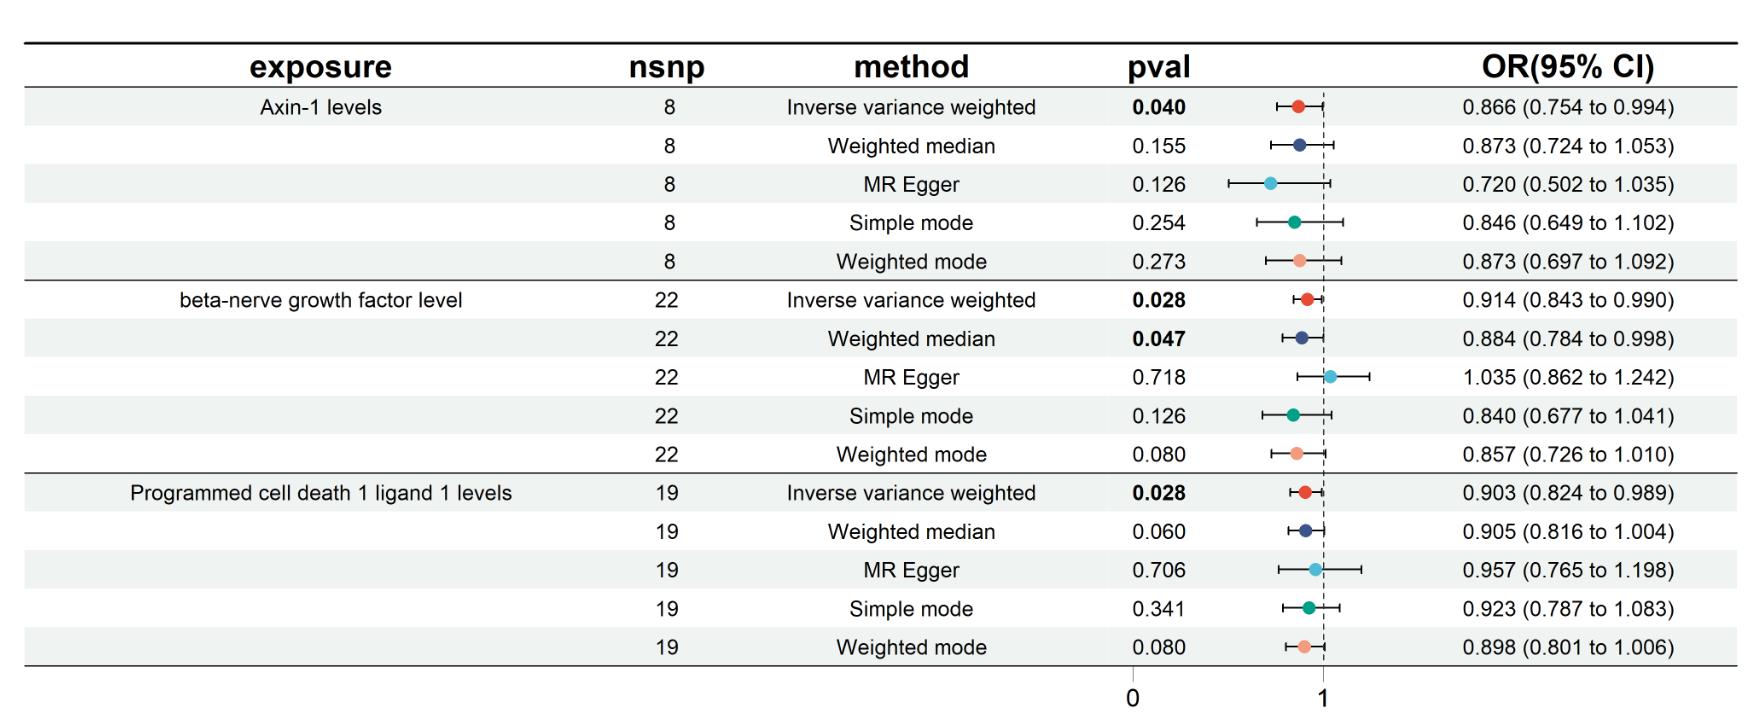
图1 森林图(采用5 种MR分析模型可视化炎症蛋白因子对直肠癌风险的因果效应)
Fig.1 Forest plot visualizing the causal effects of inflammatory protein markers on colorectal cancer risk using 5 Mendelian randomization (MR) analysis models.
| 3 inflammatory protein factors | MR model | P | OR | 95% CI |
|---|---|---|---|---|
| AXIN1 | Inverse variance weighted | 0.040 | 0.866 | 0.754-0.994 |
| Weighted median | 0.155 | 0.873 | 0.724-1.053 | |
| MR Egger | 0.126 | 0.720 | 0.502-1.035 | |
| Simple mode | 0.254 | 0.846 | 0.649-1.102 | |
| Weighted mode | 0.273 | 0.873 | 0.697-1.092 | |
| β-NGF | Inverse variance weighted | 0.028 | 0.914 | 0.843-0.990 |
| Weighted median | 0.047 | 0.884 | 0.784-0.998 | |
| MR Egger | 0.718 | 1.035 | 0.862-1.242 | |
| Simple mode | 0.126 | 0.840 | 0.677-1.041 | |
| Weighted mode | 0.080 | 0.857 | 0.726-1.010 | |
| PD-L1 | Inverse variance weighted | 0.028 | 0.903 | 0.824-0.989 |
| Weighted median | 0.060 | 0.905 | 0.816-1.004 | |
| MR Egger | 0.706 | 0.957 | 0.765-1.198 | |
| Simple mode | 0.341 | 0.923 | 0.787-1.083 | |
| Weighted mode | 0.080 | 0.898 | 0.801-1.006 |
表2 双样本MR显示了3 个炎症蛋白因子对直肠癌的影响
Tab.2 Two-sample MR analysis demonstrating the impact of 3 inflammatory protein markers on colorectal cancer
| 3 inflammatory protein factors | MR model | P | OR | 95% CI |
|---|---|---|---|---|
| AXIN1 | Inverse variance weighted | 0.040 | 0.866 | 0.754-0.994 |
| Weighted median | 0.155 | 0.873 | 0.724-1.053 | |
| MR Egger | 0.126 | 0.720 | 0.502-1.035 | |
| Simple mode | 0.254 | 0.846 | 0.649-1.102 | |
| Weighted mode | 0.273 | 0.873 | 0.697-1.092 | |
| β-NGF | Inverse variance weighted | 0.028 | 0.914 | 0.843-0.990 |
| Weighted median | 0.047 | 0.884 | 0.784-0.998 | |
| MR Egger | 0.718 | 1.035 | 0.862-1.242 | |
| Simple mode | 0.126 | 0.840 | 0.677-1.041 | |
| Weighted mode | 0.080 | 0.857 | 0.726-1.010 | |
| PD-L1 | Inverse variance weighted | 0.028 | 0.903 | 0.824-0.989 |
| Weighted median | 0.060 | 0.905 | 0.816-1.004 | |
| MR Egger | 0.706 | 0.957 | 0.765-1.198 | |
| Simple mode | 0.341 | 0.923 | 0.787-1.083 | |
| Weighted mode | 0.080 | 0.898 | 0.801-1.006 |
| 88 inflammatory protein factors | P | OR | 95% CI |
|---|---|---|---|
| Level of eukaryotic translation initiation factor 4e-binding protein 1 in blood plasma | 0.330693955 | 1.05701024 | 0.945~1.182 |
| Adenosine deaminase measurement | 0.400744522 | 0.971110383 | 0.907~1.040 |
| Artemin measurement | 0.577886958 | 1.028293723 | 0.932~1.134 |
| Caspase-8 measurement | 0.893225803 | 1.01109646 | 0.861~1.188 |
| Eotaxin measurement | 0.418629293 | 1.049686291 | 0.933~1.181 |
| C-c motif chemokine 19 measurement | 0.138858991 | 0.953521049 | 0.895~1.016 |
| C-c motif chemokine 20 measurement | 0.58707287 | 1.027424201 | 0.932~1.133 |
| C-c motif chemokine 23 measurement | 0.193446913 | 1.0380569 | 0.981~1.098 |
| C-c motif chemokine 25 measurement | 0.276211279 | 1.024595882 | 0.981~1.070 |
| C-c motif chemokine 28 measurement | 0.155521941 | 1.077788608 | 0.972~1.195 |
| C-c motif chemokine 4-like measurement | 0.104239836 | 0.949281216 | 0.892~1.011 |
| Natural killer cell receptor 2b4 measurement | 0.883114482 | 1.006982684 | 0.918~1.105 |
| Cd40 measurement | 0.228753652 | 1.032385457 | 0.980~1.087 |
| T-cell surface glycoprotein cd5 measurement | 0.365387247 | 0.943265519 | 0.831~1.070 |
| Level of t-cell differentiation antigen cd6 in blood plasma | 0.100531596 | 0.951163531 | 0.896~1.010 |
| Cub domain-containing protein 1 measurement | 0.832570494 | 0.988924375 | 0.892~1.096 |
| Macrophage colony-stimulating factor 1 measurement | 0.506667178 | 0.959861227 | 0.851~1.083 |
| Cystatin-d measurement | 0.72428164 | 1.008161078 | 0.964~1.055 |
| Fractalkine measurement | 0.462560826 | 1.040793854 | 0.935~1.158 |
| Cxcl1 measurement | 0.894677494 | 1.00525697 | 0.930~1.086 |
| C-x-c motif chemokine 10 measurement | 0.771709442 | 0.982307712 | 0.871~1.108 |
| C-x-c motif chemokine 11 measurement | 0.575284323 | 1.033187503 | 0.922~1.158 |
| C-x-c motif chemokine 5 measurement | 0.799499229 | 0.988392831 | 0.903~1.082 |
| C-x-c motif chemokine 6 measurement | 0.911547109 | 0.989014351 | 0.814~1.202 |
| C-x-c motif chemokine 9 measurement | 0.228872998 | 0.930704757 | 0.828~1.046 |
| Delta and notch-like epidermal growth factor-related receptor measurement | 0.940378359 | 0.996546078 | 0.910~1.091 |
| Protein s100-a12 measurement | 0.408502837 | 1.040250552 | 0.947~1.142 |
| Fibroblast growth factor 19 measurement | 0.188440681 | 0.917624127 | 0.807~1.043 |
| Fibroblast growth factor 21 measurement | 0.090121312 | 0.912044138 | 0.820~1.015 |
| Fibroblast growth factor 23 measurement | 0.100383968 | 1.100299985 | 0.982~1.233 |
| Fibroblast growth factor 5 measurement | 0.996902105 | 1.00008661 | 0.957~1.045 |
| Fms-related tyrosine kinase 3 ligand measurement | 0.533761185 | 1.029291159 | 0.940~1.127 |
| Glial cell line-derived neurotrophic factor measurement | 0.407072647 | 1.044508504 | 0.942~1.158 |
| Hepatocyte growth factor measurement | 0.262585949 | 0.944119121 | 0.854~1.044 |
| Interferon gamma measurement | 0.237368214 | 1.110258305 | 0.933~1.321 |
| Interleukin-10 measurement | 0.116811526 | 0.911618611 | 0.812~1.023 |
| Interleukin-10 receptor subunit alpha measurement | 0.748459744 | 1.014930285 | 0.927~1.111 |
| Interleukin-10 receptor subunit beta measurement | 0.636886216 | 1.017501244 | 0.947~1.094 |
| Interleukin-12 subunit b measurement | 0.985645686 | 0.999389385 | 0.935~1.068 |
| Interleukin-13 measurement | 0.459701443 | 1.057809342 | 0.911~1.228 |
| Interleukin-15 receptor subunit alpha measurement | 0.640753925 | 1.021046126 | 0.936~1.114 |
| Interleukin-17a measurement | 0.849139422 | 0.989209252 | 0.885~1.106 |
| Interleukin-17c measurement | 0.881546189 | 0.991402959 | 0.885~1.111 |
| Interleukin 18 measurement | 0.558552042 | 0.97218849 | 0.885~1.069 |
| Interleukin-18 receptor 1 measurement | 0.090188729 | 0.95511571 | 0.906~1.007 |
| Interleukin-1 alpha measurement | 0.677978683 | 0.984846788 | 0.916~1.058 |
| Interleukin-2 measurement | 0.07740399 | 0.917987666 | 0.835~1.009 |
| Interleukin-20 measurement | 0.291150659 | 1.093808053 | 0.926~1.292 |
| Interleukin-20 receptor subunit alpha measurement | 0.597326832 | 1.034418796 | 0.912~1.173 |
| Interleukin-22 receptor subunit alpha-1 measurement | 0.286716746 | 0.953002592 | 0.872~1.041 |
| Interleukin-24 measurement | 0.521908621 | 0.938998028 | 0.774~1.138 |
| Interleukin-2 receptor subunit beta measurement | 0.905772546 | 1.010513096 | 0.850~1.202 |
| Level of interleukin-33 in blood plasma | 0.867584002 | 0.987423578 | 0.851~1.146 |
| Interleukin-4 measurement | 0.747455619 | 0.978873314 | 0.860~1.115 |
| Interleukin-5 measurement | 0.711859457 | 1.024422635 | 0.901~1.164 |
| Interleukin-6 measurement | 0.775696404 | 1.015280674 | 0.915~1.127 |
| Interleukin-7 measurement | 0.716962035 | 1.025544025 | 0.895~1.175 |
| Interleukin-8 measurement | 0.752783452 | 1.015097112 | 0.925~1.114 |
| Transforming growth factor beta-1 measurement | 0.274065715 | 1.058249902 | 0.956~1.171 |
| Leukemia inhibitory factor measurement | 0.206989335 | 1.076015903 | 0.960~1.206 |
| Leukemia inhibitory factor receptor measurement | 0.332957247 | 1.045419336 | 0.956~1.144 |
| Ccl2 measurement | 0.202036076 | 1.044503498 | 0.977~1.117 |
| Monocyte chemotactic protein-2 measurement | 0.265061104 | 1.021836151 | 0.984~1.061 |
| Monocyte chemotactic protein 3 measurement | 0.237594093 | 1.065347928 | 0.959~1.183 |
| Monocyte chemotactic protein-4 measurement | 0.503878948 | 1.019953512 | 0.963~1.081 |
| Macrophage inflammatory protein 1a measurement | 0.914789496 | 0.994719076 | 0.903~1.096 |
| Matrix metalloproteinase 1 measurement | 0.691649178 | 0.981202618 | 0.893~1.078 |
| Matrix metalloproteinase 10 measurement | 0.279953505 | 1.051622418 | 0.960~1.152 |
| Level of neurturin in blood plasma | 0.304288769 | 0.936474867 | 0.826~1.061 |
| Neurotrophin-3 measurement | 0.457455683 | 1.042340882 | 0.934~1.163 |
| Osteoprotegerin measurement | 0.077956745 | 1.07367806 | 0.992~1.162 |
| Oncostatin-m measurement | 0.382798408 | 0.940220439 | 0.819~1.080 |
| Stem cell factor measurement | 0.774417755 | 0.988552924 | 0.914~1.070 |
| Sir2-like protein 2 measurement | 0.628422372 | 0.96738532 | 0.846~1.106 |
| Signaling lymphocytic activation molecule measurement | 0.991033477 | 1.000583468 | 0.904~1.108 |
| Sulfotrasferase 1a1 measurement | 0.214016095 | 0.958306538 | 0.896~1.025 |
| Stam binding protein measurement | 0.746256217 | 1.020153145 | 0.904~1.151 |
| Transforming growth factor-alpha measurement | 0.605271992 | 0.95352472 | 0.796~1.142 |
| Tumor necrosis factor measurement | 0.179961864 | 1.078953805 | 0.966~1.206 |
| Lymphotoxin-alpha measurement | 0.244034995 | 1.026859418 | 0.982~1.074 |
| Tumor necrosis factor receptor superfamily member 9 measurement | 0.962790331 | 1.002600075 | 0.899~1.118 |
| Tumor necrosis factor ligand superfamily member 14 measurement | 0.850366904 | 0.994105748 | 0.935~1.057 |
| Tnf-related apoptosis-inducing ligand measurement | 0.148528335 | 0.931451642 | 0.846~1.026 |
| Tnf-related activation-induced cytokine measurement | 0.575971297 | 1.020575767 | 0.950~1.096 |
| Thymic stromal lymphopoietin measurement | 0.845461662 | 0.985914611 | 0.855~1.137 |
| Tumor necrosis factor ligand superfamily member 12 measurement | 0.597249576 | 1.019992959 | 0.948~1.098 |
| Urokinase-type plasminogen activator measurement | 0.559931482 | 0.974045442 | 0.892~1.064 |
| Vascular endothelial growth factor a measurement | 0.346474973 | 0.97745845 | 0.932~1.025 |
表3 双样本MR显示了88 个炎症蛋白因子对直肠癌的影响(仅展示Inverse variance weighted模型的结果) (3)
Tab.3 Two-Sample MR analysis demonstrating the impact of 88 inflammatory protein factors on colorectal cancer (only the results using the Inverse Variance Weighted Model are shown)
| 88 inflammatory protein factors | P | OR | 95% CI |
|---|---|---|---|
| Level of eukaryotic translation initiation factor 4e-binding protein 1 in blood plasma | 0.330693955 | 1.05701024 | 0.945~1.182 |
| Adenosine deaminase measurement | 0.400744522 | 0.971110383 | 0.907~1.040 |
| Artemin measurement | 0.577886958 | 1.028293723 | 0.932~1.134 |
| Caspase-8 measurement | 0.893225803 | 1.01109646 | 0.861~1.188 |
| Eotaxin measurement | 0.418629293 | 1.049686291 | 0.933~1.181 |
| C-c motif chemokine 19 measurement | 0.138858991 | 0.953521049 | 0.895~1.016 |
| C-c motif chemokine 20 measurement | 0.58707287 | 1.027424201 | 0.932~1.133 |
| C-c motif chemokine 23 measurement | 0.193446913 | 1.0380569 | 0.981~1.098 |
| C-c motif chemokine 25 measurement | 0.276211279 | 1.024595882 | 0.981~1.070 |
| C-c motif chemokine 28 measurement | 0.155521941 | 1.077788608 | 0.972~1.195 |
| C-c motif chemokine 4-like measurement | 0.104239836 | 0.949281216 | 0.892~1.011 |
| Natural killer cell receptor 2b4 measurement | 0.883114482 | 1.006982684 | 0.918~1.105 |
| Cd40 measurement | 0.228753652 | 1.032385457 | 0.980~1.087 |
| T-cell surface glycoprotein cd5 measurement | 0.365387247 | 0.943265519 | 0.831~1.070 |
| Level of t-cell differentiation antigen cd6 in blood plasma | 0.100531596 | 0.951163531 | 0.896~1.010 |
| Cub domain-containing protein 1 measurement | 0.832570494 | 0.988924375 | 0.892~1.096 |
| Macrophage colony-stimulating factor 1 measurement | 0.506667178 | 0.959861227 | 0.851~1.083 |
| Cystatin-d measurement | 0.72428164 | 1.008161078 | 0.964~1.055 |
| Fractalkine measurement | 0.462560826 | 1.040793854 | 0.935~1.158 |
| Cxcl1 measurement | 0.894677494 | 1.00525697 | 0.930~1.086 |
| C-x-c motif chemokine 10 measurement | 0.771709442 | 0.982307712 | 0.871~1.108 |
| C-x-c motif chemokine 11 measurement | 0.575284323 | 1.033187503 | 0.922~1.158 |
| C-x-c motif chemokine 5 measurement | 0.799499229 | 0.988392831 | 0.903~1.082 |
| C-x-c motif chemokine 6 measurement | 0.911547109 | 0.989014351 | 0.814~1.202 |
| C-x-c motif chemokine 9 measurement | 0.228872998 | 0.930704757 | 0.828~1.046 |
| Delta and notch-like epidermal growth factor-related receptor measurement | 0.940378359 | 0.996546078 | 0.910~1.091 |
| Protein s100-a12 measurement | 0.408502837 | 1.040250552 | 0.947~1.142 |
| Fibroblast growth factor 19 measurement | 0.188440681 | 0.917624127 | 0.807~1.043 |
| Fibroblast growth factor 21 measurement | 0.090121312 | 0.912044138 | 0.820~1.015 |
| Fibroblast growth factor 23 measurement | 0.100383968 | 1.100299985 | 0.982~1.233 |
| Fibroblast growth factor 5 measurement | 0.996902105 | 1.00008661 | 0.957~1.045 |
| Fms-related tyrosine kinase 3 ligand measurement | 0.533761185 | 1.029291159 | 0.940~1.127 |
| Glial cell line-derived neurotrophic factor measurement | 0.407072647 | 1.044508504 | 0.942~1.158 |
| Hepatocyte growth factor measurement | 0.262585949 | 0.944119121 | 0.854~1.044 |
| Interferon gamma measurement | 0.237368214 | 1.110258305 | 0.933~1.321 |
| Interleukin-10 measurement | 0.116811526 | 0.911618611 | 0.812~1.023 |
| Interleukin-10 receptor subunit alpha measurement | 0.748459744 | 1.014930285 | 0.927~1.111 |
| Interleukin-10 receptor subunit beta measurement | 0.636886216 | 1.017501244 | 0.947~1.094 |
| Interleukin-12 subunit b measurement | 0.985645686 | 0.999389385 | 0.935~1.068 |
| Interleukin-13 measurement | 0.459701443 | 1.057809342 | 0.911~1.228 |
| Interleukin-15 receptor subunit alpha measurement | 0.640753925 | 1.021046126 | 0.936~1.114 |
| Interleukin-17a measurement | 0.849139422 | 0.989209252 | 0.885~1.106 |
| Interleukin-17c measurement | 0.881546189 | 0.991402959 | 0.885~1.111 |
| Interleukin 18 measurement | 0.558552042 | 0.97218849 | 0.885~1.069 |
| Interleukin-18 receptor 1 measurement | 0.090188729 | 0.95511571 | 0.906~1.007 |
| Interleukin-1 alpha measurement | 0.677978683 | 0.984846788 | 0.916~1.058 |
| Interleukin-2 measurement | 0.07740399 | 0.917987666 | 0.835~1.009 |
| Interleukin-20 measurement | 0.291150659 | 1.093808053 | 0.926~1.292 |
| Interleukin-20 receptor subunit alpha measurement | 0.597326832 | 1.034418796 | 0.912~1.173 |
| Interleukin-22 receptor subunit alpha-1 measurement | 0.286716746 | 0.953002592 | 0.872~1.041 |
| Interleukin-24 measurement | 0.521908621 | 0.938998028 | 0.774~1.138 |
| Interleukin-2 receptor subunit beta measurement | 0.905772546 | 1.010513096 | 0.850~1.202 |
| Level of interleukin-33 in blood plasma | 0.867584002 | 0.987423578 | 0.851~1.146 |
| Interleukin-4 measurement | 0.747455619 | 0.978873314 | 0.860~1.115 |
| Interleukin-5 measurement | 0.711859457 | 1.024422635 | 0.901~1.164 |
| Interleukin-6 measurement | 0.775696404 | 1.015280674 | 0.915~1.127 |
| Interleukin-7 measurement | 0.716962035 | 1.025544025 | 0.895~1.175 |
| Interleukin-8 measurement | 0.752783452 | 1.015097112 | 0.925~1.114 |
| Transforming growth factor beta-1 measurement | 0.274065715 | 1.058249902 | 0.956~1.171 |
| Leukemia inhibitory factor measurement | 0.206989335 | 1.076015903 | 0.960~1.206 |
| Leukemia inhibitory factor receptor measurement | 0.332957247 | 1.045419336 | 0.956~1.144 |
| Ccl2 measurement | 0.202036076 | 1.044503498 | 0.977~1.117 |
| Monocyte chemotactic protein-2 measurement | 0.265061104 | 1.021836151 | 0.984~1.061 |
| Monocyte chemotactic protein 3 measurement | 0.237594093 | 1.065347928 | 0.959~1.183 |
| Monocyte chemotactic protein-4 measurement | 0.503878948 | 1.019953512 | 0.963~1.081 |
| Macrophage inflammatory protein 1a measurement | 0.914789496 | 0.994719076 | 0.903~1.096 |
| Matrix metalloproteinase 1 measurement | 0.691649178 | 0.981202618 | 0.893~1.078 |
| Matrix metalloproteinase 10 measurement | 0.279953505 | 1.051622418 | 0.960~1.152 |
| Level of neurturin in blood plasma | 0.304288769 | 0.936474867 | 0.826~1.061 |
| Neurotrophin-3 measurement | 0.457455683 | 1.042340882 | 0.934~1.163 |
| Osteoprotegerin measurement | 0.077956745 | 1.07367806 | 0.992~1.162 |
| Oncostatin-m measurement | 0.382798408 | 0.940220439 | 0.819~1.080 |
| Stem cell factor measurement | 0.774417755 | 0.988552924 | 0.914~1.070 |
| Sir2-like protein 2 measurement | 0.628422372 | 0.96738532 | 0.846~1.106 |
| Signaling lymphocytic activation molecule measurement | 0.991033477 | 1.000583468 | 0.904~1.108 |
| Sulfotrasferase 1a1 measurement | 0.214016095 | 0.958306538 | 0.896~1.025 |
| Stam binding protein measurement | 0.746256217 | 1.020153145 | 0.904~1.151 |
| Transforming growth factor-alpha measurement | 0.605271992 | 0.95352472 | 0.796~1.142 |
| Tumor necrosis factor measurement | 0.179961864 | 1.078953805 | 0.966~1.206 |
| Lymphotoxin-alpha measurement | 0.244034995 | 1.026859418 | 0.982~1.074 |
| Tumor necrosis factor receptor superfamily member 9 measurement | 0.962790331 | 1.002600075 | 0.899~1.118 |
| Tumor necrosis factor ligand superfamily member 14 measurement | 0.850366904 | 0.994105748 | 0.935~1.057 |
| Tnf-related apoptosis-inducing ligand measurement | 0.148528335 | 0.931451642 | 0.846~1.026 |
| Tnf-related activation-induced cytokine measurement | 0.575971297 | 1.020575767 | 0.950~1.096 |
| Thymic stromal lymphopoietin measurement | 0.845461662 | 0.985914611 | 0.855~1.137 |
| Tumor necrosis factor ligand superfamily member 12 measurement | 0.597249576 | 1.019992959 | 0.948~1.098 |
| Urokinase-type plasminogen activator measurement | 0.559931482 | 0.974045442 | 0.892~1.064 |
| Vascular endothelial growth factor a measurement | 0.346474973 | 0.97745845 | 0.932~1.025 |
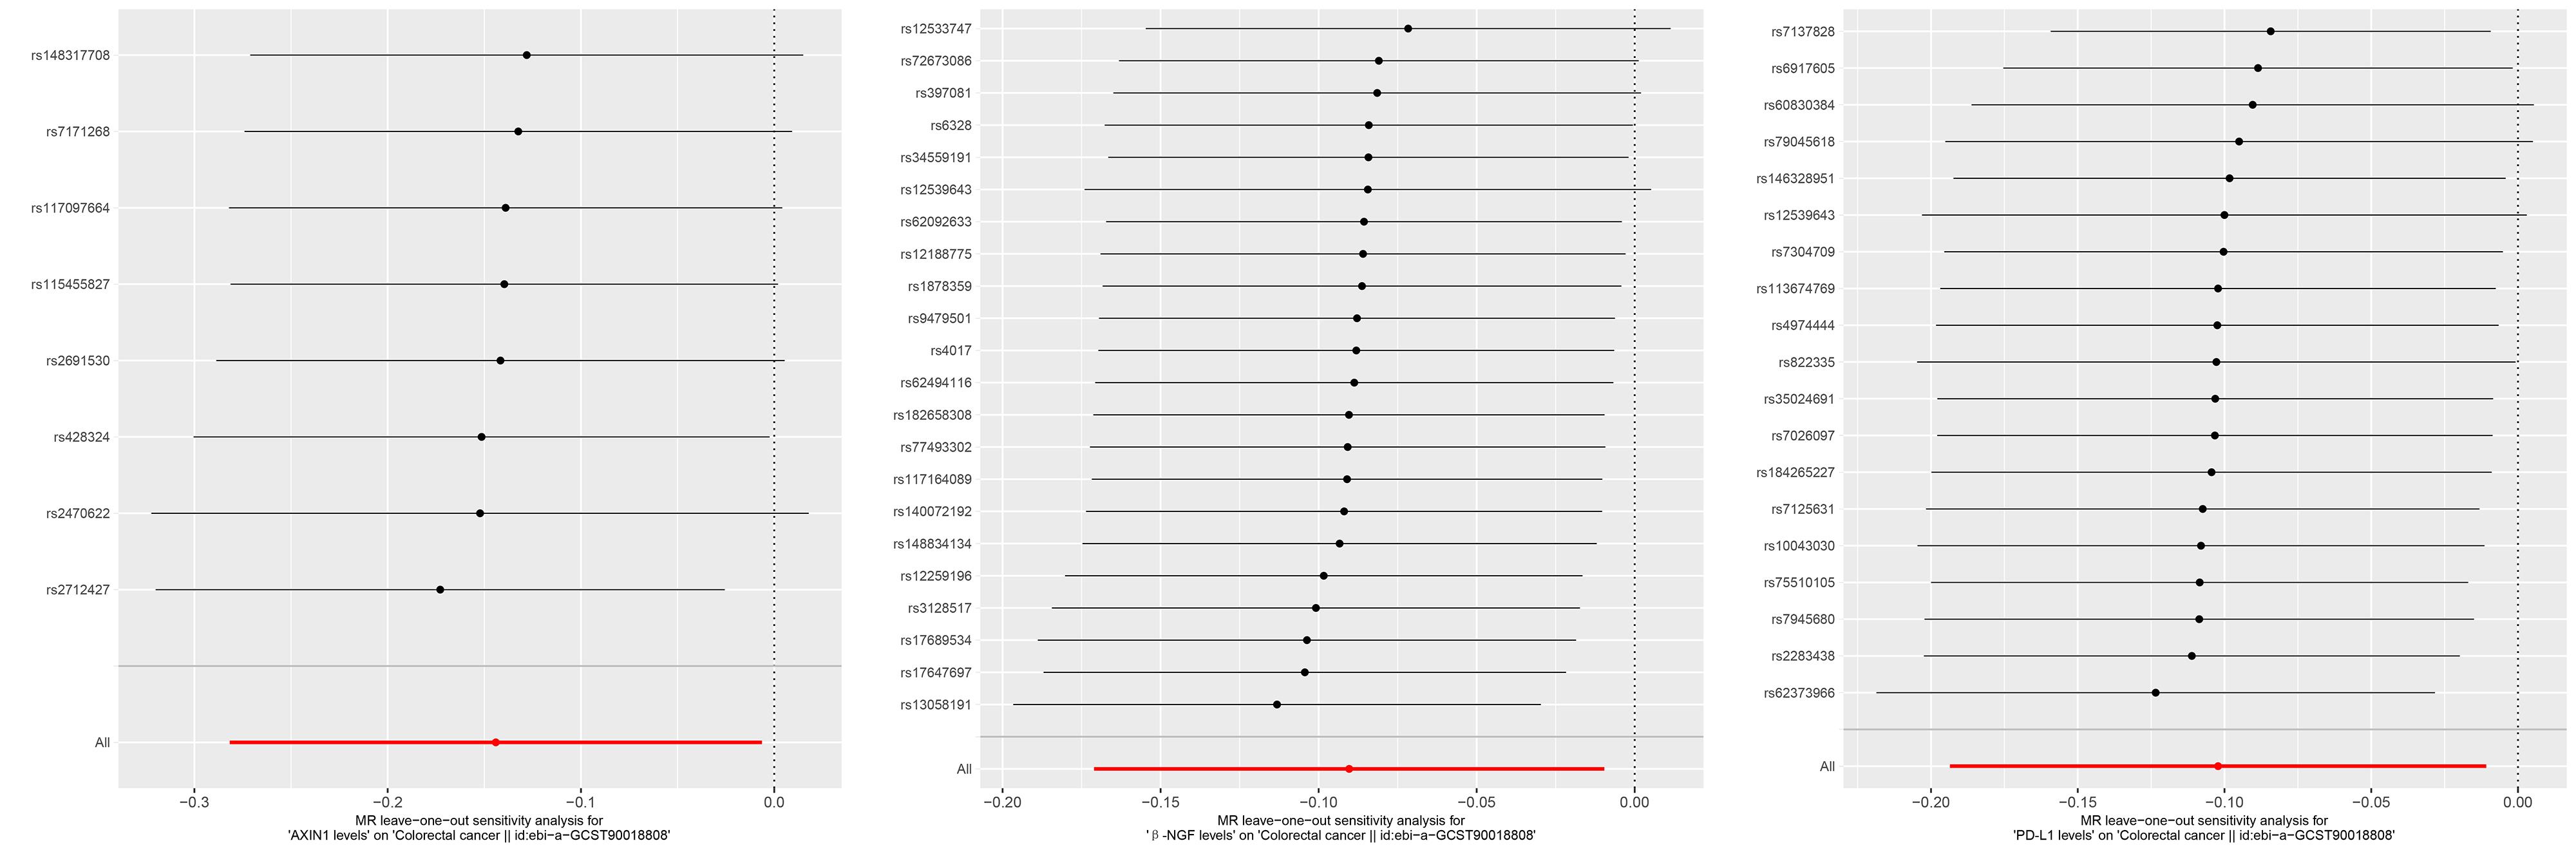
图2 与直肠癌存在显著因果关系的3 个炎症蛋白因子的"leave-one-out"敏感性分析图
Fig.2 "Leave-One-Out" sensitivity analysis graph for three inflammatory protein markers with a significant causal relationship to colorectal cancer.
| General data title | Value (Mean±SD) | Proportion n(%) |
|---|---|---|
| Age (year) | 54.36±16.57 | |
| Gender | ||
| Male | 62 (72.09%) | |
| Female | 24 (27.91%) | |
| Body weight (kg) | 56.761±15.209 | |
| Height (cm) | 161.734±12.281 | |
| BMI (kg/m2) | 21.576±2.187 | |
| Smoking status | ||
| Yes | 23 (26.74%) | |
| No | 63 (73.26%) | |
| Maximum diameter (mm) | 7.793±4.466 | |
| Large (≥7.92) | 11.38±3.78 | 44 (51.16%) |
| Small (<7.92) | 2.67±1.30 | 42 (48.84%) |
| TNM stage | ||
| I | 9 (10.47%) | |
| II | 14 (16.28%) | |
| III | 37 (43.02%) | |
| IV | 26 (30.23%) | |
| Degree of differentiation | ||
| Poorly differentiated | 22 (25.58%) | |
| Moderately differentiated | 33 (38.37%) | |
| Well differentiated | 31 (36.05%) | |
| Pathological type | ||
| Tubular adenocarcinoma | 55 (63.95%) | |
| Mucinous adenocarcinoma | 14 (16.28%) | |
| Signet ring cell carcinoma | 17 (19.77%) | |
| Metastasis status | ||
| Yes | 67 (77.91%) | |
| No | 19 (22.09%) | |
| AXIN1 | 0.528±0.308 | |
| High expression | 35 (40.70%) | |
| Low expression | 51 (59.30%) | |
| β-NGF | 2.948±1.626 | |
| High expression | 44 (51.16%) | |
| Low expression | 42 (48.84%) | |
| PD-L1 | 22.415±6.046 | |
| High expression | 42 (48.84%) | |
| Low expression | 44 (51.16%) |
表5 直肠癌患者的基线信息
Tab.5 Baseline demographic and clinical data the untreated patients with colorectal cancer
| General data title | Value (Mean±SD) | Proportion n(%) |
|---|---|---|
| Age (year) | 54.36±16.57 | |
| Gender | ||
| Male | 62 (72.09%) | |
| Female | 24 (27.91%) | |
| Body weight (kg) | 56.761±15.209 | |
| Height (cm) | 161.734±12.281 | |
| BMI (kg/m2) | 21.576±2.187 | |
| Smoking status | ||
| Yes | 23 (26.74%) | |
| No | 63 (73.26%) | |
| Maximum diameter (mm) | 7.793±4.466 | |
| Large (≥7.92) | 11.38±3.78 | 44 (51.16%) |
| Small (<7.92) | 2.67±1.30 | 42 (48.84%) |
| TNM stage | ||
| I | 9 (10.47%) | |
| II | 14 (16.28%) | |
| III | 37 (43.02%) | |
| IV | 26 (30.23%) | |
| Degree of differentiation | ||
| Poorly differentiated | 22 (25.58%) | |
| Moderately differentiated | 33 (38.37%) | |
| Well differentiated | 31 (36.05%) | |
| Pathological type | ||
| Tubular adenocarcinoma | 55 (63.95%) | |
| Mucinous adenocarcinoma | 14 (16.28%) | |
| Signet ring cell carcinoma | 17 (19.77%) | |
| Metastasis status | ||
| Yes | 67 (77.91%) | |
| No | 19 (22.09%) | |
| AXIN1 | 0.528±0.308 | |
| High expression | 35 (40.70%) | |
| Low expression | 51 (59.30%) | |
| β-NGF | 2.948±1.626 | |
| High expression | 44 (51.16%) | |
| Low expression | 42 (48.84%) | |
| PD-L1 | 22.415±6.046 | |
| High expression | 42 (48.84%) | |
| Low expression | 44 (51.16%) |
| Clinical features | Gene name | Smoker/Large/Metastasis Present | Non-smoker/Small/No Metastasis | t | P |
|---|---|---|---|---|---|
| Smoking status | AXIN1 | 0.477±0.326 | 0.561±0.302 | 0.267 | 0.267 |
| β-NGF | 2.883±1.559 | 2.972±1.668 | 0.055 | 0.824 | |
| PD-L1 | 22.064±5.622 | 22.544±6.255 | 0.081 | 0.747 | |
| Maximum diameter | AXIN1 | 0.565±0.302 | 0.511±0.318 | 0.174 | 0.423 |
| β-NGF | 2.983±1.612 | 2.912±1.669 | 0.044 | 0.84 | |
| PD-L1 | 21.501±5.786 | 23.373±6.267 | 0.31 | 0.153 | |
| Metastasis status | AXIN1 | 0.523±0.305 | 0.592±0.325 | 0.219 | 0.393 |
| β-NGF | 2.934±1.598 | 2.999±1.786 | 0.039 | 0.879 | |
| PD-L1 | 22.153±6.258 | 23.339±5.371 | 0.203 | 0.455 |
表6 AXIN1、β-NGF、PD-L1基因表达情况
Tab.6 Expression status of AXIN1, β-NGF and PD-L1 in patients in different subgroups (Mean±SD)
| Clinical features | Gene name | Smoker/Large/Metastasis Present | Non-smoker/Small/No Metastasis | t | P |
|---|---|---|---|---|---|
| Smoking status | AXIN1 | 0.477±0.326 | 0.561±0.302 | 0.267 | 0.267 |
| β-NGF | 2.883±1.559 | 2.972±1.668 | 0.055 | 0.824 | |
| PD-L1 | 22.064±5.622 | 22.544±6.255 | 0.081 | 0.747 | |
| Maximum diameter | AXIN1 | 0.565±0.302 | 0.511±0.318 | 0.174 | 0.423 |
| β-NGF | 2.983±1.612 | 2.912±1.669 | 0.044 | 0.84 | |
| PD-L1 | 21.501±5.786 | 23.373±6.267 | 0.31 | 0.153 | |
| Metastasis status | AXIN1 | 0.523±0.305 | 0.592±0.325 | 0.219 | 0.393 |
| β-NGF | 2.934±1.598 | 2.999±1.786 | 0.039 | 0.879 | |
| PD-L1 | 22.153±6.258 | 23.339±5.371 | 0.203 | 0.455 |
| Clinical features | Gene name | I/Poorly Differentiated/Tubular Adenocarcinoma | II/Moderately Differentiated/Mucinous Adenocarcinoma | III/Well Differentiated/Signet Ring Cell Carcinoma | IV | F | P |
|---|---|---|---|---|---|---|---|
| TNM stage | AXIN1 | 0.495±0.347 | 0.612±0.373 | 0.529±0.286 | 0.528±0.304 | 0.173 | 0.796 |
| β-NGF | 2.882±1.828 | 3.312±1.995 | 2.775±1.56 | 3.027±1.507 | 0.167 | 0.759 | |
| PD-L1 | 20.66±5.717 | 17.893±4.756 | 23.333±6.077 | 24.152±5.714 | 0.653 | 0.007 | |
| Degree of differentiation | AXIN1 | 0.792±0.264 | 0.439±0.226 | 0.331±0.231 | 1.253 | <0.001 | |
| β-NGF | 4.621±1.316 | 2.317±0.875 | 1.538±0.231 | 2.069 | <0.001 | ||
| PD-L1 | 22.566±5.901 | 22.346±5.964 | 22.306±6.695 | 0.028 | 0.985 | ||
| Pathological type | AXIN1 | 0.519±0.306 | 0.6±0.315 | 0.55±0.325 | 0.185 | 0.572 | |
| β-NGF | 2.895±1.593 | 3.216±1.728 | 2.902±1.75 | 0.17 | 0.681 | ||
| PD-L1 | 22.04±5.9 | 22.189±5.521 | 23.816±7.102 | 0.126 | 0.803 |
表7 AXIN1、β-NGF、PD-L1基因表达情况
Tab.7 Expression profiles of AXIN1, β-NGF and PD-L1 mRNA in patients with different clinicopathological characteristics (Mean±SD)
| Clinical features | Gene name | I/Poorly Differentiated/Tubular Adenocarcinoma | II/Moderately Differentiated/Mucinous Adenocarcinoma | III/Well Differentiated/Signet Ring Cell Carcinoma | IV | F | P |
|---|---|---|---|---|---|---|---|
| TNM stage | AXIN1 | 0.495±0.347 | 0.612±0.373 | 0.529±0.286 | 0.528±0.304 | 0.173 | 0.796 |
| β-NGF | 2.882±1.828 | 3.312±1.995 | 2.775±1.56 | 3.027±1.507 | 0.167 | 0.759 | |
| PD-L1 | 20.66±5.717 | 17.893±4.756 | 23.333±6.077 | 24.152±5.714 | 0.653 | 0.007 | |
| Degree of differentiation | AXIN1 | 0.792±0.264 | 0.439±0.226 | 0.331±0.231 | 1.253 | <0.001 | |
| β-NGF | 4.621±1.316 | 2.317±0.875 | 1.538±0.231 | 2.069 | <0.001 | ||
| PD-L1 | 22.566±5.901 | 22.346±5.964 | 22.306±6.695 | 0.028 | 0.985 | ||
| Pathological type | AXIN1 | 0.519±0.306 | 0.6±0.315 | 0.55±0.325 | 0.185 | 0.572 | |
| β-NGF | 2.895±1.593 | 3.216±1.728 | 2.902±1.75 | 0.17 | 0.681 | ||
| PD-L1 | 22.04±5.9 | 22.189±5.521 | 23.816±7.102 | 0.126 | 0.803 |
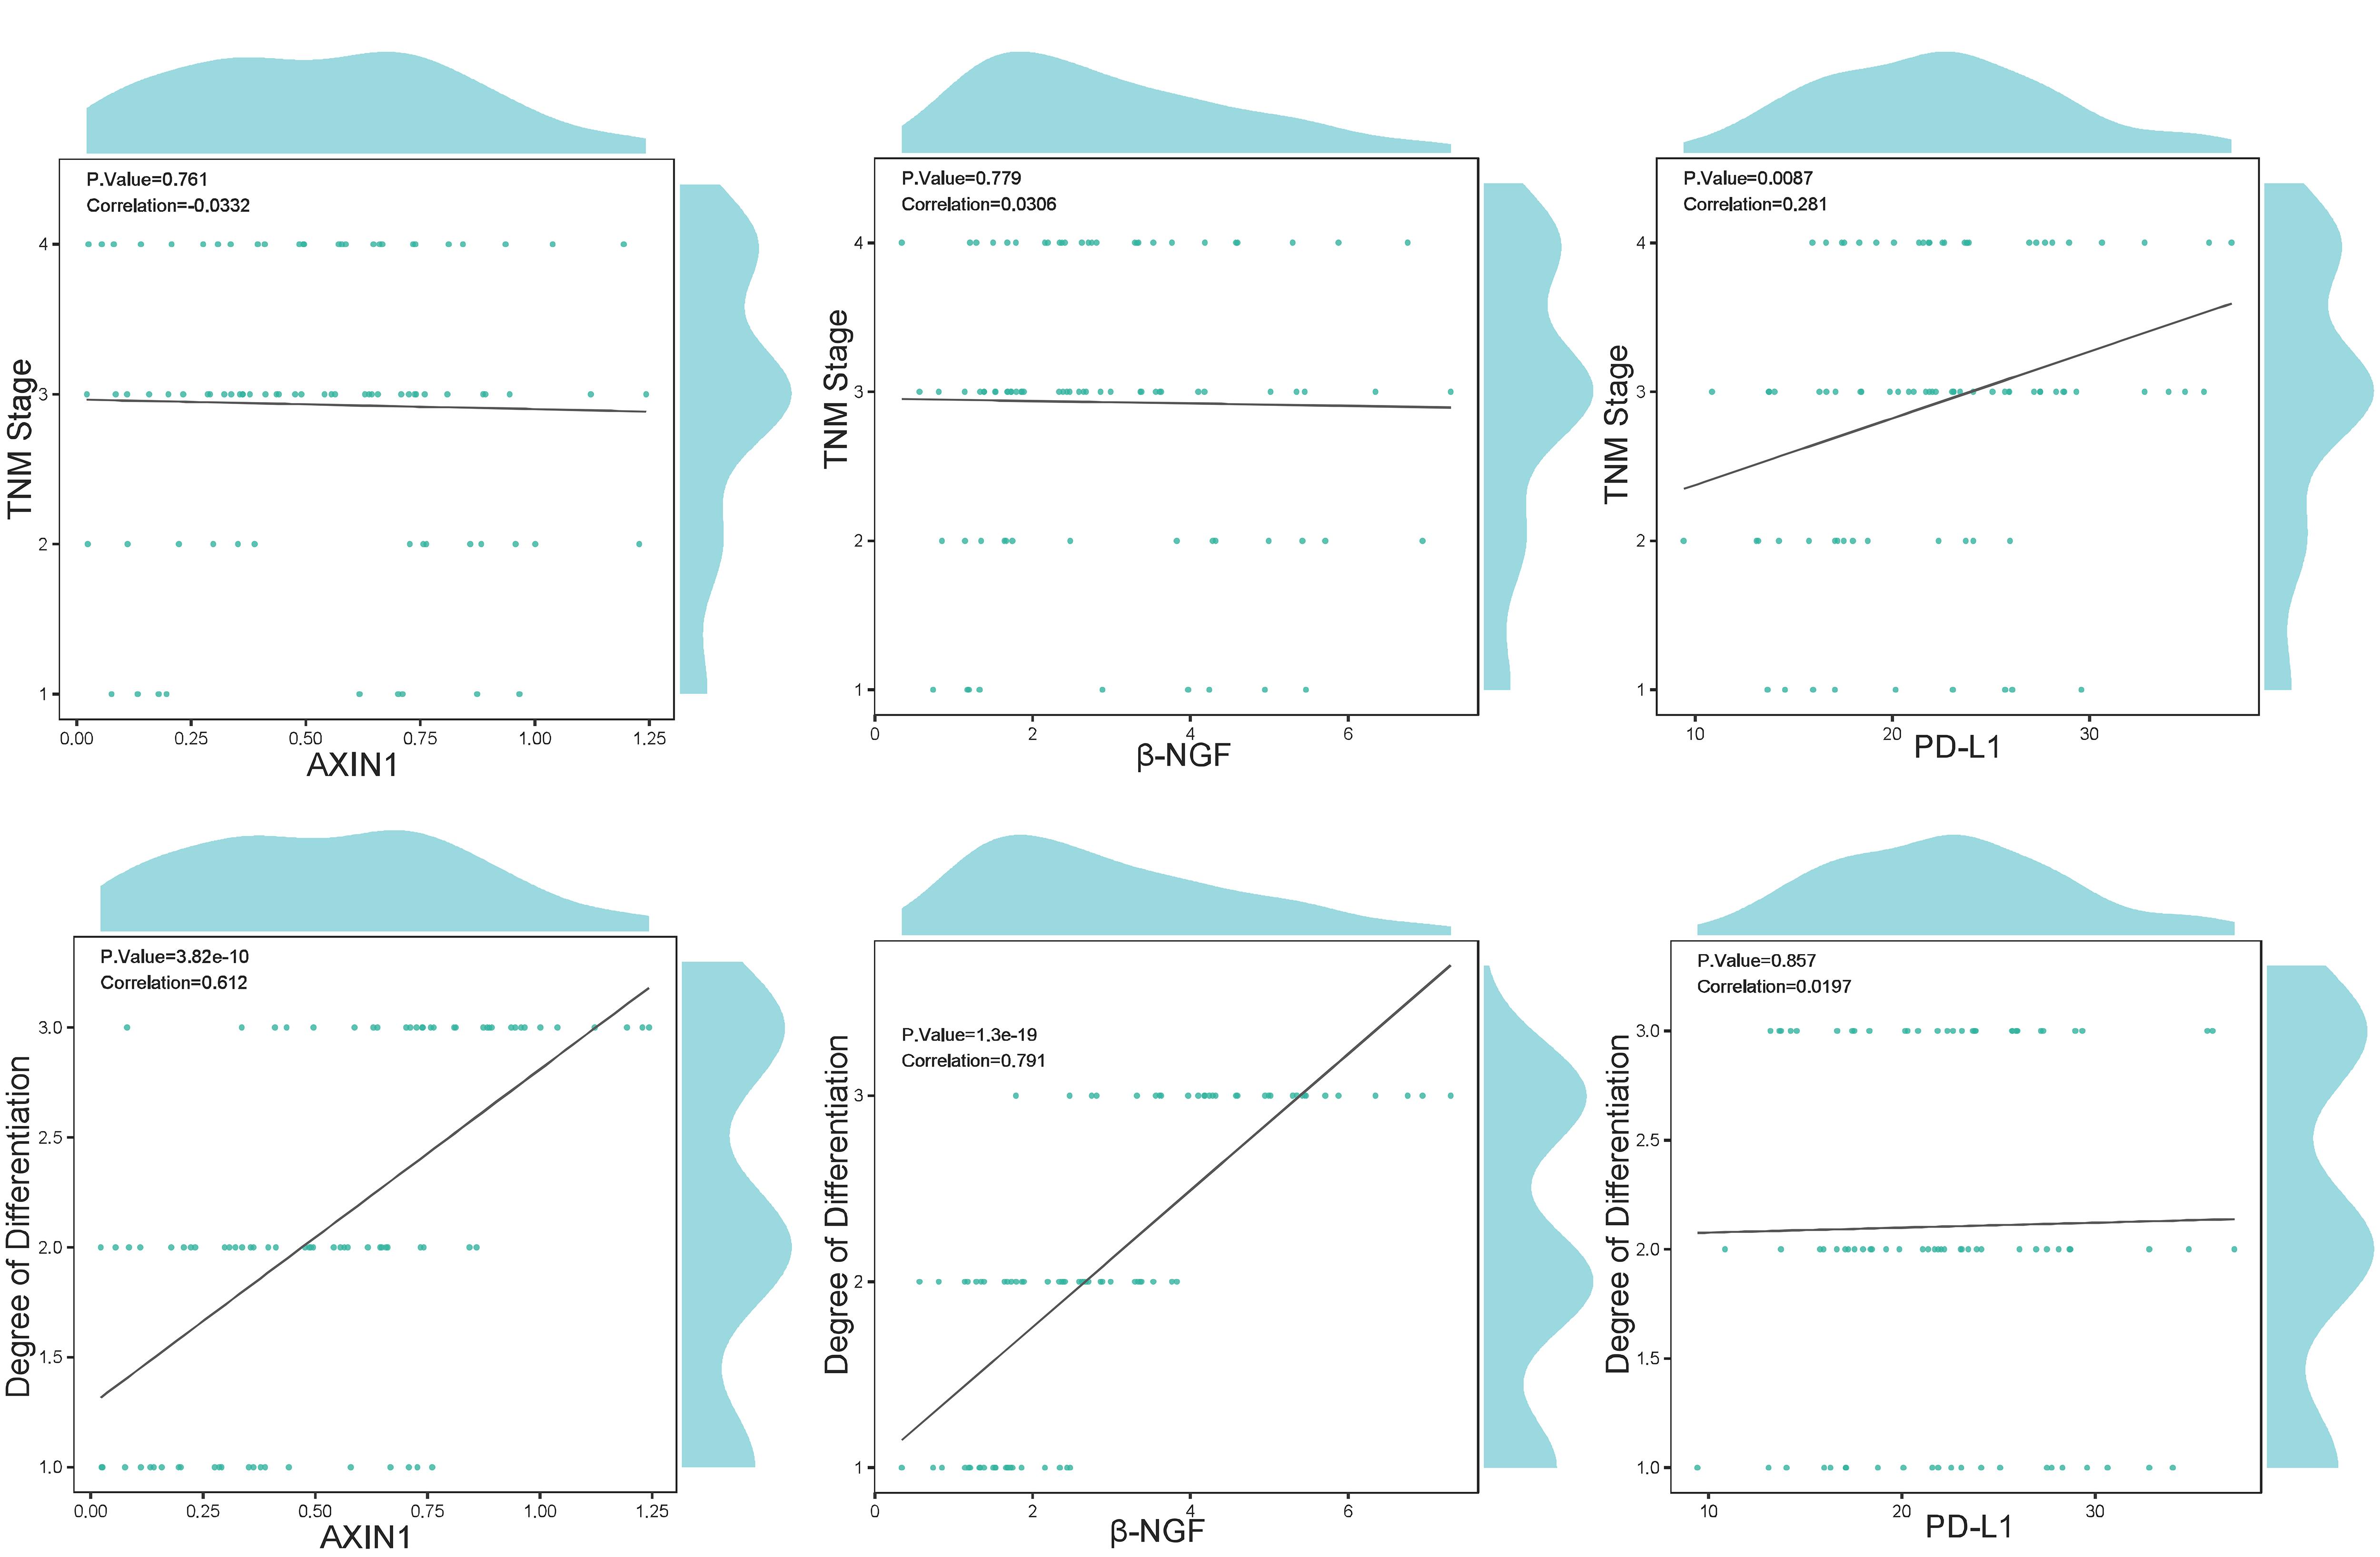
图3 PD-L1、AXIN1和β-NGF基因表达水平与TNM分期及分化程度之间的相关性图
Fig.3 Correlation of the expression levels of PD-L1, AXIN1, β-NGF mRNAs with TNM staging and degree of tumor differentiation.
| 1 | Moon J, Garfinkle R, Zelkowitz P, et al. Incidence and factors associated with mental health disorders in patients with rectal cancer post-restorative proctectomy[J]. Dis Colon Rectum, 2023, 66(9): 1203-11. |
| 2 | Xu ZL, Li Y, Cui YY, et al. Identifications of candidate genes significantly associated with rectal cancer by integrated bioinformatics analysis[J]. Technol Cancer Res Treat, 2020, 19: 1533033820973270. |
| 3 | Belli F. Special issue “current management of early and advanced rectal cancer”[J]. Cancers, 2023, 15(14): 3574. |
| 4 | Hernandez-Ainsa M, Velamazan R, Lanas A, et al. Blood-cell-based inflammatory markers as a useful tool for early diagnosis in colorectal cancer[J]. Front Med, 2022, 9: 843074. |
| 5 | Markozannes G, Kanellopoulou A, Dimopoulou O, et al. Systematic review of Mendelian randomization studies on risk of cancer[J]. BMC Med, 2022, 20(1): 41. |
| 6 | Silva S, Fatumo S, Nitsch D. Mendelian randomization studies on coronary artery disease: a systematic review and meta-analysis[J]. Syst Rev, 2024, 13(1): 29. |
| 7 | Ho J, Mak CCH, Sharma V, et al. Mendelian randomization studies of lifestyle-related risk factors for osteoarthritis: a PRISMA review and meta-analysis[J]. Int J Mol Sci, 2022, 23(19): 11906. |
| 8 | Bouras E, Karhunen V, Gill D, et al. Circulating inflammatory cytokines and risk of five cancers: a Mendelian randomization analysis[J]. BMC Med, 2022, 20(1): 3. |
| 9 | Bull CJ, Hazelwood E, Bell JA, et al. Identifying metabolic features of colorectal cancer liability using Mendelian randomization[J]. medRxiv, 2023: 2023.03.10.23287084. |
| 10 | Zhao JH, Stacey D, Eriksson N, et al. Genetics of circulating inflammatory proteins identifies drivers of immune-mediated disease risk and therapeutic targets[J]. Nat Immunol, 2023, 24(9): 1540-51. |
| 11 | Ference BA, Holmes MV, Smith GD. Using Mendelian randomization to improve the design of randomized trials[J]. Cold Spring Harb Perspect Med, 2021, 11(7): a040980. |
| 12 | Perez RO, São Julião GP. Rectal cancer management and the long list of unanswered questions[J]. Ann Surg Oncol, 2023, 30(8): 4566-7. |
| 13 | Zhu JR, Wu YQ, Lao SX, et al. Targeting TRIM54/Axin1/β-catenin axis prohibits proliferation and metastasis in hepatocellular carcinoma[J]. Front Oncol, 2021, 11: 759842. |
| 14 | 蒋漫琦, 何师茜, 杨 洪, 等. CDK5RAP1通过Wnt/β-Catenin信号通路调控结直肠癌发生和进展的研究[J]. 国际消化病杂志, 2023, 43(4): 246-56. |
| 15 | Rudeen AJ, Douglas JT, Xing ML, et al. The 15-amino acid repeat region of adenomatous polyposis coli is intrinsically disordered and retains conformational flexibility upon binding β-catenin[J]. Biochemistry, 2020, 59(41): 4039-50. |
| 16 | 孙跃胜, 潘江华, 窦巩昊, 等. 结直肠癌的Wnt信号通路相关基因突变的研究[J]. 浙江创伤外科, 2019, 24(3): 437-9. |
| 17 | 梁家宏, 郑周红, 尹朝晖. 神经生长因子及受体在结直肠肿瘤中的表达及临床意义[J]. 当代医学, 2013, 19(28): 1-3. DOI: 10.3969/j.issn.1009-4393.2013.28.001 |
| 18 | 雷 雲, 杨 铃, 张 涛. 神经生长因子对结直肠癌发展和不良预后的影响[J]. 成都医学院学报, 2021, 16(2): 148-52. DOI: 10.3969/j.issn.1674-2257.2021.02.003 |
| 19 | 刘丹丹. 通麻汤联合穴位注射治疗结直肠癌奥沙利铂化疗相关外周神经毒性的效果及对患者生活质量的影响[J]. 临床医学研究与实践, 2022, 7(18): 128-30. |
| 20 | Hsieh RC, Krishnan S, Wu RC, et al. ATR-mediated CD47 and PD-L1 up-regulation restricts radiotherapy-induced immune priming and abscopal responses in colorectal cancer[J]. Sci Immunol, 2022, 7(72): eabl9330. |
| 21 | Boustani J, Derangère V, Bertaut A, et al. Radiotherapy scheme effect on PD-L1 expression for locally advanced rectal cancer[J]. Cells, 2020, 9(9): 2071. |
| 22 | Ding Y, Fu YY, Wei W, et al. Simultaneous high PD-L1 and low VEGFR2 expression is associated with better overall survival in rectal cancer[J]. Transl Cancer Res, 2021, 10(1): 499-508. |
| 23 | Cornista AM, Giolito MV, Baker K, et al. Colorectal cancer immunotherapy: state of the art and future directions[J]. Gastro Hep Adv, 2023, 2(8): 1103-19. |
| 24 | Lim YJ, Koh J, Choi M, et al. Prognostic stratification based on the levels of tumor-infiltrating myeloid-derived suppressor cells and PD-1/PD-L1 axis in locally advanced rectal cancer[J]. Front Oncol, 2022, 12: 1018700. |
| 25 | Ugai T, Shimizu T, Kawamura H, et al. Inverse relationship between Fusobacterium nucleatum amount and tumor CD274 (PD-L1) expression in colorectal carcinoma[J]. Clin Transl Immunology, 2023, 12(8): e1453. |
| 26 | Srivastava P, Husain N, Shukla S, et al. PD-L1 Expression in colorectal carcinoma and its correlation with clinicopathological parameters, microsatellite instability and BRAF mutation[J]. Indian J Pathol Microbiol, 2021, 64(3): 490-6. |
| 27 | Qiu QQ, Tan D, Chen QF, et al. Clinical implications of PD-L1 expression and pathway-related molecular subtypes in advanced Asian colorectal cancer patients[J]. Am J Cancer Res, 2024, 14(2): 796-808. |
| 28 | Secinti IE, Ozgur T, Dede I. PD-L1 expression in colorectal adenocarcinoma is associated with the tumor immune microenvironment and epithelial-mesenchymal transition[J]. Am J Clin Pathol, 2022, 158(4): 506-15. |
| 29 | Moradifard S, Minuchehr Z, Ganji SM. An investigation on the c-MYC, AXIN1, and COL11A1 gene expression in colorectal cancer[J]. Biotechnol Appl Biochem, 2022, 69(4): 1576-86. |
| 30 | Ferraguti G, Terracina S, Tarani L, et al. Nerve growth factor and the role of inflammation in tumor development[J]. Curr Issues Mol Biol, 2024, 46(2): 965-89. |
| [1] | 刘佳进, 缪长宏, 徐健康, 余伟杰, 陈继鑫, 唐好知, 刘爱峰. 肠道菌群与色素沉着绒毛结节性滑膜炎之间的因果关系:基于孟德尔随机化分析[J]. 南方医科大学学报, 2024, 44(7): 1397-1406. |
| [2] | 武若杰, 刘 睿, 张一粟, 李晓红. 帕瑞昔布钠改善腹腔镜下直肠癌根治术患者的炎症微环境并促进患者恢复:基于下调CXCL8-CXCR1/2表达[J]. 南方医科大学学报, 2024, 44(2): 363-369. |
| [3] | 颜 畅, 刘 爽, 宋庆志, 胡艺冰. 二甲双胍通过抑制线粒体氧化磷酸化降低结直肠癌干细胞的自我更新能力[J]. 南方医科大学学报, 2023, 43(8): 1279-1286. |
| [4] | 占雯婕, 赵 玲. 1型糖尿病可能增加甲状腺毒症的风险:基于两样本孟德尔随机化方法[J]. 南方医科大学学报, 2023, 43(8): 1396-1401. |
| [5] | 魏 可, 石纪雯, 肖雨寒, 王文锐, 杨清玲, 陈昌杰. miR-30e-5p过表达促进结直肠癌细胞的增殖和迁移:基于下调PTEN激活CXCL12轴[J]. 南方医科大学学报, 2023, 43(7): 1081-1092. |
| [6] | 张雪芳, 陈延华, 李宗恒, 尚 靖, 袁泽婷, 邓皖利, 骆 莺, 韩 娜, 殷佩浩, 殷 军. 六神丸治疗小鼠结肠炎相关性结直肠癌的作用机制:基于网络药理学和体内验证方法[J]. 南方医科大学学报, 2023, 43(7): 1051-1062. |
| [7] | 邓 婷, 杜伯雨, 郗雪艳. 结直肠癌细胞通过激活成纤维细胞的ERK通路诱导癌症相关成纤维细胞的形成[J]. 南方医科大学学报, 2023, 43(6): 943-951. |
| [8] | 程 阳, 何旭旭, 王 炼, 许轶博, 沈梦迪, 张文静, 夏勇生, 张 婕, 张 敏, 王宜君, 胡建国, 张 军. HSDL2高表达促进直肠癌细胞增殖:基于激活CDK6/cyclinD1信号通路[J]. 南方医科大学学报, 2023, 43(4): 544-551. |
| [9] | 马振南, 赵雪峰, 张晓微, 许广大, 刘福全. DTX2通过Notch2/Akt轴促进结直肠癌细胞的迁移和侵袭[J]. 南方医科大学学报, 2023, 43(3): 340-348. |
| [10] | 王旋成, 朱一帆, 周海琳, 黄宗声, 陈鸿炜, 张嘉豪, 杨珊伊, 陈广辉, 张淇淞. 血清非靶向代谢组学联合靶向胆汁酸代谢组学筛查结直肠癌的潜在生物标志物[J]. 南方医科大学学报, 2023, 43(3): 443-453. |
| [11] | 苏 超, 田彧潇, 张 清, 万田豪, 夏 迪. 肌肉质量增加可能导致椎间盘退变:一项两样本孟德尔随机化研究[J]. 南方医科大学学报, 2023, 43(12): 2029-2034. |
| [12] | 赵欢灵, 凌羽晓, 宓 帅, 朱家豪, 范佳耀, 杨 叶, 王 晶, 李迎君. Leptin循环水平与结直肠腺瘤及结直肠癌的关联性:一项病例对照和孟德尔随机化研究[J]. 南方医科大学学报, 2023, 43(12): 1989-1997. |
| [13] | 邓金海, 潘 腾, 周广林, 高 悦, 彭伟雄, 魏 玮, 吕纯鑫. 高表达分泌颗粒蛋白II增加结直肠癌细胞对奥沙利铂的耐药性[J]. 南方医科大学学报, 2023, 43(10): 1657-1664. |
| [14] | 姚婉瑜, 汪枭睿, 杨 雨, 游俊雄, 金军国, 曾 平, 韩钦芮, 姚学清, 孙学刚, 周 瑾. 靶向结直肠癌的小白菊内酯脂质体纳米颗粒诱导程序性坏死并改善T细胞耗竭[J]. 南方医科大学学报, 2023, 43(10): 1674-1681. |
| [15] | 丁虹芳, 李肖娟, 周璐炜, 崔 智, 蒙海德, 王 娟. ANP32A沉默体外抑制结直肠癌的生长、侵袭和迁移:基于AKT信号通路活性的下降[J]. 南方医科大学学报, 2023, 43(1): 52-59. |
| 阅读次数 | ||||||
|
全文 |
|
|||||
|
摘要 |
|
|||||