
南方医科大学学报 ›› 2026, Vol. 46 ›› Issue (10): 2296-2308.doi: 10.12122/j.issn.1673-4254.2026.10.02
• • 上一篇
杨孟迪1( ), 尹鸿涛2, 李红利2, 李琼2, 季晓2, 甄东户2()
收稿日期:2026-04-28
出版日期:2026-10-20
发布日期:2026-10-26
通讯作者:
甄东户
E-mail:di17865202884@163.com;zhdh8279@163.com
作者简介:杨孟迪,在读博士研究生,E-mail: di17865202884@163.com
基金资助:
Mengdi YANG1(), Hongtao YIN2, Hongli LI2, Qiong LI2, Xiao JI2, Donghu ZHEN2()
Received:2026-04-28
Online:2026-10-20
Published:2026-10-26
Contact:
Donghu ZHEN
E-mail:di17865202884@163.com;zhdh8279@163.com
摘要:
目的 探讨中老年人群抑郁症状及抑郁发作与肾脏高滤过(RHF)的相关性。 方法 本横断面研究纳入了REACTION研究兰州地区9469例中老年受试者。排除肾脏高滤过(eGFR)<60 mL·min-1·1.73 m-2、尿白蛋白/肌酐比值≥30 mg/g、恶性肿瘤及抑郁问卷资料不全或服用抗抑郁药物者后,采用患者健康问卷-9(PHQ-9)评估抑郁症状,并按PHQ-9<5、5≤PHQ-9<10 及 PHQ-9≥10分组;同时评估抑郁发作状态。以校正年龄、性别、身高、体质量、高血压和糖尿病后的对数eGFR回归残差第95百分位以上定义RHF。采用多因素logistic回归分析抑郁状态与RHF的相关性,并采用限制性三次样条分析PHQ-9总分与RHF风险的剂量-反应关系。进一步采用随机森林、SHAP和Boruta方法进行探索性分析。 结果 限制性三次样条分析显示,PHQ-9总分与RHF风险之间存在显著非线性关联,整体关联及非线性成分均有统计学意义。多因素调整混杂因素后,与PHQ-9 0~4分组相比,PHQ-9 5~9分组RHF风险无显著升高,而PHQ-9≥10分组RHF风险显著增加(OR=1.854,95% CI:1.074~3.201,P=0.027)。按PHQ-9<10分和≥10分二分类后,PHQ-9≥10分者RHF风险仍显著升高(OR=1.864,95% CI:1.080~3.210,P=0.025)。与无抑郁发作者相比,轻度抑郁发作与RHF无显著相关,而重度抑郁发作与RHF风险升高独立相关(OR=1.547,95% CI:1.082~2.212,P=0.017)。探索性机器学习分析显示,抑郁发作和临床相关抑郁症状均为RHF风险识别的稳定特征,但其贡献弱于年龄、空腹血糖和收缩压等传统因素。 结论 中老年人群中抑郁症状与RHF风险存在非线性关联,且风险升高主要出现在PHQ-9达到临床意义阈值后。重度抑郁发作亦与RHF风险升高相关,其时序关系及潜在机制仍需前瞻性研究进一步验证。
杨孟迪, 尹鸿涛, 李红利, 李琼, 季晓, 甄东户. 中老年人群抑郁症状与肾脏高滤过的相关性[J]. 南方医科大学学报, 2026, 46(10): 2296-2308.
Mengdi YANG, Hongtao YIN, Hongli LI, Qiong LI, Xiao JI, Donghu ZHEN. Association between depressive symptoms and renal hyperfiltration in middle-aged and older adults[J]. Journal of Southern Medical University, 2026, 46(10): 2296-2308.
| Characteristics | Depressive Symptoms | Depressive Episode | ||||||
|---|---|---|---|---|---|---|---|---|
| PHQ<5 | 5≤PHQ<10 | PHQ≥10 | P | No | Mild | Severe | P | |
| Case (n) | 8075 (85.3) | 1160 (12.3) | 234 (2.5) | 8196 (86.6) | 681 (7.2) | 592 (6.3) | ||
| Age (year) | 57.34±8.41 | 56.97±8.37 | 56.21±8.42 | 0.054 | 57.40±8.39 | 56.24±8.28a | 56.64±8.64a | <0.001 |
| Gender | <0.001 | <0.001 | ||||||
| Men | 2462 (30.5) | 231 (19.9)a | 45 (19.2)a | 2469 (30.1) | 152 (22.3)a | 117 (19.8)a | ||
| Women | 5613 (69.5) | 929 (80.1)a | 189 (80.8)a | 5757 (69.9) | 529 (77.7) a | 475 (80.2)a | ||
| Height | 162.17±7.61 | 160.83±7.33a | 160.88±7.42a | <0.001 | 162.11±7.60 | 161.47±7.55a | 160.65±7.36a | <0.001 |
| Weight | 63.91±10.49 | 61.70±9.70a | 61.26±10.28a | <0.001 | 63.86±10.49 | 62.49±9.67a | 61.20±9.93ab | <0.001 |
| BMI | 24.26±3.32 | 23.82±3.19a | 23.61±3.20a | <0.001 | 24.25±3.33 | 23.94±3.10a | 23.66±3.14a | <0.001 |
| No single* | 7094 (87.9) | 972 (83.8)a | 180 (76.9)ab | <0.001 | 7200 (87.8) | 569 (83.6)a | 477 (80.6)a | <0.001 |
| High school level | 4486 (55.6) | 613 (52.8) | 132 (56.4) | 0.208 | 4541 (55.4) | 367 (53.9) | 323 (54.6) | 0.704 |
| Sleep quality | 0.048 | 0.588 | ||||||
| Good | 6396 (79.2) | 955 (82.3)a | 186 (79.5) | 6510 (79.4) | 550 (80.8) | 477 (80.6) | ||
| Poor | 1679 (20.8) | 205 (17.7)a | 48 (20.5) | 1686 (20.6) | 131 (19.2) | 115 (19.4) | ||
| SBP | 128.60±19.17 | 125.94±18.73a | 124.04±17.01a | 128.44±19.14 | 127.37±19.07 | 125.23±18.15ab | <0.001 | |
| DBP | 76.65±10.64 | 75.27±10.38a | 74.04±10.28a | <0.001 | 76.53±10.62 | 76.36±10.63 | 74.89±10.48ab | 0.001 |
| FPG | 5.60 (5.10, 6.26) | 5.50 (5.03, 6.14)a | 5.46 (5.08, 6.20) | 0.013 | 5.60 (5.10, 6.27) | 5.50 (5.03, 6.20) | 5.48 (5.01, 6.02)a | 0.001 |
| 2hPG | 7.52 (6.10, 9.81) | 7.35 (5.99, 9.50) | 7.40 (6.04, 10.00) | 0.158 | 7.52 (6.10, 9.80) | 7.34 (5.90, 9.72) | 7.39 (5.95, 9.40) | 0.047 |
| HDL | 1.22±0.30 | 1.25±0.31a | 1.24±0.31 | 0.005 | 1.22±0.30 | 1.23±0.30 | 1.23±0.32 | 0.712 |
| Low HDL | 2298 (24.3) | 290 (25.0)a | 52 (22.2) | 0.007 | 2295 (28.0) | 190 (27.9) | 155 (26.2) | 0.635 |
| LDL | 2.55±0.77 | 2.60±0.76a | 2.52±0.79 | 0.116 | 2.56±0.77 | 2.48±0.76a | 2.55±0.77 | 0.033 |
| High LDL | 216 (2.7) | 31 (2.7) | 5 (2.1) | 0.880 | 222 (2.7) | 17 (2.5) | 13 (2.2) | 0.727 |
| TC | 4.53±1.03 | 4.62±1.05a | 4.52±1.11 | 0.036 | 4.55±1.03 | 4.45±1.03a | 4.56±1.08 | 0.059 |
| High TC | 418 (5.2) | 60 (5.2) | 16 (6.8) | 0.529 | 436 (5.3) | 28 (4.1) | 30 (5.1) | 0.39 |
| TG | 1.49 (1.07, 2.11) | 1.46 (1.06, 2.06) | 1.45 (1.00, 2.17) | 0.523 | 1.49 (1.07, 2.11) | 1.44 (1.04, 2.05) | 1.47 (1.03, 2.07) | 0.145 |
| High TG | 1697 (21.0) | 224 (19.3) | 56 (23.9) | 0.208 | 1727 (21.1) | 130 (19.1) | 120 (20.3) | 0.441 |
| SCr | 0.76±0.14 | 0.74±0.13a | 0.73±0.12a | <0.001 | 0.76±0.13 | 0.74±0.14a | 0.74±0.13a | <0.001 |
| eGFR | 92.47±12.30 | 92.63±12.34 | 94.02±13.05 | 0.161 | 92.40±12.27 | 93.42±12.48a | 93.36±12.88 | 0.028 |
| UACR | 2.15 (1.38, 3.33) | 2.24 (1.37, 3.40) | 2.16 (1.29, 3.25) | 0.547 | 2.16 (1.38, 3.33) | 2.21 (1.37, 3.30) | 2.12 (1.33, 3.35) | 0.770 |
| Smoking | 0.001 | 0.079 | ||||||
| Now not | 6760 (83.7) | 1024 (88.3)a | 202 (86.3) | 6882 (84.0) | 588 (86.3) | 516 (87.2) | ||
| Occasionally | 232 (2.9) | 19 (1.6)a | 6 (2.6) | 233 (2.8) | 11 (1.6) | 13 (2.2) | ||
| Often | 1083 (13.4) | 117 (10.1)a | 26 (11.1) | 1081 (13.2) | 82 (12.0) | 63 (10.6) | ||
| Drinking | 0.052 | 0.240 | ||||||
| Now not | 5846 (72.4) | 864 (74.5) | 172 (73.5) | 5968 (72.8) | 487 (71.5) | 427 (72.1) | ||
| Occasionally | 1791 (22.2) | 255 (22.0) | 46 (19.7) | 1787 (21.8) | 163 (23.9) | 142 (24.0) | ||
| Often | 438 (5.4) | 41 (3.5) | 16 (6.8) | 441 (5.4) | 31 (4.6) | 23 (3.9) | ||
| Regular exercise | 1778 (22.0) | 240 (20.7) | 53 (22.6) | 0.567 | 1818 (22.2) | 139 (20.4) | 114 (19.3) | 0.159 |
| DM | 1929 (23.9) | 270 (23.3) | 62 (26.5) | 0.573 | 1977 (24.1) | 153 (22.5) | 131 (22.1) | 0.366 |
| HT | 2956 (36.9) | 387 (33.4) | 63 (26.9)a | 0.001 | 2983 (36.4) | 242 (35.5) | 181 (30.6)a | 0.017 |
| CCVD | 349 (4.3) | 75 (6.5)a | 12 (5.1) | 0.005 | 368 (4.5) | 34 (5.0) | 34 (5.7) | 0.329 |
| RHF | 403 (5.0) | 53 (4.6) | 17 (7.3) | 0.225 | 403 (4.9) | 29 (4.3) | 41 (6.9) | 0.063 |
表1 不同抑郁症状和抑郁发作分组研究对象的一般特征
Tab.1 General characteristics of subjects grouped by depressive symptoms and depressive episodes
| Characteristics | Depressive Symptoms | Depressive Episode | ||||||
|---|---|---|---|---|---|---|---|---|
| PHQ<5 | 5≤PHQ<10 | PHQ≥10 | P | No | Mild | Severe | P | |
| Case (n) | 8075 (85.3) | 1160 (12.3) | 234 (2.5) | 8196 (86.6) | 681 (7.2) | 592 (6.3) | ||
| Age (year) | 57.34±8.41 | 56.97±8.37 | 56.21±8.42 | 0.054 | 57.40±8.39 | 56.24±8.28a | 56.64±8.64a | <0.001 |
| Gender | <0.001 | <0.001 | ||||||
| Men | 2462 (30.5) | 231 (19.9)a | 45 (19.2)a | 2469 (30.1) | 152 (22.3)a | 117 (19.8)a | ||
| Women | 5613 (69.5) | 929 (80.1)a | 189 (80.8)a | 5757 (69.9) | 529 (77.7) a | 475 (80.2)a | ||
| Height | 162.17±7.61 | 160.83±7.33a | 160.88±7.42a | <0.001 | 162.11±7.60 | 161.47±7.55a | 160.65±7.36a | <0.001 |
| Weight | 63.91±10.49 | 61.70±9.70a | 61.26±10.28a | <0.001 | 63.86±10.49 | 62.49±9.67a | 61.20±9.93ab | <0.001 |
| BMI | 24.26±3.32 | 23.82±3.19a | 23.61±3.20a | <0.001 | 24.25±3.33 | 23.94±3.10a | 23.66±3.14a | <0.001 |
| No single* | 7094 (87.9) | 972 (83.8)a | 180 (76.9)ab | <0.001 | 7200 (87.8) | 569 (83.6)a | 477 (80.6)a | <0.001 |
| High school level | 4486 (55.6) | 613 (52.8) | 132 (56.4) | 0.208 | 4541 (55.4) | 367 (53.9) | 323 (54.6) | 0.704 |
| Sleep quality | 0.048 | 0.588 | ||||||
| Good | 6396 (79.2) | 955 (82.3)a | 186 (79.5) | 6510 (79.4) | 550 (80.8) | 477 (80.6) | ||
| Poor | 1679 (20.8) | 205 (17.7)a | 48 (20.5) | 1686 (20.6) | 131 (19.2) | 115 (19.4) | ||
| SBP | 128.60±19.17 | 125.94±18.73a | 124.04±17.01a | 128.44±19.14 | 127.37±19.07 | 125.23±18.15ab | <0.001 | |
| DBP | 76.65±10.64 | 75.27±10.38a | 74.04±10.28a | <0.001 | 76.53±10.62 | 76.36±10.63 | 74.89±10.48ab | 0.001 |
| FPG | 5.60 (5.10, 6.26) | 5.50 (5.03, 6.14)a | 5.46 (5.08, 6.20) | 0.013 | 5.60 (5.10, 6.27) | 5.50 (5.03, 6.20) | 5.48 (5.01, 6.02)a | 0.001 |
| 2hPG | 7.52 (6.10, 9.81) | 7.35 (5.99, 9.50) | 7.40 (6.04, 10.00) | 0.158 | 7.52 (6.10, 9.80) | 7.34 (5.90, 9.72) | 7.39 (5.95, 9.40) | 0.047 |
| HDL | 1.22±0.30 | 1.25±0.31a | 1.24±0.31 | 0.005 | 1.22±0.30 | 1.23±0.30 | 1.23±0.32 | 0.712 |
| Low HDL | 2298 (24.3) | 290 (25.0)a | 52 (22.2) | 0.007 | 2295 (28.0) | 190 (27.9) | 155 (26.2) | 0.635 |
| LDL | 2.55±0.77 | 2.60±0.76a | 2.52±0.79 | 0.116 | 2.56±0.77 | 2.48±0.76a | 2.55±0.77 | 0.033 |
| High LDL | 216 (2.7) | 31 (2.7) | 5 (2.1) | 0.880 | 222 (2.7) | 17 (2.5) | 13 (2.2) | 0.727 |
| TC | 4.53±1.03 | 4.62±1.05a | 4.52±1.11 | 0.036 | 4.55±1.03 | 4.45±1.03a | 4.56±1.08 | 0.059 |
| High TC | 418 (5.2) | 60 (5.2) | 16 (6.8) | 0.529 | 436 (5.3) | 28 (4.1) | 30 (5.1) | 0.39 |
| TG | 1.49 (1.07, 2.11) | 1.46 (1.06, 2.06) | 1.45 (1.00, 2.17) | 0.523 | 1.49 (1.07, 2.11) | 1.44 (1.04, 2.05) | 1.47 (1.03, 2.07) | 0.145 |
| High TG | 1697 (21.0) | 224 (19.3) | 56 (23.9) | 0.208 | 1727 (21.1) | 130 (19.1) | 120 (20.3) | 0.441 |
| SCr | 0.76±0.14 | 0.74±0.13a | 0.73±0.12a | <0.001 | 0.76±0.13 | 0.74±0.14a | 0.74±0.13a | <0.001 |
| eGFR | 92.47±12.30 | 92.63±12.34 | 94.02±13.05 | 0.161 | 92.40±12.27 | 93.42±12.48a | 93.36±12.88 | 0.028 |
| UACR | 2.15 (1.38, 3.33) | 2.24 (1.37, 3.40) | 2.16 (1.29, 3.25) | 0.547 | 2.16 (1.38, 3.33) | 2.21 (1.37, 3.30) | 2.12 (1.33, 3.35) | 0.770 |
| Smoking | 0.001 | 0.079 | ||||||
| Now not | 6760 (83.7) | 1024 (88.3)a | 202 (86.3) | 6882 (84.0) | 588 (86.3) | 516 (87.2) | ||
| Occasionally | 232 (2.9) | 19 (1.6)a | 6 (2.6) | 233 (2.8) | 11 (1.6) | 13 (2.2) | ||
| Often | 1083 (13.4) | 117 (10.1)a | 26 (11.1) | 1081 (13.2) | 82 (12.0) | 63 (10.6) | ||
| Drinking | 0.052 | 0.240 | ||||||
| Now not | 5846 (72.4) | 864 (74.5) | 172 (73.5) | 5968 (72.8) | 487 (71.5) | 427 (72.1) | ||
| Occasionally | 1791 (22.2) | 255 (22.0) | 46 (19.7) | 1787 (21.8) | 163 (23.9) | 142 (24.0) | ||
| Often | 438 (5.4) | 41 (3.5) | 16 (6.8) | 441 (5.4) | 31 (4.6) | 23 (3.9) | ||
| Regular exercise | 1778 (22.0) | 240 (20.7) | 53 (22.6) | 0.567 | 1818 (22.2) | 139 (20.4) | 114 (19.3) | 0.159 |
| DM | 1929 (23.9) | 270 (23.3) | 62 (26.5) | 0.573 | 1977 (24.1) | 153 (22.5) | 131 (22.1) | 0.366 |
| HT | 2956 (36.9) | 387 (33.4) | 63 (26.9)a | 0.001 | 2983 (36.4) | 242 (35.5) | 181 (30.6)a | 0.017 |
| CCVD | 349 (4.3) | 75 (6.5)a | 12 (5.1) | 0.005 | 368 (4.5) | 34 (5.0) | 34 (5.7) | 0.329 |
| RHF | 403 (5.0) | 53 (4.6) | 17 (7.3) | 0.225 | 403 (4.9) | 29 (4.3) | 41 (6.9) | 0.063 |
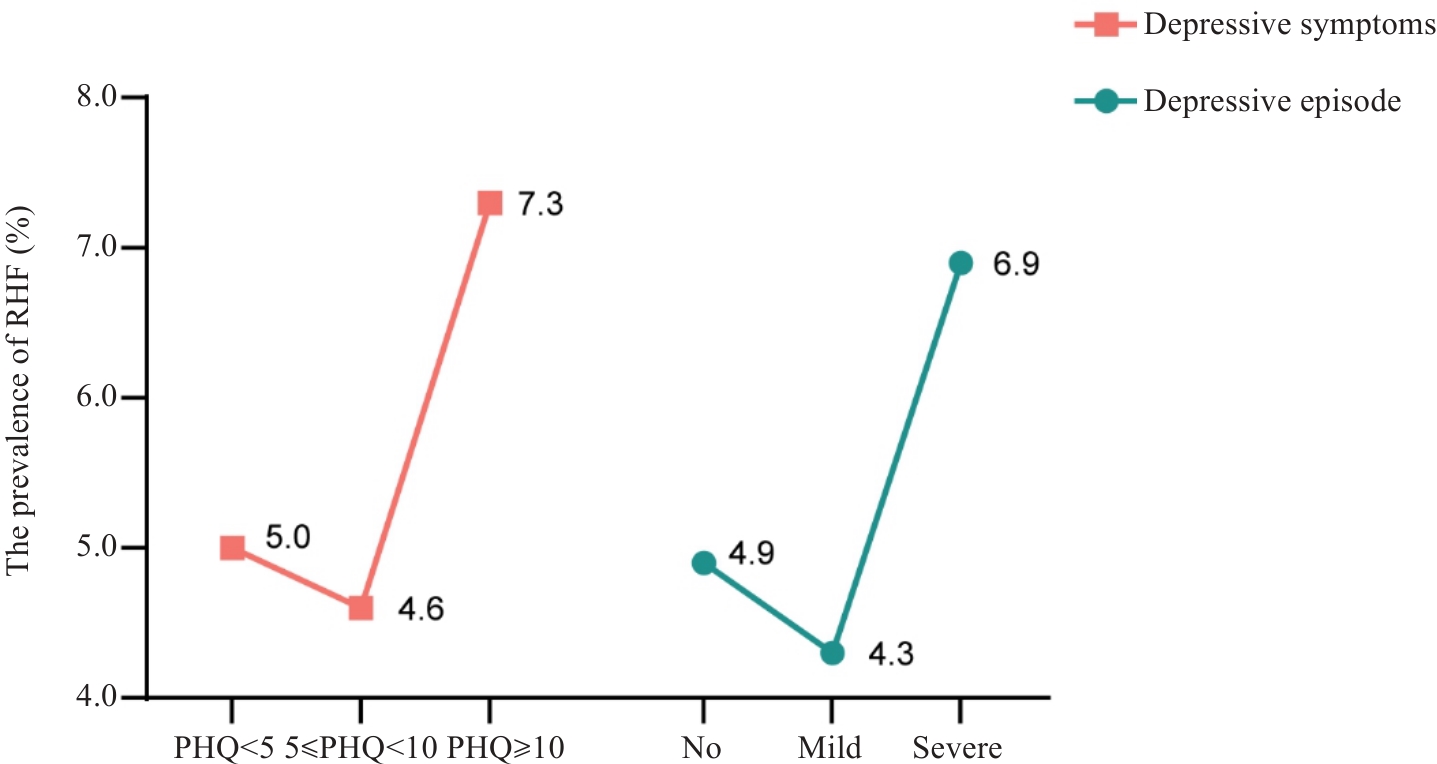
图1 不同抑郁分组下RHF患病率
Fig.1 Prevalence of renal hyperfiltration (RHF) in different depressive subgroups.
| Characteristics | Non-RHF | RHF | P |
|---|---|---|---|
| Case [n (%)] | 8996 (95) | 473 (5.0) | |
| Age (year) | 57.19±8.44 | 58.74±7.61 | <0.001 |
| Gender | 0.101 | ||
| Men | 2617 (29.1) | 121 (25.6) | |
| Women | 6379 (70.9) | 352 (74.4) | |
| Height | 161.95±7.59 | 162.30±7.58 | 0.335 |
| Weight | 63.47±10.39 | 65.55±10.90 | <0.001 |
| BMI | 24.15±3.28 | 24.86±3.65 | <0.001 |
| Sleep quality | 0.040 | ||
| Good | 7143 (79.4) | 394 (83.3) | |
| Poor | 1853 (20.6) | 79 (16.7) | |
| No single* | 7840 (87.1) | 406 (85.8) | 0.406 |
| High school level | 4986 (55.4) | 245 (51.8) | 0.122 |
| HDL | 1.25±0.29 | 0.84±0.25 | <0.001 |
| Low HDL | 2262 (25.1) | 378 (79.9) | <0.001 |
| LDL | 2.60±0.75 | 1.74±0.62 | <0.001 |
| High LDL | 251 (2.8) | 1 (0.2) | 0.001 |
| TC | 4.62±0.99 | 3.11±0.90 | <0.001 |
| High TC | 493 (5.5) | 1 (0.2) | <0.001 |
| TG | 1.52 (1.09, 2.14) | 0.99 (0.70, 1.40) | <0.001 |
| High TG | 1954 (21.7) | 23 (4.9) | <0.001 |
| SBP | 127.86±18.99 | 133.89±20.12 | <0.001 |
| DBP | 76.41±10.61 | 76.54±10.78 | 0.790 |
| FPG | 5.56 (5.06, 6.20) | 5.87 (5.46, 6.58) | <0.001 |
| 2hPG | 7.50 (6.09, 9.72) | 7.50 (6.12, 10.42) | 0.283 |
| SCr | 0.77±0.12 | 0.51±0.08 | <0.001 |
| eGFR | 91.65±11.82 | 109.35±9.29 | <0.001 |
| UACR | 2.14 (1.37, 3.33) | 2.42 (1.53, 3.64) | <0.001 |
| Smoking | 0.303 | ||
| Now not | 7581 (84.3) | 405 (85.6) | |
| Occasionally | 241 (2.7) | 16 (3.4) | |
| Often | 1174 (13.1) | 52 (11.0) | |
| Drinking | 0.015 | ||
| Now not | 6511 (72.4) | 371 (78.4) | |
| Occasionally | 2011 (22.4) | 81 (17.1) | |
| Often | 474 (5.3) | 21 (4.4) | |
| Regular exercise | 1990 (22.1) | 81 (17.1) | 0.010 |
| Depressive Symptoms | 0.225 | ||
| PHQ<5 | 7672 (85.3) | 403 (85.2) | |
| 5≤PHQ<10 | 1107 (12.3) | 53 (11.2) | |
| PHQ≥10 | 217 (2.4) | 17 (3.6) | |
| Depressive Episode | 0.063 | ||
| No | 7793 (86.6) | 403 (85.2) | |
| Mild | 652 (7.2) | 29 (6.1) | |
| Severe | 551 (6.1) | 41 (8.7) | |
| DM | 2123 (23.6) | 138 (29.2) | 0.006 |
| HT | 3190 (35.5) | 216 (45.7) | <0.001 |
| CCVD | 401 (4.5) | 35 (7.4) | 0.003 |
表2 不同RHF状态研究对象的一般特征
Tab.2 General characteristics of subjects with different RHF statuses
| Characteristics | Non-RHF | RHF | P |
|---|---|---|---|
| Case [n (%)] | 8996 (95) | 473 (5.0) | |
| Age (year) | 57.19±8.44 | 58.74±7.61 | <0.001 |
| Gender | 0.101 | ||
| Men | 2617 (29.1) | 121 (25.6) | |
| Women | 6379 (70.9) | 352 (74.4) | |
| Height | 161.95±7.59 | 162.30±7.58 | 0.335 |
| Weight | 63.47±10.39 | 65.55±10.90 | <0.001 |
| BMI | 24.15±3.28 | 24.86±3.65 | <0.001 |
| Sleep quality | 0.040 | ||
| Good | 7143 (79.4) | 394 (83.3) | |
| Poor | 1853 (20.6) | 79 (16.7) | |
| No single* | 7840 (87.1) | 406 (85.8) | 0.406 |
| High school level | 4986 (55.4) | 245 (51.8) | 0.122 |
| HDL | 1.25±0.29 | 0.84±0.25 | <0.001 |
| Low HDL | 2262 (25.1) | 378 (79.9) | <0.001 |
| LDL | 2.60±0.75 | 1.74±0.62 | <0.001 |
| High LDL | 251 (2.8) | 1 (0.2) | 0.001 |
| TC | 4.62±0.99 | 3.11±0.90 | <0.001 |
| High TC | 493 (5.5) | 1 (0.2) | <0.001 |
| TG | 1.52 (1.09, 2.14) | 0.99 (0.70, 1.40) | <0.001 |
| High TG | 1954 (21.7) | 23 (4.9) | <0.001 |
| SBP | 127.86±18.99 | 133.89±20.12 | <0.001 |
| DBP | 76.41±10.61 | 76.54±10.78 | 0.790 |
| FPG | 5.56 (5.06, 6.20) | 5.87 (5.46, 6.58) | <0.001 |
| 2hPG | 7.50 (6.09, 9.72) | 7.50 (6.12, 10.42) | 0.283 |
| SCr | 0.77±0.12 | 0.51±0.08 | <0.001 |
| eGFR | 91.65±11.82 | 109.35±9.29 | <0.001 |
| UACR | 2.14 (1.37, 3.33) | 2.42 (1.53, 3.64) | <0.001 |
| Smoking | 0.303 | ||
| Now not | 7581 (84.3) | 405 (85.6) | |
| Occasionally | 241 (2.7) | 16 (3.4) | |
| Often | 1174 (13.1) | 52 (11.0) | |
| Drinking | 0.015 | ||
| Now not | 6511 (72.4) | 371 (78.4) | |
| Occasionally | 2011 (22.4) | 81 (17.1) | |
| Often | 474 (5.3) | 21 (4.4) | |
| Regular exercise | 1990 (22.1) | 81 (17.1) | 0.010 |
| Depressive Symptoms | 0.225 | ||
| PHQ<5 | 7672 (85.3) | 403 (85.2) | |
| 5≤PHQ<10 | 1107 (12.3) | 53 (11.2) | |
| PHQ≥10 | 217 (2.4) | 17 (3.6) | |
| Depressive Episode | 0.063 | ||
| No | 7793 (86.6) | 403 (85.2) | |
| Mild | 652 (7.2) | 29 (6.1) | |
| Severe | 551 (6.1) | 41 (8.7) | |
| DM | 2123 (23.6) | 138 (29.2) | 0.006 |
| HT | 3190 (35.5) | 216 (45.7) | <0.001 |
| CCVD | 401 (4.5) | 35 (7.4) | 0.003 |
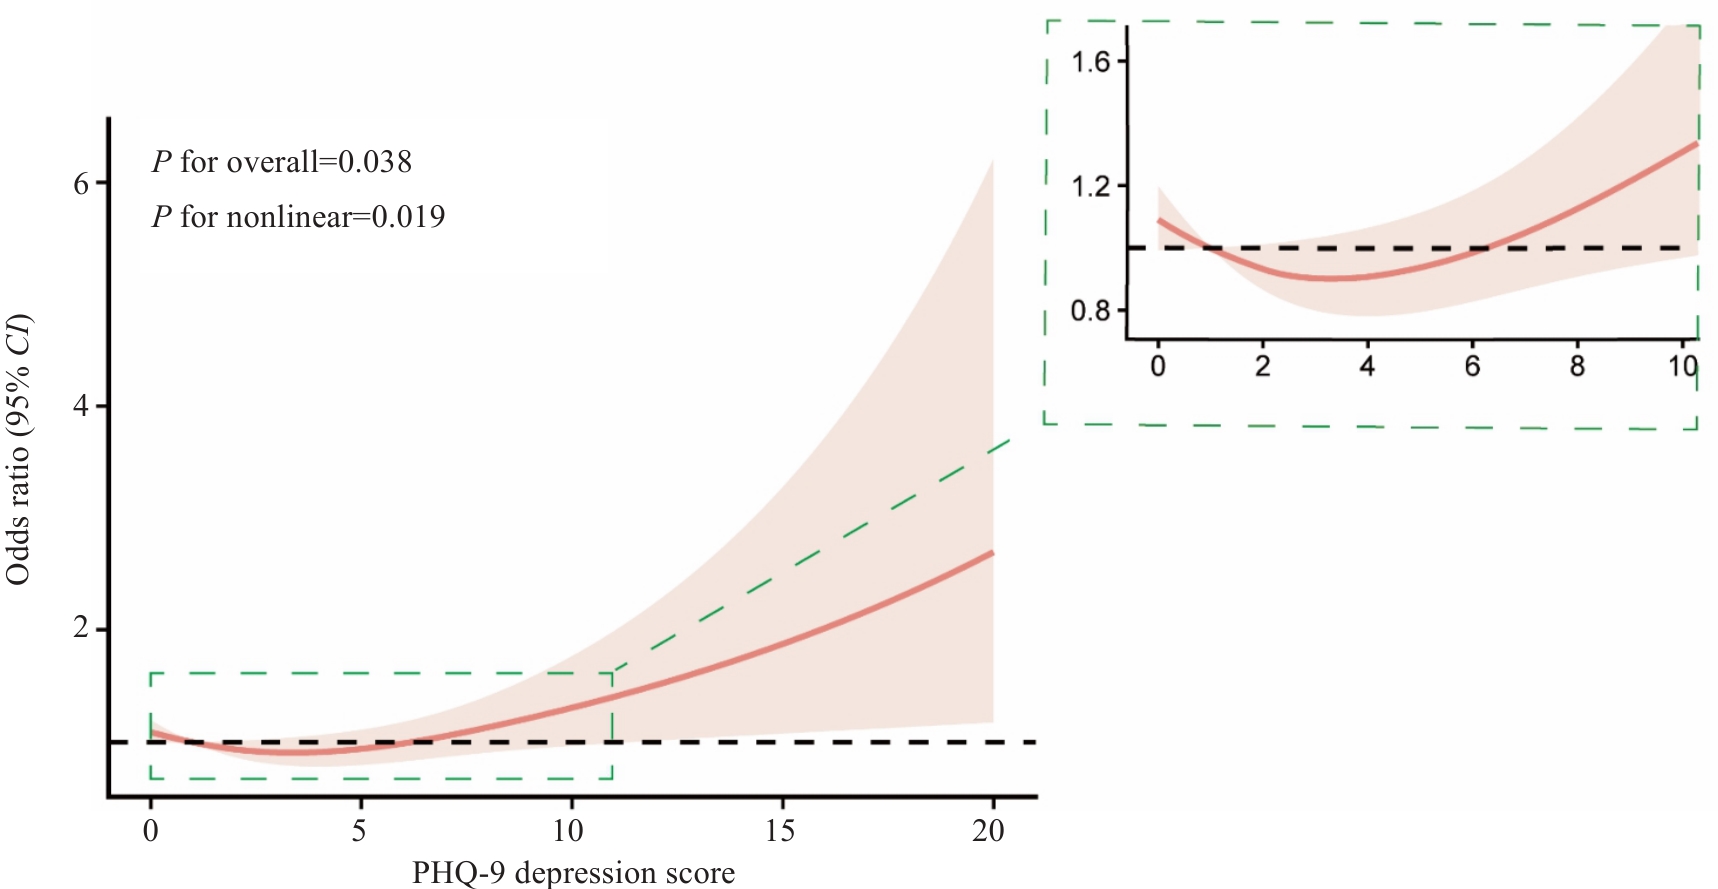
图2 抑郁症状与RHF限制性三次样条分析
Fig.2 Restricted cubic spline analysis of depressive symptoms and RHF.
| Variable | Model1 | Model2 | Model3 | Model4 | ||||
|---|---|---|---|---|---|---|---|---|
| OR (95% CI) | P | OR (95% CI) | P | OR (95% CI) | P | OR (95% CI) P | ||
| Depressive symptoms | ||||||||
| PHQ<5 | Ref. | Ref. | Ref. | Ref. | ||||
| 5≤PHQ<10 | 0.911 (0.680, 1.222) | 0.535 | 0.918 (0.684, 1.233) | 0.571 | 0.912 (0.679, 1.226) | 0.543 | 0.969 (0.711, 1.320) | 0.841 |
| PHQ≥10 | 1.491 (0.901, 2.468) | 0.120 | 1.548 (0.933, 2.567) | 0.091 | 1.556 (0.935, 2.587) | 0.089 | 1.854 (1.074, 3.201) | 0.027 |
| Depressive episode | ||||||||
| No | Ref. | Ref. | Ref. | Ref. | ||||
| Mild | 0.860 (0.585, 1.264) | 0.443 | 0.882 (0.599, 1.298) | 0.523 | 0.875 (0.594, 1.298) | 0.500 | 0.869 (0.576, 1.311) | 0.503 |
| Severe | 1.439 (1.032, 2.007) | 0.032 | 1.480 (1.059, 2.068) | 0.022 | 1.481 (1.059, 2.073) | 0.022 | 1.547 (1.082, 2.212) | 0.017 |
| Sensitivity analysis | ||||||||
| PHQ-9<10 | Ref. | Ref. | Ref. | Ref. | ||||
| PHQ-9≥10 | 1.508 (0.912, 2.493) | 0.109 | 1.565 (0.945, 2.592) | 0.082 | 1.575 (0.948, 2.615) | 0.079 | 1.864 (1.080, 3.210) | 0.025 |
表3 抑郁症状和抑郁发作与RHF相关性的logistic回归分析
Tab.3 Logistic regression analysis of correlation of depressive symptoms and depressive episodes with RHF
| Variable | Model1 | Model2 | Model3 | Model4 | ||||
|---|---|---|---|---|---|---|---|---|
| OR (95% CI) | P | OR (95% CI) | P | OR (95% CI) | P | OR (95% CI) P | ||
| Depressive symptoms | ||||||||
| PHQ<5 | Ref. | Ref. | Ref. | Ref. | ||||
| 5≤PHQ<10 | 0.911 (0.680, 1.222) | 0.535 | 0.918 (0.684, 1.233) | 0.571 | 0.912 (0.679, 1.226) | 0.543 | 0.969 (0.711, 1.320) | 0.841 |
| PHQ≥10 | 1.491 (0.901, 2.468) | 0.120 | 1.548 (0.933, 2.567) | 0.091 | 1.556 (0.935, 2.587) | 0.089 | 1.854 (1.074, 3.201) | 0.027 |
| Depressive episode | ||||||||
| No | Ref. | Ref. | Ref. | Ref. | ||||
| Mild | 0.860 (0.585, 1.264) | 0.443 | 0.882 (0.599, 1.298) | 0.523 | 0.875 (0.594, 1.298) | 0.500 | 0.869 (0.576, 1.311) | 0.503 |
| Severe | 1.439 (1.032, 2.007) | 0.032 | 1.480 (1.059, 2.068) | 0.022 | 1.481 (1.059, 2.073) | 0.022 | 1.547 (1.082, 2.212) | 0.017 |
| Sensitivity analysis | ||||||||
| PHQ-9<10 | Ref. | Ref. | Ref. | Ref. | ||||
| PHQ-9≥10 | 1.508 (0.912, 2.493) | 0.109 | 1.565 (0.945, 2.592) | 0.082 | 1.575 (0.948, 2.615) | 0.079 | 1.864 (1.080, 3.210) | 0.025 |
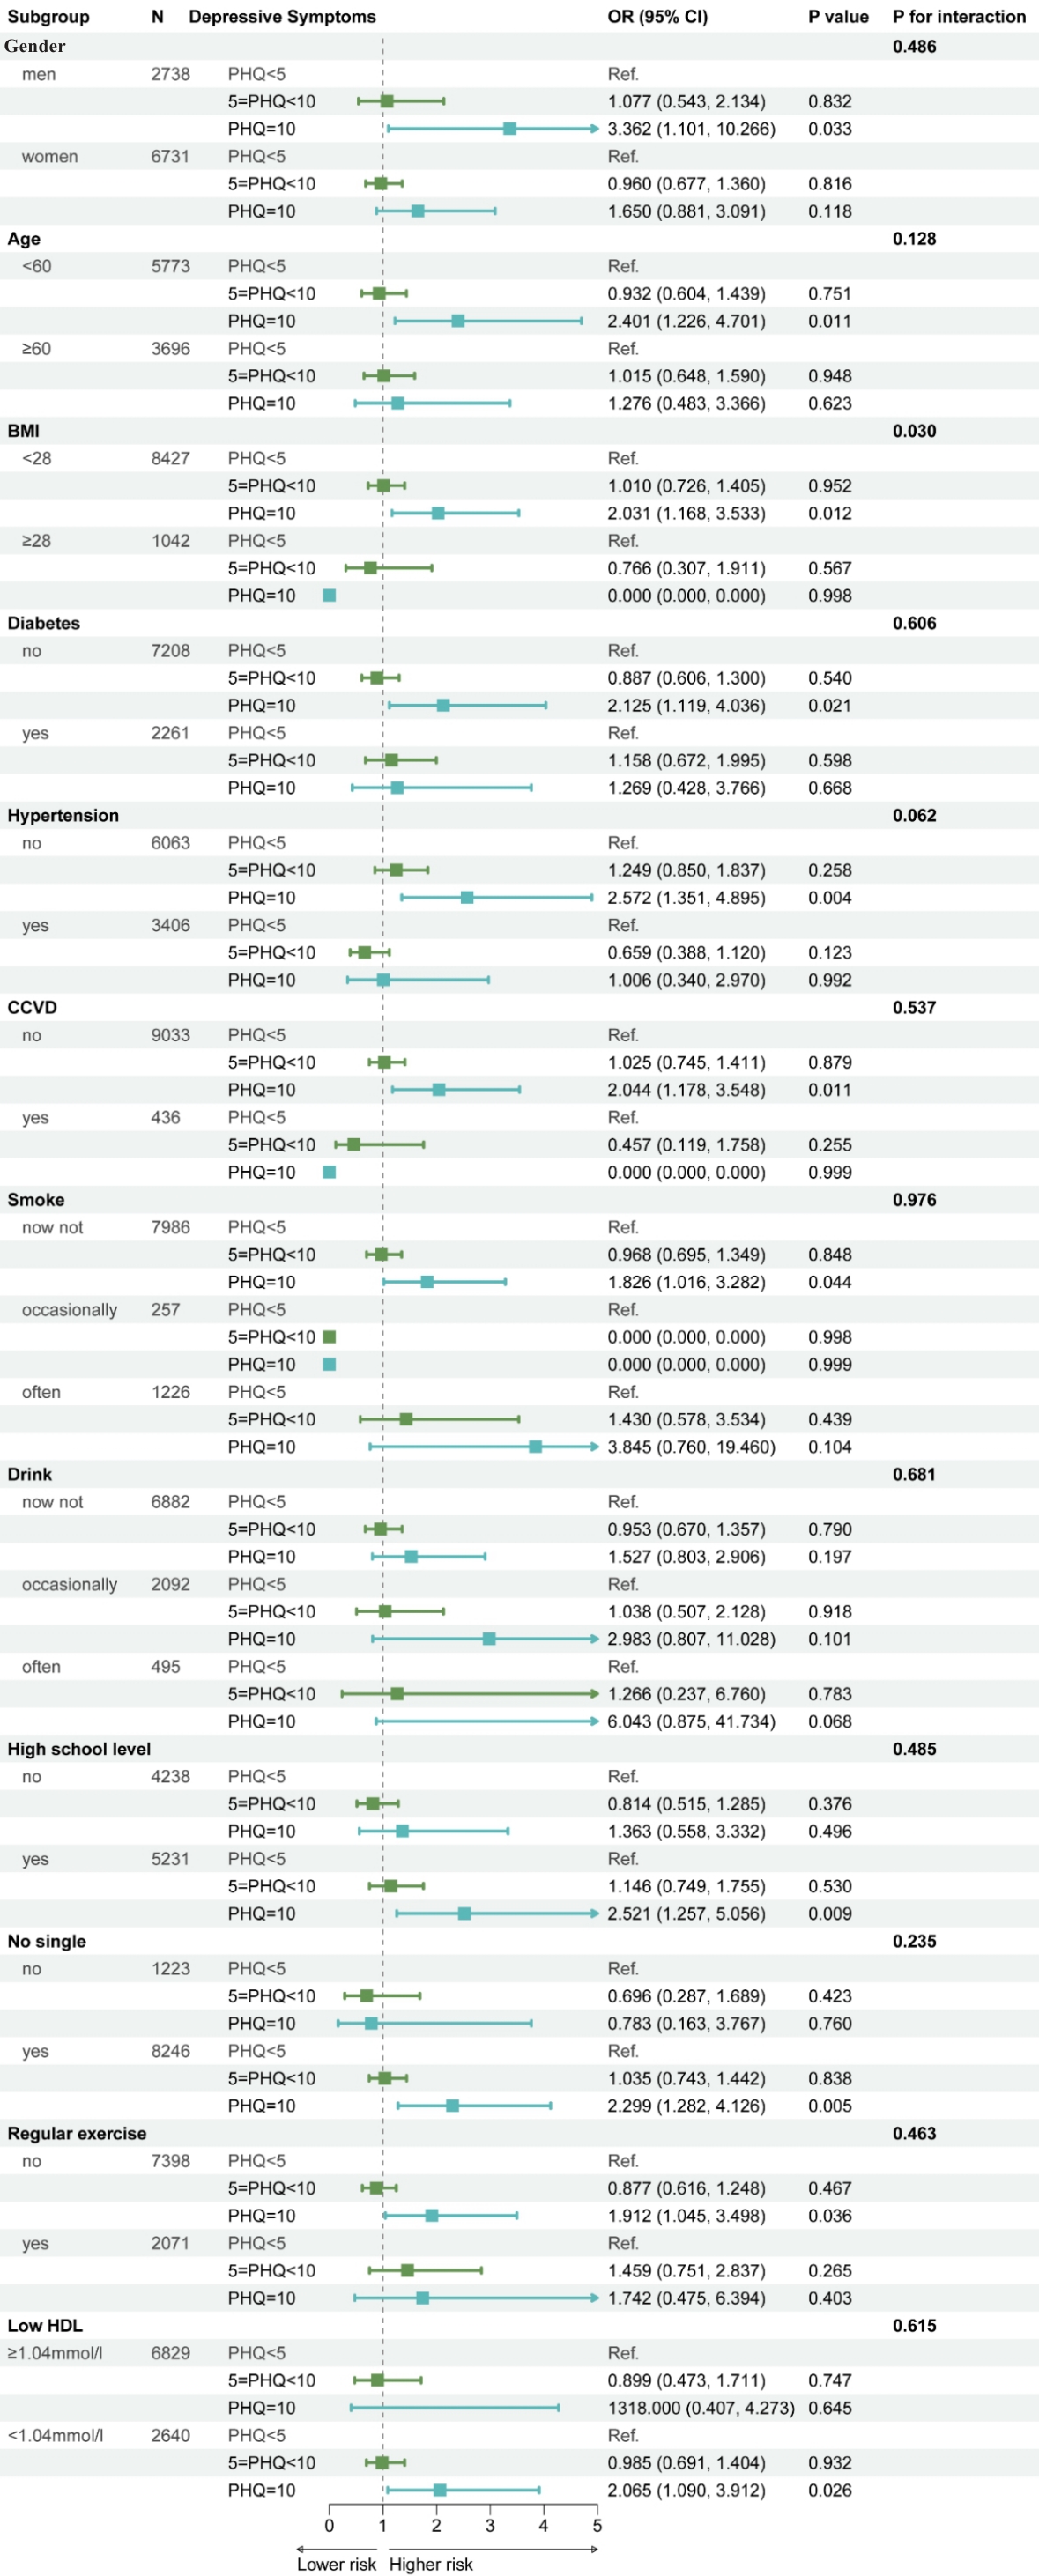
图3 抑郁症状亚组分析
Fig.3 Subgroup analysis of depressive symptoms.
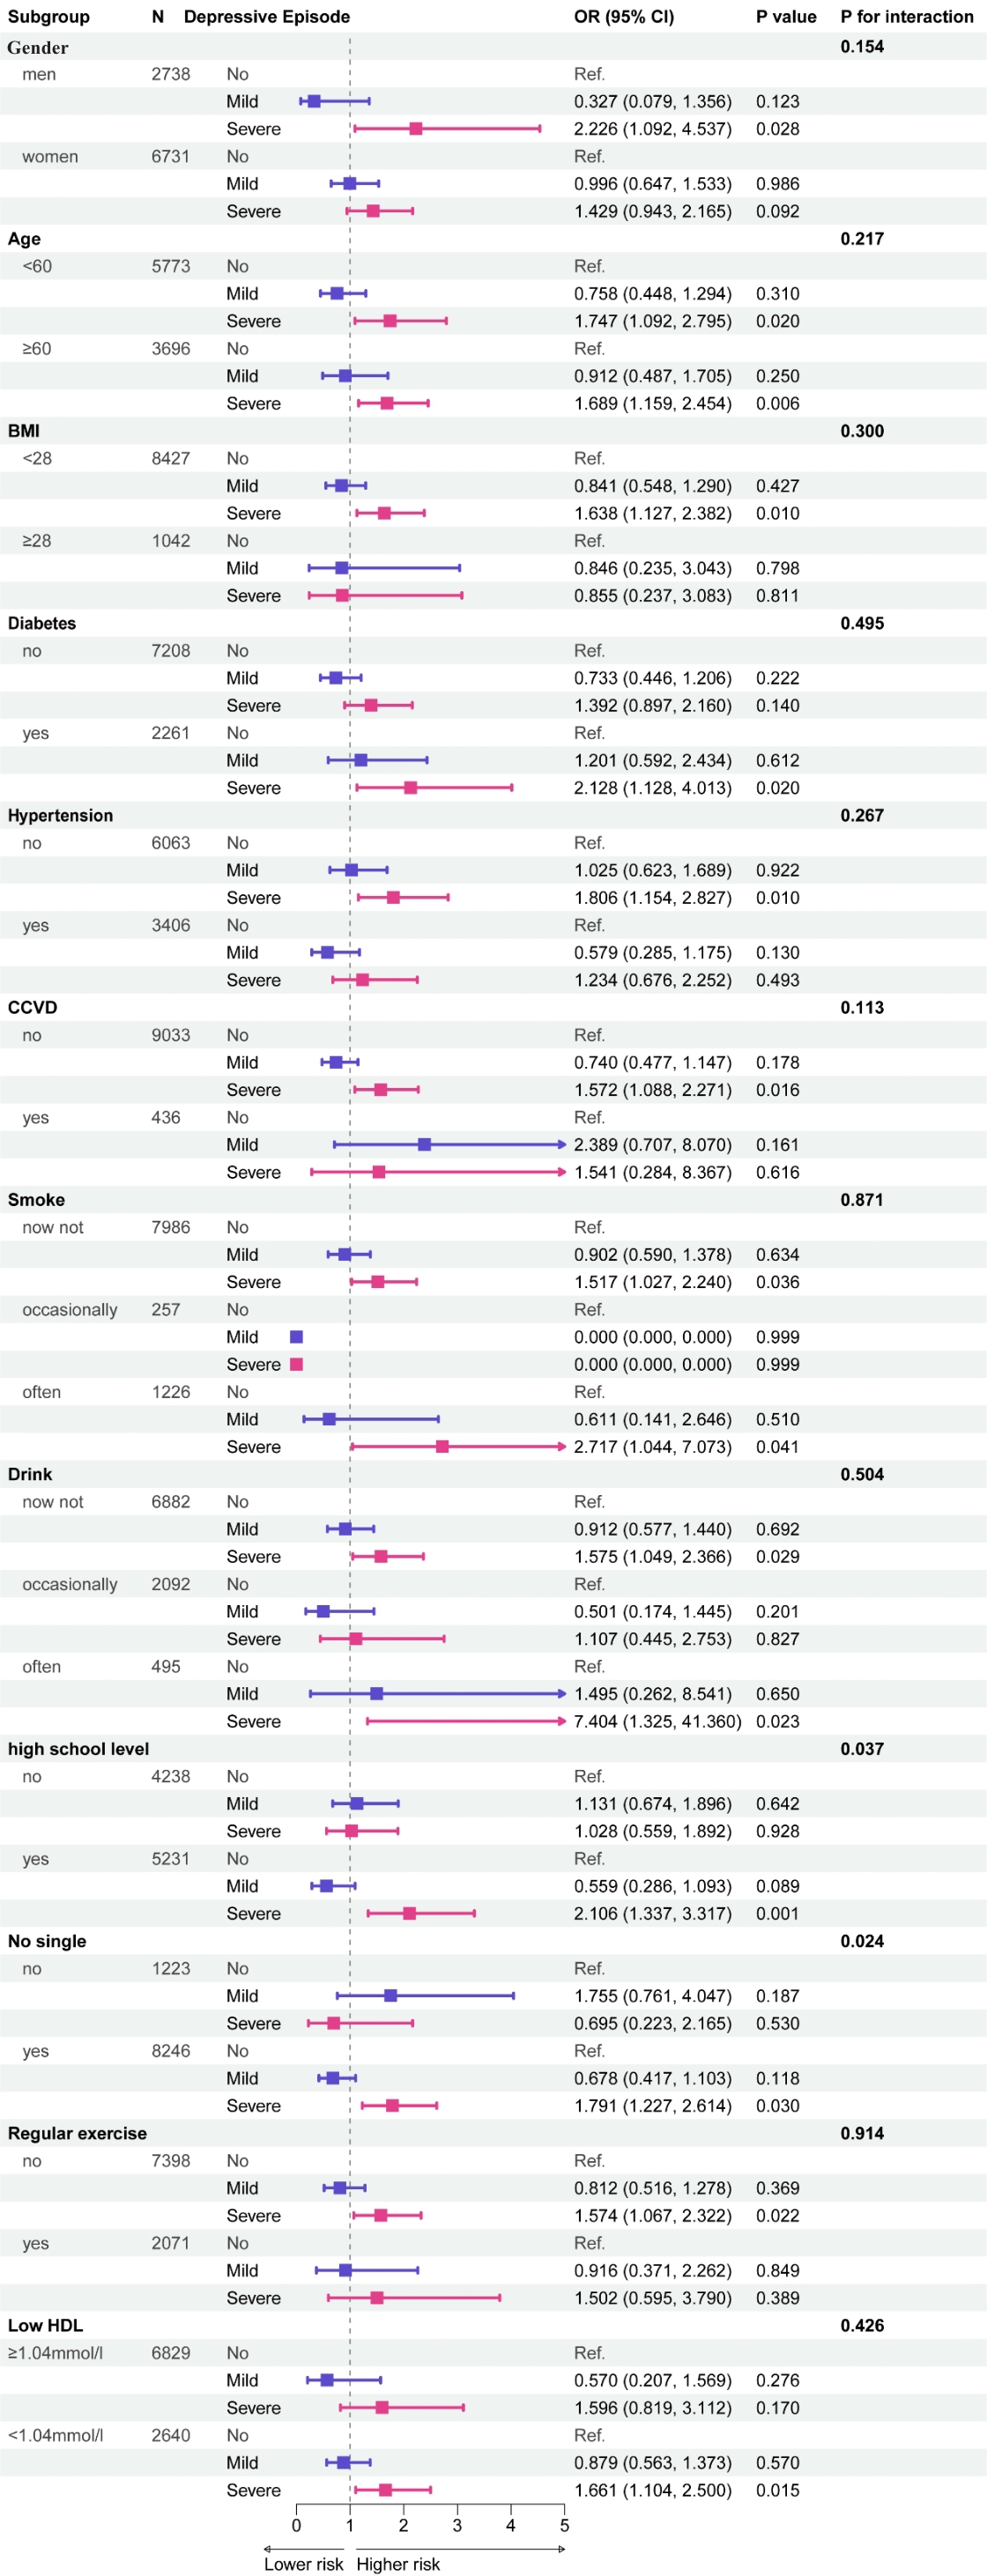
图4 抑郁发作亚组分析
Fig.4 Subgroup analysis of depressive episodes.
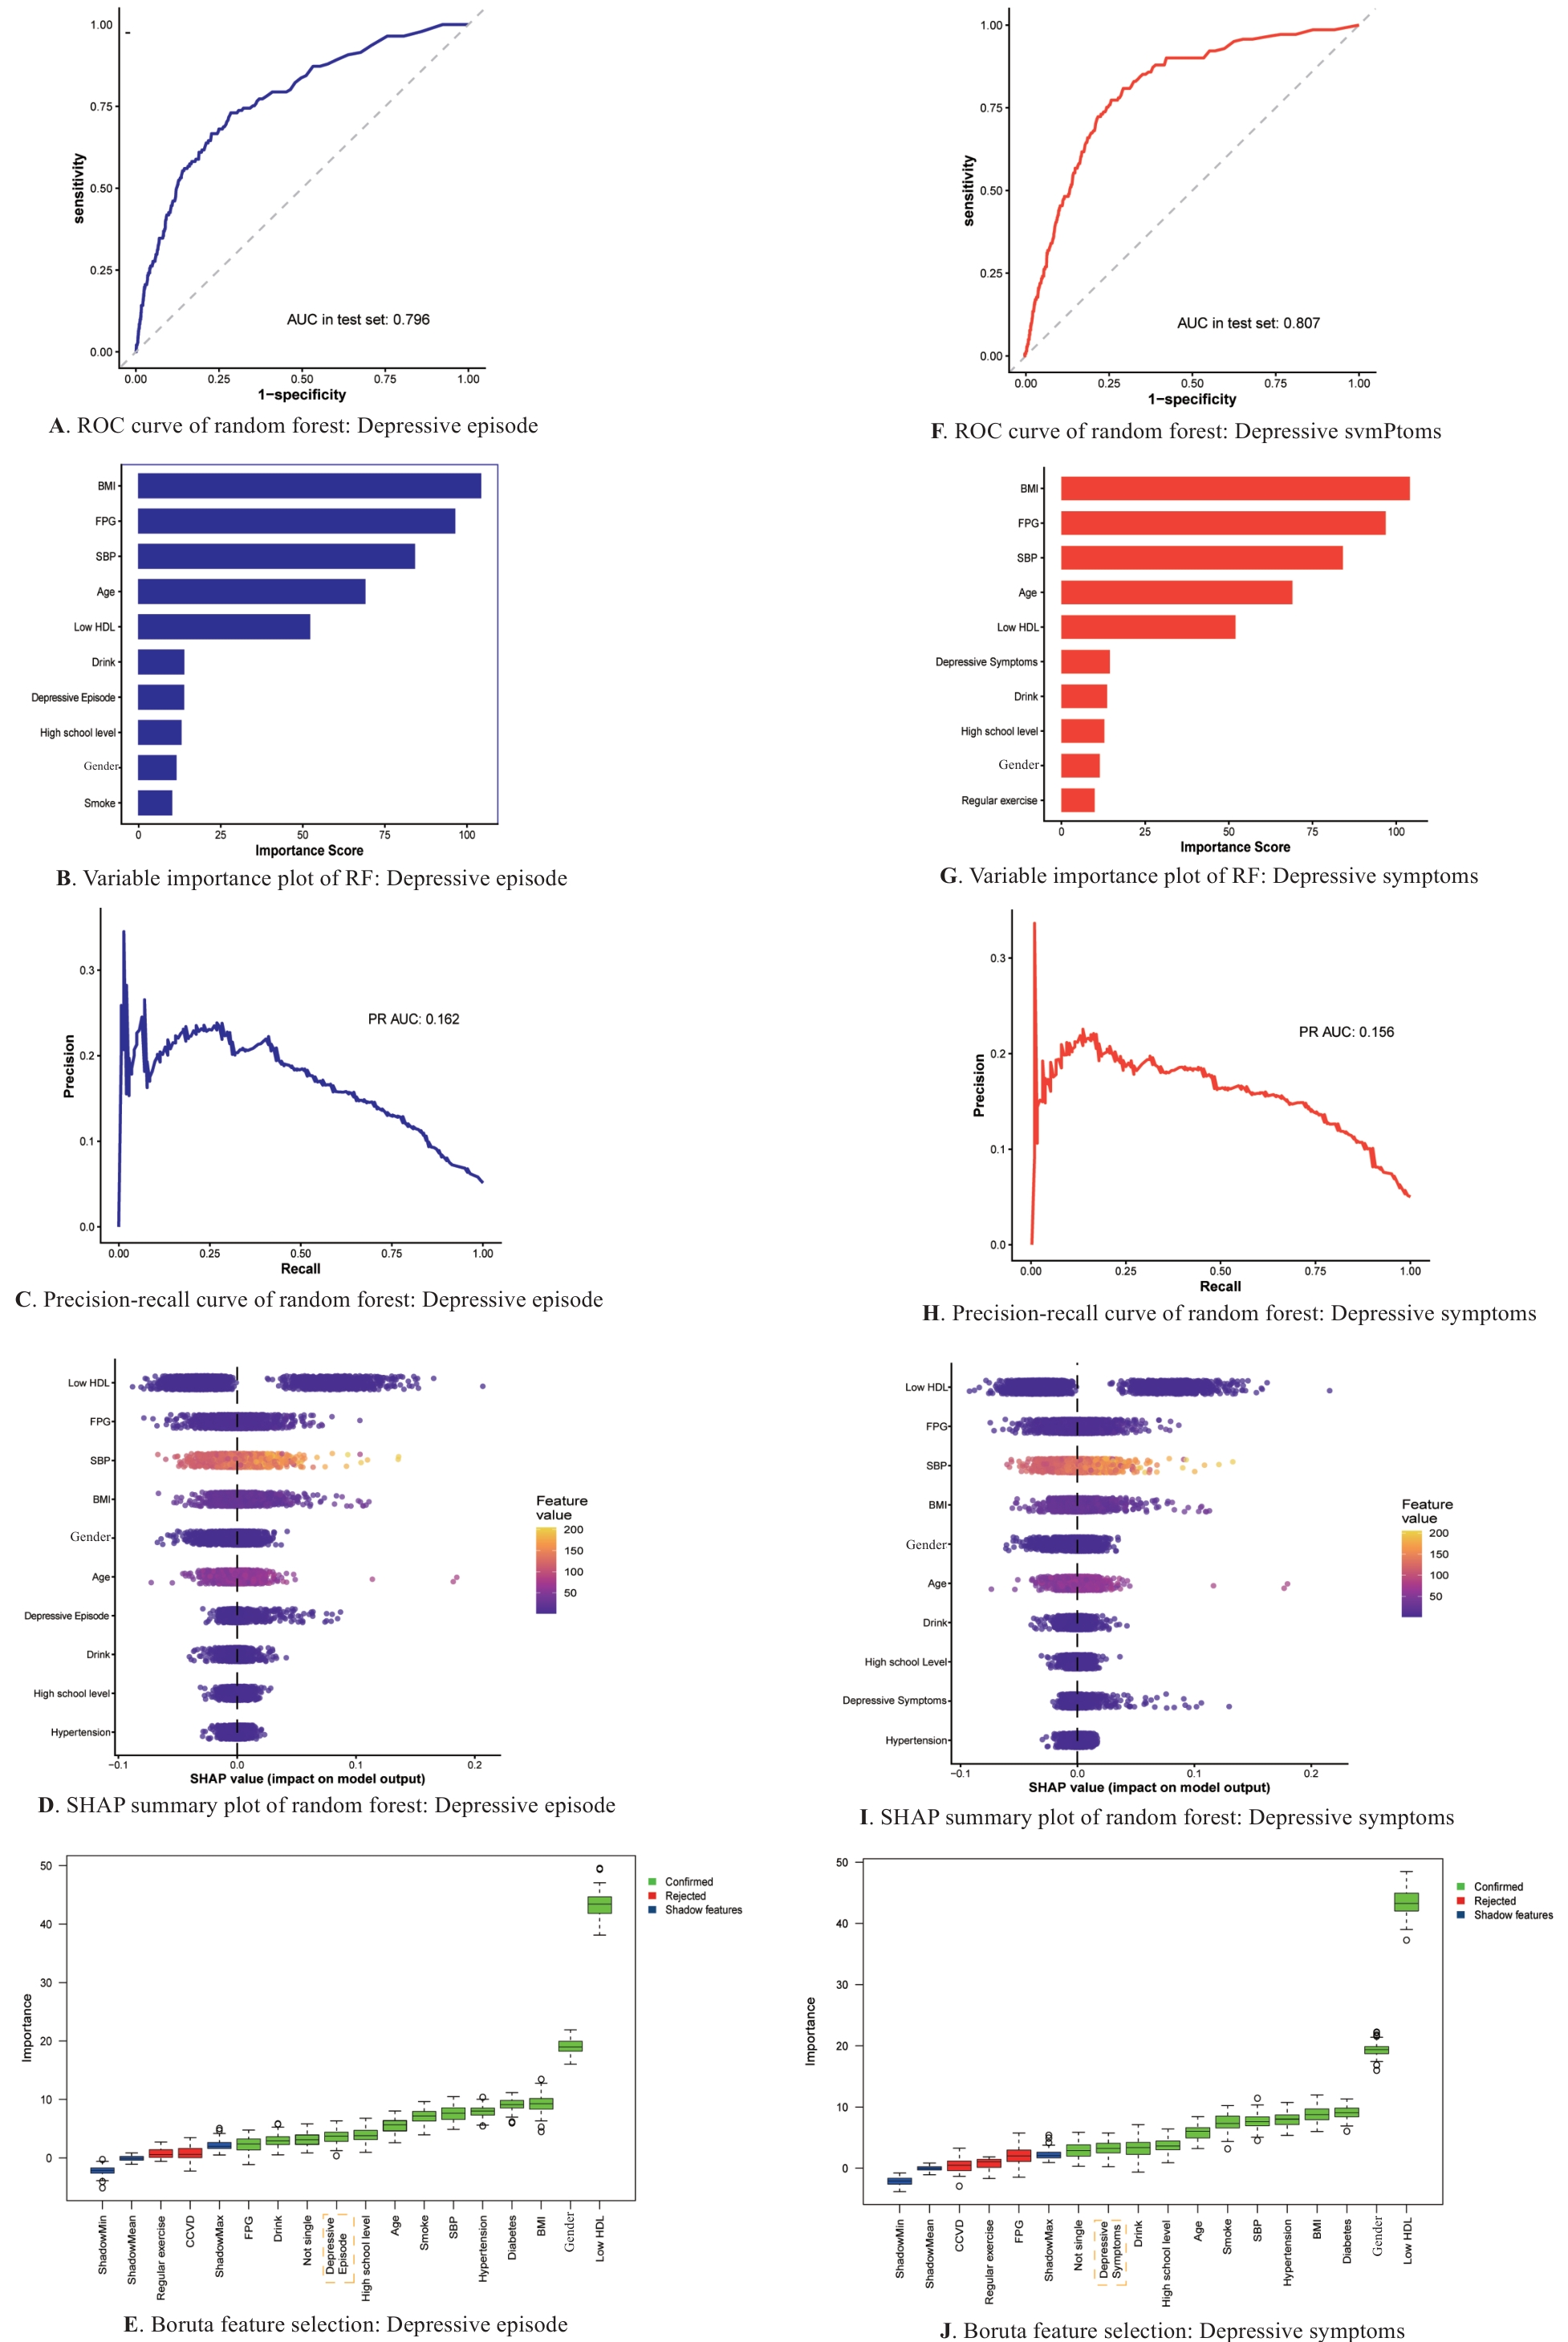
图5 基于机器模型识别RHF关键预测因子
Fig.5 Identification of key predictive factors for RHF based on machine learning models.
| [1] | Zenebe Y, Akele B, W/Selassie M, et al. Prevalence and determinants of depression among old age: a systematic review and meta-analysis[J]. Ann Gen Psychiatry, 2021, 20(1): 55. doi:10.1186/s12991-021-00375-x |
| [2] | Fan XW, Guo X, Ren Z, et al. The prevalence of depressive symptoms and associated factors in middle-aged and elderly Chinese people[J]. J Affect Disord, 2021, 293: 222-8. doi:10.1016/j.jad.2021.06.044 |
| [3] | Zhang XQ, Li ZY, Yu QQ, et al. Depressive trajectories and their associations with chronic diseases among older adults: a national longitudinal cohort study from China[J]. BMC Geriatr, 2025, 26(1): 72. doi:10.1186/s12877-025-06860-2 |
| [4] | Tian W, Yan GC, Xiong SZ, et al. Burden of depressive and anxiety disorders in China and its provinces, 1990–2021: findings from the Global Burden of Disease Study 2021[J]. Br J Psychiatry, 2026, 228(1): 18-28. doi:10.1192/bjp.2024.267 |
| [5] | Adejumo OA, Edeki IR, Sunday Oyedepo D, et al. Global prevalence of depression in chronic kidney disease: a systematic review and meta-analysis[J]. J Nephrol, 2024, 37(9): 2455-72. doi:10.1007/s40620-024-01998-5 |
| [6] | Cui XP, Zhang YS, Jin YJ, et al. Association of cardiometabolic index and depressive symptoms with cardiovascular and cerebrovascular diseases in middle-aged and older adults: a national prospective cohort study[J]. J Affect Disord, 2025, 391: 119940. doi:10.1016/j.jad.2025.119940 |
| [7] | Zeng J, Qiu YT, Yang CY, et al. Cardiovascular diseases and depression: a meta-analysis and Mendelian randomization analysis[J]. Mol Psychiatry, 2025, 30(9): 4234-46. doi:10.1038/s41380-025-03003-2 |
| [8] | Martens RJH, Kooman JP, Stehouwer CDA, et al. Albuminuria is associated with a higher prevalence of depression in a population-based cohort study: the Maastricht Study[J]. Nephrol Dial Transplant, 2018, 33(1): 128-38. doi:10.1093/ndt/gfw377 |
| [9] | Cortinovis M, Perico N, Ruggenenti P, et al. Glomerular hyperfiltration[J]. Nat Rev Nephrol, 2022, 18(7): 435-51. doi:10.1038/s41581-022-00559-y |
| [10] | Reboldi G, Verdecchia P, Fiorucci G, et al. Glomerular hyperfiltration is a predictor of adverse cardiovascular outcomes[J]. Kidney Int, 2018, 93(1): 195-203. doi:10.1016/j.kint.2017.07.013 |
| [11] | Lee SM, Park JY, Park MS, et al. Association of renal hyperfiltration with incident proteinuria-A nationwide registry study[J]. PLoS One, 2018, 13(4): e0195784. doi:10.1371/journal.pone.0195784 |
| [12] | Lin M, Huang HB, Yao J, et al. Association between depression and renal hyperfiltration in a general Chinese population[J]. Kidney Blood Press Res, 2019, 44(6): 1441-52. doi:10.1159/000503922 |
| [13] | 李亚茹, 丁钢强. 中老年人群中抑郁症患病率的地区差异性: 基于中国健康与养老追踪调查2011年基线数据的分析[C]//中国营养学会第十三届全国营养科学大会暨全球华人营养科学家大会论文汇编. 北京, 2017: 233. |
| [14] | 海志琴, 胡乃范, 李江平, 等. 2018年我国不同地区老年抑郁患病情况及影响因素分析[J]. 宁夏医科大学学报, 2023, 45(4): 412-7. |
| [15] | Ning G, Bloomgarden Z. Diabetes and cancer: findings from the REACTION study: REACTION[J]. J Diabetes, 2015, 7(2): 143-4. doi:10.1111/1753-0407.12240 |
| [16] | Levey AS, Stevens LA, Schmid CH, et al. A new equation to estimate glomerular filtration rate[J]. Ann Intern Med, 2009, 150(9): 604-12. doi:10.7326/0003-4819-150-9-200905050-00006 |
| [17] | Jhee JH, Kee YK, Park S, et al. High-protein diet with renal hyperfiltration is associated with rapid decline rate of renal function: a community-based prospective cohort study[J]. Nephrol Dial Transplant, 2020, 35(1): 98-106. doi:10.1093/ndt/gfz115 |
| [18] | Lin M, Su Q, Huang H, et al. Alcohol consumption and the risk for renal hyperfiltration in the general Chinese population[J]. Eur J Clin Nutr, 2017, 71(4): 500-5. doi:10.1038/ejcn.2016.168 |
| [19] | Lin M, Su Q, Wen JP, et al. Self-reported sleep duration and daytime napping are associated with renal hyperfiltration in general population[J]. Sleep Breath, 2018, 22(1): 223-32. doi:10.1007/s11325-017-1470-0 |
| [20] | Kroenke K, Spitzer RL, Williams JB. The PHQ-9: validity of a brief depression severity measure[J]. J Gen Intern Med, 2001, 16(9): 606-13. doi:10.1046/j.1525-1497.2001.016009606.x |
| [21] | Sheehan DV, Lecrubier Y, Sheehan KH, et al. The Mini-International Neuropsychiatric Interview (M.I.N.I.): the development and validation of a structured diagnostic psychiatric interview for DSM-IV and ICD-10[J]. J Clin Psychiatry, 1998, 59(): 22-33;quiz34-57. doi:10.1016/s0924-9338(99)80239-9 |
| [22] | Hernandez R, Xie DW, Wang X, et al. Depressive symptoms, antidepressants, and clinical outcomes in chronic kidney disease: findings from the CRIC study[J]. Kidney Med, 2024, 6(4): 100790. doi:10.1016/j.xkme.2024.100790 |
| [23] | Zhang F, Bai Y, Zhou R, et al. Association of depressive symptoms and incident chronic kidney disease in middle-aged and older adults[J]. Gen Hosp Psychiatry, 2024, 91: 122-9. doi:10.1016/j.genhosppsych.2024.10.012 |
| [24] | Han LY, Li YQ, Jiang ML, et al. Association of depressive symptom trajectories with chronic kidney disease in middle-aged and older adults[J]. J Psychosom Res, 2025, 189: 112036. doi:10.1016/j.jpsychores.2024.112036 |
| [25] | Liu MY, Zhang YJ, Yang SS, et al. Bidirectional relations between depression symptoms and chronic kidney disease[J]. J Affect Disord, 2022, 311: 224-30. doi:10.1016/j.jad.2022.05.104 |
| [26] | Korhonen PE, Ekblad MO, Kautiainen H, et al. Renal hyperfiltration revisited: Role of the individual body surface area on mortality[J]. Eur J Intern Med, 2023, 114: 101-7. doi:10.1016/j.ejim.2023.04.032 |
| [27] | Keller J, Gomez R, Williams G, et al. HPA axis in major depression: Cortisol, clinical symptomatology and genetic variation predict cognition[J]. Mol Psychiatry, 2017, 22(4): 527-36. doi:10.1038/mp.2016.120 |
| [28] | Schumann A, Andrack C, Bär KJ. Differences of sympathetic and parasympathetic modulation in major depression[J]. Prog Neuro Psychopharmacol Biol Psychiatry, 2017, 79: 324-31. doi:10.1016/j.pnpbp.2017.07.009 |
| [29] | Heigwer J, Steenbergen PJ, Gehrig J, et al. Corticosteroids alter kidney development and increase glomerular filtration rate in larval zebrafish (Danio rerio)[J]. Toxicol Sci, 2024, 201(2): 216-25. doi:10.1093/toxsci/kfae085 |
| [30] | Kurtz A. Renin release: sites, mechanisms, and control[J]. Annu Rev Physiol, 2011, 73: 377-99. doi:10.1146/annurev-physiol-012110-142238 |
| [31] | Mehdi S, Wani SUD, Krishna KL, et al. A review on linking stress, depression, and insulin resistance via low-grade chronic inflammation[J]. Biochem Biophys Rep, 2023, 36: 101571. doi:10.1016/j.bbrep.2023.101571 |
| [32] | van Agtmaal MJM, Houben AJHM, Pouwer F, et al. Association of microvascular dysfunction with late-life depression: a systematic review and meta-analysis[J]. JAMA Psychiatry, 2017, 74(7): 729. doi:10.1001/jamapsychiatry.2017.0984 |
| [33] | Seliger SL, Salimi S, Pierre V, et al. Microvascular endothelial dysfunction is associated with albuminuria and CKD in older adults[J]. BMC Nephrol, 2016, 17(1): 82. doi:10.1186/s12882-016-0303-x |
| [34] | Mas-Fontao S, Civantos E, Boukichou-Abdelkader N, et al. Oxidative stress and inflammation on metabolic abnormalities and renal involvement in prediabetic subjects across Europe[J]. Nefrología Engl Ed, 2025, 45(3): 238-48. doi:10.1016/j.nefro.2024.10.003 |
| [35] | Kanbay M, Copur S, Bakir CN, et al. Glomerular hyperfiltration as a therapeutic target for CKD[J]. Nephrol Dial Transplant, 2024, 39(8): 1228-38. doi:10.1093/ndt/gfae027 |
| [36] | Zheng XW, Wu WY, Shen SW. Prospective bidirectional associations between depression and chronic kidney diseases[J]. Sci Rep, 2022, 12: 10903. doi:10.1038/s41598-022-15212-8 |
| [37] | Zafrani L, Ince C. Microcirculation in acute and chronic kidney diseases[J]. Am J Kidney Dis, 2015, 66(6): 1083-94. doi:10.1053/j.ajkd.2015.06.019 |
| [38] | Marini S, Georgakis MK, Anderson CD. Interactions between kidney function and cerebrovascular disease: vessel pathology that fires together wires together[J]. Front Neurol, 2021, 12: 785273. doi:10.3389/fneur.2021.785273 |
| [39] | Kim DS, Kim SW, Gil HW. Emotional and cognitive changes in chronic kidney disease[J]. Korean J Intern Med, 2022, 37(3): 489-501. doi:10.3904/kjim.2021.492 |
| [40] | Gornostaeva E, Novikova M S, Beloborodova A V, et al. Autonomic imbalance in patients with metabolic syndrome: role in the development of hyperfiltration--an early marker of renal lesions[J]. Ter Arkh, 2010, 82(6):49-53. |
| [41] | Kim KY, Kim E. A troubled mind troubles the kidney: a brain-to-kidney axis[J]? Kidney Res Clin Pract, 2022, 41(6): 637-9. doi:10.23876/j.krcp.22.234 |
| [42] | Vitolo E, Santini E, Salvati A, et al. Metabolic and hormonal determinants of glomerular filtration rate and renal hemodynamics in severely obese individuals[J]. Obes Facts, 2016, 9(5): 310-20. doi:10.1159/000446965 |
| [43] | Kim CW, Chang Y, Sung E, et al. Sleep duration and quality in relation to chronic kidney disease and glomerular hyperfiltration in healthy men and women[J]. PLoS One, 2017, 12(4): e0175298. doi:10.1371/journal.pone.0175298 |
| [44] | Ho YF, Hsu PT, Yang KL. The mediating effect of sleep quality and fatigue between depression and renal function in nondialysis chronic kidney disease: a cross-sectional study[J]. BMC Nephrol, 2022, 23(1): 126. doi:10.1186/s12882-022-02757-z |
| [45] | Zha DQ, Gao P, Wu XY. Role of metabolic abnormalities during the progression of chronic kidney disease and preventive strategies[J]. Int J Med Sci, 2025, 22(14): 3543-55. doi:10.7150/ijms.114382 |
| [46] | Park H, Kang MK, Song TJ. Association of renal hyperfiltration with incidence of dyslipidemia: a nationwide retrospective longitudinal cohort study[J]. PLoS One, 2025, 20(6): e0324710. doi:10.1371/journal.pone.0324710 |
| [47] | Hu WW, Mao HP, et al. Systematic review and meta-analysis of the association between malnutrition and risk of depression in the elderly[J]. Alpha Psychiatry, 2024, 25(2): 183-9. doi:10.5152/alphapsychiatry.2024.231336 |
| [48] | Zhang JG, Wang ZH, Wang HJ, et al. Association between dietary patterns and blood lipid profiles among Chinese women[J]. Public Health Nutr, 2016, 19(18): 3361-8. doi:10.1017/s136898001600197x |
| [49] | Levis B, Benedetti A, Thombs BD. Accuracy of Patient Health Questionnaire-9 (PHQ-9) for screening to detect major depression: individual participant data meta-analysis[J]. Bmj, 2019: l1476. doi:10.1136/bmj.l1476 |
| [1] | 杨孟迪, 尹鸿涛, 甄洁玉, 丁雨露, 王玉洁, 孙琳楠, 何风英, 甄东户. 抑郁症状与肾功能快速下降及慢性肾脏病的发生无相关性[J]. 南方医科大学学报, 2023, 43(2): 225-231. |
| [2] | 王强梅, 甄洁玉, 关聪会, 赵 楠, 刘进进, 李红利, 傅松波, 汤旭磊, 韩艳萍, 苏 姗, 张 迪, 刘丽娟, 甄东户. 中老年人的糖代谢状态与慢性肾脏疾病的相关性[J]. 南方医科大学学报, 2020, 40(10): 1457-1464. |
| [3] | 黎明, 陈玉平. 对社区中老年人骨质疏松症自我效能与健康行为的调查[J]. 南方医科大学学报, 2005, 25(05): 552-553. |
| 阅读次数 | ||||||
|
全文 |
|
|||||
|
摘要 |
|
|||||
