2. 重庆医科大学附属第一医院重大代谢性疾病转化医学重点实验室,重庆 400016;
3. 重庆市巴南区人民医院临床营养科,重庆 401320
2. Chongqing Key Laboratory of Translational Medicine in Major Metabolic Diseases, First Affiliated Hospital of Chongqing Medical University, Chongqing 400016, China;
3. People's Hospital of Banan District, Chongqing 401320, China
近年来,肥胖症患病率在全球范围内呈不断上升趋势,已达到大流行水平[1],到2030年预计将有超过10亿人肥胖[2-3]。过量摄入高能量食物和久坐少动的生活方式是导致肥胖发生的主要原因[4]。下丘脑是调控食欲的重要部位,已有较多研究表明下丘脑神经元阿黑皮素原(POMC)激活有助于抑制过量进食,POMC mRNA表达减少可导致进食量增多[5-6]。神经元表达的POMC经蛋白酶裂解所生成的衍生肽α-促黑素细胞激素(α-MSH)具有抑制食欲的作用。有研究表明,胰岛素通过与下丘脑POMC神经元胰岛素受体结合,激活其下游磷酸化蛋白激酶(p-AKT)信号途径;瘦素也可与POMC神经元瘦素受体启动其下游转录激活子3磷酸化(pSTAT3)及细胞因子传导抑制因子3(SOCS3)信号途径;上述两条通路均与下丘脑神经元食欲抑制有关[7-8]。因此,POMC神经元的激活使POMCmRNA表达增加促进α-MSH衍生肽释放是下丘脑调节食欲的关键机制之一[9-10]。下丘脑神经元细胞系GT1-7细胞来源于小鼠下丘脑,可表达抑制食欲POMC衍生肽,促食欲衍生肽(NPY)和AgRP等食欲调节因子[11],因此该细胞常用于下丘脑能量代谢和食欲相关研究[12]。胆汁酸作为一种肠肝循环中的营养信号分子也可参与食物摄入和能量代谢的调节,其中初级胆汁酸鹅去氧胆酸(CDCA)和次级胆汁酸牛磺石胆酸(tLCA)可通过血脑屏障到达脑组织[13],通过G蛋白偶联胆汁酸受体(TGR5)及法呢醇X受体(FXR)参与调控能量和维持血糖平衡[14-15],并有研究表明血浆胆汁酸水平与体重具有相关性,且肥胖患者血清胆汁酸含量越能防止过度进食[16],提示胆汁酸与食欲存在一定相关性。胆汁酸是否具有抑制食欲的作用尚不清楚,本研究拟探讨tLCA或CDCA对下丘脑神经元食欲抑制衍生肽的调节特点及作用机制,为肥胖防治提供新思路。
1 材料和方法 1.1 细胞小鼠下丘脑神经元细胞系(GT1-7)购买自美国细胞库ATCC。
1.2 主要试剂DMEM高糖培养基和胎牛血清(Gibco),Realtime PCR引物序列由擎科公司合成。RNA提取试剂盒,逆转录试剂盒和Real-time反应试剂盒(Roche),小鼠α黑色素细胞激素ELISA试剂盒(华美)。蛋白提取试剂盒(Roche),Western blot凝胶配置试剂盒(Bio-Rad),PVD膜(Millipore),BCA试剂盒(碧云天)。小鼠来源的β-actin抗体(Proteintech),兔源p-STAT3抗体、鼠源STAT3抗体、兔源p-AKT抗体和兔源AKT抗体均(CST),兔来源的SOCS3抗体兔源TGR5抗体和兔源FXR(Abcam)。tLCA和CDCA(Sigma)。
1.3 tLCA和CDCA配制tLCA和CDCA分别溶于DMSO中,再用含10%胎牛血清高糖培养基稀释至10 nmol/L,100 nmol/L,1 μmol/L,10 μmol/L浓度分装放置于-20 ℃冰箱。
1.4 GT1-7细胞培养与分组处理GT1-7细胞采用含10%胎牛血清高糖培养基进行培养,生长融合度达到80%后用高温灭菌PBS轻柔清洗3次,胰酶消化细胞至漂浮,高糖培养基终止消化收集细胞,离心(室温,1000 g/min,3 min)弃去上清,用含10% DMSO+20%胎牛血清高糖培养基重悬细胞沉淀,梯度降温放置液氮冻存。10%胎牛血清高糖培养GT1-7细胞生长至80%时,消化收集细胞传代,以5×10⁵密度种6孔板,培养至细胞贴壁分别给予10 nmol/L,100 nmol/L,1 μmol/L,10 μmol/L浓度的tLCA或CDCA处理12,24和48 h,分别为tLCA组和CDCA组。空白对照组仅给予含10%胎牛血清高糖培养基,每组设3个平行样。
1.5 Real-time PCR检测POMCmRNA表达水平3个分组分别提取细胞RNA,测量浓度取1000 ngRNA量逆转录成cDNA,用于检测POMC mRNA表达水平。将cDNA稀释10倍后取2.5 μL,DEPC水1.5 μL,引物1 μL(30 μmol/L上、下引物各0.5 μL)及荧光染料SYBR 5 μL进行PCR反应检测目标基因的表达水平,扩增体系为10 μL,扩增反应程序按照RocheReal-time反应试剂盒设置。所用引物序列见表 1,每个样品设置3个平行样。引物序列为:小鼠GAPDH上游引物序列AGGTCGGTGTGAACGGA TT,下游引物序列TGTAGACCATGTAGTTGAGGT CA;小鼠POMC上游引物序列ATGCCGAGATTCTG CTACAGT,下游引物序列TCCAGCGAGAGGTCGA GTTT。
1.6 Western blot检测TGR5,FXR,p-STAT3,p-AKT和SOCS3蛋白水平将5×10⁵个细胞种于6孔板中,设置相同实验组以10 μmol/L浓度处理24 h后提蛋白。BCA法测定蛋白浓度,取20 μg蛋白上样量,10%SDS-PAGE胶120 V电泳90 min使胶分离后,再将蛋白在电转条件(4 ℃,250 mA,90 min)下转至PVDF膜上,TBST洗膜(10 min× 3次),5%脱脂奶粉室温封闭1 h,TBST洗膜(10 min×3次),一抗4 ℃摇床孵育过夜。抗体使用浓度如下:β-actin(鼠,1:10000),FXR(兔,1:2000),TGR5(兔,1: 2000),p-STAT3(兔,1:1000),STAT3(鼠,1:1000),pAKT(兔,1:1000),AKT(兔,1:1000),SOCS3(兔,1: 1000)。回收一抗,TBST洗膜(10 min×3次),常温孵育对应二抗(1:5000)1 h后TBST洗膜(10 min×3次),发光成像,ImageJ定量分析。
1.7 ELISA试剂盒检测细胞培养上清液α-MSH水平将5×10⁵细胞接种于6孔板中,同样设置各组,以10 μmol/L的浓度tLCA或CDCA分别处理细胞24 h后,取培养基在4 ℃,1000 g离心15 min后取上清。按照小鼠α黑色素细胞激素ELISA试剂盒检测方法检测α-MSH含量,简略方法如下:分别设置标准孔和待测样本孔,每孔加样100 μL,轻晃摇匀,37 ℃温育2 h后弃去液体甩干,每孔加生物素标记抗体工作液100 μL,37 ℃温育1 h后弃去液体甩干,洗板3次。每孔加辣根过氧化物酶标记亲和素工作液100 μL,37 ℃孵育1 h后弃液体甩干清洗5次,依序加入底物溶液90 μL,37 ℃避光显色15~30 min,依序加入终止液50 μL终止反应,5 min内用酶标仪在450 nm波长测A值,重复实验3次。
1.8 统计学处理所有数据以均数±标准误表示,采用单因素方差分析进行组间比较,两两比较采用LSD,采用SPSS25.0统计软件进行分析,P < 0.05为差异有统计学差异。
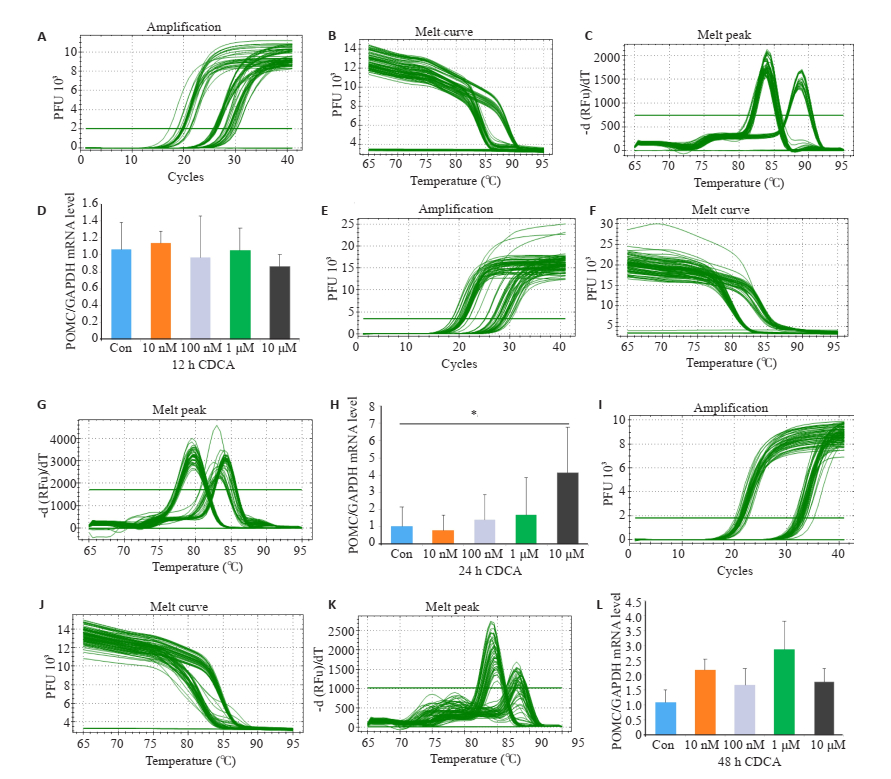
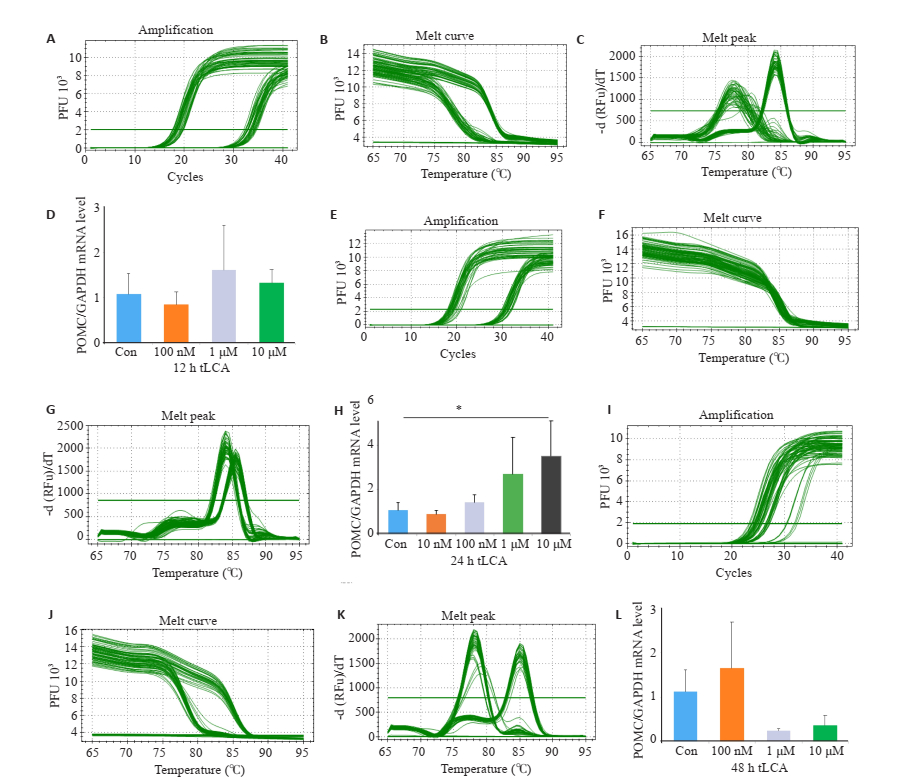
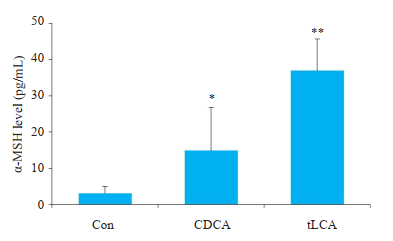
2 结果 2.1 胆汁酸处理对GT1-7细胞食欲调节肽表达的影响与空白对照组相比,10 μmol/L浓度CDCA处理24 h使GT1-7细胞POMC mRNA水平增高(P < 0.05);同样,10 μmol/L浓度tLCA处理24 h使GT1-7细胞POMC mRNA水平增高(P < 0.05,图 1~2)。通过ELISA检测GT1-7细胞培养上清液中α-MSH水平发现,与空白对照组和10 μmol/LCDCA处理24 h相比,10 μmol/L tLCA处理24 h显著提高细胞α-MSH生成(P < 0.01,P < 0.05,图 3)。
|
图 1 Real-time PCR检测不同浓度CDCA和不同处理时间对GT1-7细胞POMC mRNA表达的影响 Fig.1 Relative expression of POMC in GT1-7 cells after treatment with CDCA detected by RT-qPCR. The amplification (A), melt curve (B) and melt peak (C) after treated with 12 h CDCA was detected by RT-qPCR; The amplification (E), melt curve (F) and melt peak (G) after treated with 24 h CDCA was detected by RT-qPCR; The amplification (I), melt curve (J) and melt peak (K) after treated with 48 h CDCA was detected by RTqPCR; respectively; (D, H, L) Expression of POMC in GT1-7 cells after treated with CDCA(*P < 0.05, n=3). |
|
图 2 Real-time PCR检测不同浓度tLCA和不同处理时间对GT1-7细胞POMC mRNA表达的影响 Fig.2 Relative expression of POMC in GT1-7 cells after treatment with tLCA detected by RT-qPCR. The amplification (A), melt curve (B) and melt peak (C) after treated with 12 h tLCA was detected by RT-qPCR; The amplification (E), melt curve (F) and melt peak (G) after treated with 24 h tLCA was detected by RT-qPCR; The amplification (I), melt curve (J) and melt peak (K) after treated with 48 h tLCA was detected by RT-qPCR; respectively; (D, H, L) Expression of POMC inGT1-7 cells after treated with CDCA(*P < 0.05, n=3). |
|
图 3 ELISA检测GT1-7细胞α-MSH水平 Fig.3 Level of α-MSH measured in GT1-7 cells by ELISA. n=3, *P < 0.05, **P < 0.01 vs Con. |
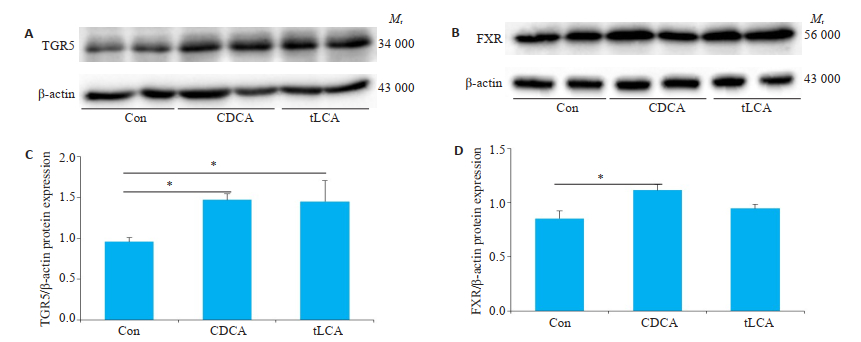
Western blot检测结果显示,GT1-7细胞均表达两类胆汁酸受体TGR5和FXR。与空白对照组相比,10 μmol/L tLCA或CDCA处理24 h会明显增加TGR5受体表达水平(P < 0.05),而FXR受体表达只会在10 μmol/L CDCA干预24 h有明显增加(P < 0.05,图 4)。
|
图 4 Western blot检测不同处理对GT1-7细胞TGR5和FXR受体表达水平的影响 Fig.4 Levels of TGR5 and FXR in GT1-7 cells treated with bile acids detected by Western blot. A, C: expression of TGR5 and FXR proteins after 24 h of bile acids treatment of GT1-7 cells; B, D: Grayscale analysis of Figure A, C. β-actin is an internal reference. n=3, *P < 0.05. |
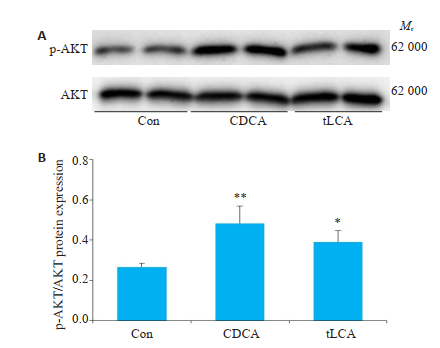
通过Western blot检测GT1-7细胞磷酸化AKT水平发现,10 μmol/LtLCA或CDCA分别处理24 h,GT1-7细胞p-AKT水平显著增高(P < 0.05,P < 0.01,图 5)。
|
图 5 Western blot检测不同处理对GT1-7细胞p-AKT水平的影响 Fig.5 Level of p-AKT in GT1-7 cells treated with bile acids for 24 h were detected by Western blot. A: Expression of pAKT protein after 24 h of bile acids treatment of GT1-7 cells; B: Grayscale analysis of FigureA. n=3, *P < 0.05, **P < 0.01. |
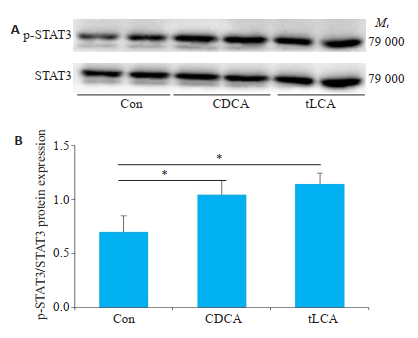
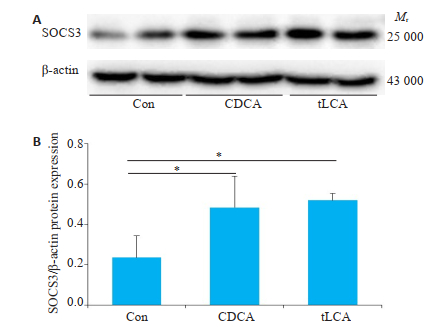
与空白对照组相比,10 μmol/LtLCA或CDCA分别处理GT1-7细胞24 h后,明显促进p-STAT3和SOCS3蛋白表达(P < 0.05,图 6~7)。
|
图 6 Western blot检测不同处理对GT1-7细胞p-STAT3水平的影响 Fig.6 Level of p-STAT3 in GT1-7 cells treated with bile acids were detected by Western blot. A: expression of p-STAT3 protein after 24 h of bile acids treatment of GT1-7 cells; B: grayscale analysis of FigureA. n=3, *P < 0.05. |
|
图 7 Western blot检测不同处理对GT1-7细胞SOCS3水平的影响 Fig.7 Level of SOCS3 in GT1-7 cells treated with bile acids were detected by Western blot. A: expression of SOCS3 protein after 24 h of bile acids treatment of GT1-7 cells; B: grayscale analysis of Figure A. β-actin is an internal reference. n=3, *P < 0.05. |
大脑信号传递功能障碍是肥胖发生的重要因素,其中下丘脑富集调控食欲和能量稳态的神经元,包括具有抑制食欲功能的POMC神经元和促进食欲的NPY和AGRP神经元[17-18]。研究表明胆汁酸可以作为一种内源性代谢物通过激活TGR5信号通路作用于下丘脑神经元调节食欲[19],可通过中枢神经系统作用调节改善机体物质代谢。其中POMC神经元释放的α-MSH是重要的食欲抑制因子,受瘦素、胰岛素等激素水平调节。研究表明下丘脑神经元GT1-7细胞能够明显受到胰岛素或瘦素影响调节相关食欲肽表达调控食欲[20]。本次实验中发现两种胆汁酸CDCA或tLCA均能促进GT1-7细胞抑制食欲肽POMCmRNA表达,ElISA结果也证实POMC翻译后剪切产物促黑素细胞激素α-MSH释放增多,该作用与瘦素介导的下丘脑PMOC神经元激活[21-22]类似。研究证明POMC神经元表达瘦素受体和胰岛素受体,瘦素与下丘脑POMC神经元瘦素受体结合并激活p-STAT3途径抑制食欲[23-24],同时促进STAT3磷酸化的反馈抑制途径SOCS3蛋白的表达[25-26]。本实验通过Western blot结果显示胆汁酸tLCA或CDCA处理GT1-7细胞也会激活抑制食欲的p-STAT3蛋白表达,STAT3信号通路负反馈分子SOCS3蛋白表达也有增加。这个结果提示胆汁酸处理GT1-7细胞激活POMCmRNA抑制食欲也可能是通过激活p-STAT3-SOCS3通路实现的。另有研究表明下丘脑POMC神经元也受胰岛素调节,胰岛素通过激活胰岛素受体底物IRS-2与PI3K信号途径,从而促进Akt的Ser473磷酸化以调节葡萄糖代谢和食欲[27-28]。同样,本研究结果显示胆汁酸tLCA或CDCA处理GT1-7细胞24 h后,激活了p-AKT信号分子,提示胆汁酸也可能通过p-AKT途径调节食欲肽的表达。
目前已发现了两类胆汁酸受体,分别是核受体FXR和跨细胞膜的G蛋白偶联受体TGR5。不同胆汁酸分子与两类受体亲和度存在差异,一般认为CDCA与FXR亲和度最高,而LCA与TGR5亲和度最高[29-30]。本次实验结果表明GT1-7细胞均表达两类胆汁酸受体且受胆汁酸调节。进一步比较tLCA或CDCA对GT1-7细胞POMC mRNA表达和α-MSH释放水平发现,胆汁酸tLCA的作用更为显著,即TGR5可能是介导胆汁酸调节食欲肽表达发挥主要作用的胆汁酸受体。
综上所述,胆汁酸tLCA或CDCA可能通过与胆汁酸受体TGR5和FXR结合调节下丘脑神经元抑制食欲肽的合成和分泌,从而发挥减少进食预防肥胖的作用。该效应可能是通过激活瘦素信号通路关键分子pSTAT3-SOCS3或胰岛素信号通路p-AKT的表达实现的。限于本次实验仅从体外细胞模型探讨胆汁酸对调控食欲功能肽的影响,进一步阐明该作用机制与瘦素和胰岛素信号通路的相互作用尚需更多整体动物模型加以证实。
| [1] |
Blüher M. Obesity: global epidemiology and pathogenesis[J]. Nat Rev Endocrinol, 2019, 15(5): 288-98. DOI:10.1038/s41574-019-0176-8 |
| [2] |
Seidell JC, Halberstadt J. The global burden of obesity and the challenges of prevention[J]. Ann Nutr Metab, 2015, 66(Suppl 2): 7-12. |
| [3] |
Kelly T, Yang W, Chen CS, et al. Global burden of obesity in 2005 and projections to 2030[J]. Int J Obes (Lond), 2008, 32(9): 1431-7. DOI:10.1038/ijo.2008.102 |
| [4] |
Robertson SH, Rasmussen EB. High-fat diet alters weight, caloric intake, and haloperidol sensitivity in the context of effort-based responding[J]. Behav Pharmacol, 2017, 28(5): 323-33. DOI:10.1097/FBP.0000000000000295 |
| [5] |
Zhan C, Zhou J, Feng Q, et al. Acute and Long-Term suppression of feeding behavior by POMC neurons in the brainstem and hypothalamus, respectively[J]. J Neurosci, 2013, 33(8): 3624-32. DOI:10.1523/JNEUROSCI.2742-12.2013 |
| [6] |
Razolli DS, de Araújo TM, Sant Apos Ana MR, et al. Proopiomelanocortin processing in the hypothalamus is directly regulated by saturated fat: Implications for the development of obesity[J]. Neuroendocrinology, 2020, 110(1-2): 92-104. DOI:10.1159/000501023 |
| [7] |
Barrios-Correa AA, Estrada JA, Martel C, et al. Chronic intake of commercial sweeteners induces Changes in feeding behavior and signaling pathways related to the control of appetite in BALB/c mice[J]. Biomed Res Int, 2018, 3628121. |
| [8] |
Jian Q, Zhang CG, Borgquist A, et al. Insulin excites anorexigenic proopiomelanocortin neurons via activation of canonical transient receptor potential channels[J]. Cell Metab, 2014, 19(4): 682-93. DOI:10.1016/j.cmet.2014.03.004 |
| [9] |
Zhan C. POMC neurons: feeding, energy metabolism, and beyond[J]. Adv Exp Med Biol, 2018, 1090: 17-29. |
| [10] |
Toda C, Santoro A, Kim JD, et al. POMC neurons: from birth to death [J]. 2017, 79: 209-36.
|
| [11] |
Deng J, Yuan F, Guo Y, et al. Deletion of ATF4 in AgRP neurons promotes fat loss mainly via increasing energy expenditure[J]. Diabetes, 2017, 66(3): 640-50. |
| [12] |
Cortes-Campos C, Elizondo R, Claudio C, et al. MCT2 expression and lactate influx in anorexigenic and orexigenic neurons of the arcuate nucleus[J]. PLoS One, 2013, 8(4): e62532. DOI:10.1371/journal.pone.0062532 |
| [13] |
Liu S. A gut-brain axis regulating glucose metabolism mediated by bile acids and competitive fibroblast growth factor actions at the hypothalamus[J]. Mol Metab, 2018, 8: 37-50. DOI:10.1016/j.molmet.2017.12.003 |
| [14] |
Chiang JL, Jessica MF. Bile acids as metabolic regulators and nutrient sensors[J]. Annu Rev Nutr, 2019, 39(1): 175-200. DOI:10.1146/annurev-nutr-082018-124344 |
| [15] |
Mertens KL, Kalsbeek A, Soeters MR, et al. Bile acid signaling pathways from the enterohepatic circulation to the central nervous system[J]. Front Neurosci, 2017, 11: 617. DOI:10.3389/fnins.2017.00617 |
| [16] |
Prinz P, Hofmann T, Ahnis A, et al. Plasma bile acids show a positive correlation with body mass index and are negatively associated with cognitive restraint of eating in obese patients[J]. Front Neurosci, 2015, 9: 199. |
| [17] |
Miller GD. Appetite regulation: hormones, peptides, and neurotransmitters and their role in obesity[J]. Am J Lifestyle Med, 2019, 13(6): 586-601. DOI:10.1177/1559827617716376 |
| [18] |
Erika H, Ramamoorthy TG, Anthony PC, et al. POMC: the physiological power of hormone processing[J]. Physiol Rev, 2018, 98(4): 2381-430. DOI:10.1152/physrev.00024.2017 |
| [19] |
Ðanić M, Stanimirov B, Pavlović N, et al. Pharmacological applications of bile acids and their derivatives in the treatment of metabolic syndrome[J]. Front Pharmacol, 2018, 9: 1382. DOI:10.3389/fphar.2018.01382 |
| [20] |
Watterson KR, Bestow D, Gallagher J, et al. Anorexigenic and orexigenic hormone modulation of mammalian target of rapamycin complex 1 activity and the regulation of hypothalamic AgoutiRelated protein mRNA expression[J]. Neurosignals, 2013, 21(1/2): 28-41. |
| [21] |
Qiu J, Wagner EJ, Rønnekleiv OK, et al. Insulin and leptin excite anorexigenic pro-opiomelanocortin neurones via activation of TRPC5 channels[J]. J Neuroendocrinol, 2018, 30(2): e12501. |
| [22] |
Kwon OW, Kim MS. Leptin signalling pathways in hypothalamic neurons[J]. Cell Mol Life Sci, 2016, 73(7): 1457-77. DOI:10.1007/s00018-016-2133-1 |
| [23] |
Zhang JJ, Scarpace PJ. The soluble leptin receptor neutralizes leptinmediated STAT3 signalling and anorexic responses in vivo[J]. Br J Pharmacol, 2009, 158(2): 475-82. |
| [24] |
Alexander SB, Sarah MD, Sarah HB, et al. Activation of downstream signals by the long form of the leptin receptor[J]. J Biol Chem, 2000, 275(19): 14563-72. DOI:10.1074/jbc.275.19.14563 |
| [25] |
Eyckerman S, Broekaert D, Verhee A, et al. Identification of the Y985 and Y1077 motifs as SOCS3 recruitment sites in the murine leptin receptor[J]. FEBS Lett, 2000, 486(1): 33-7. DOI:10.1016/S0014-5793(00)02205-5 |
| [26] |
Lubis AR, Widia F, Soegondo S, et al. The role of SOCS-3 protein in leptin resistance and obesity[J]. Acta Med Indones, 2008, 40(2): 89-95. |
| [27] |
Haeusler RA, Accili D. Biochemical and cellular properties of insulin receptor signalling[J]. Nat Rev Mol Cell Biol, 2018, 19(1): 31-44. |
| [28] |
Dodd GT, Tiganis T. Insulin action in the brain: Roles in energy and glucose homeostasis[J]. J Neuroendocrinol, 2017, 29(10): e12513. DOI:10.1111/jne.12513 |
| [29] |
Jane-L L, Zhao AN, Yu JH, et al. The farnesoid X receptor controls gene expression in a ligand- and promoter-selective fashion[J]. J Biol Chem, 2004, 279(10): 8856-61. DOI:10.1074/jbc.M306422200 |
| [30] |
Kawamata Y, Fujii R, Hosoya M, et al. A G protein-coupled receptor responsive to bile acids[J]. J Biol Chem, 2003, 278(11): 9435-40. DOI:10.1074/jbc.M209706200 |
 2020, Vol. 40

