2. 重庆理工大学药学与生物工程学院, 重庆 401135
2. School of Pharmacy and Bioengineering, Chongqing University of Technology, Chongqing 401135, China
蛋白质溶解度是一个热力学参数[1],指在给定的条件下蛋白质饱和溶液的浓度,即溶液与固相(晶态或非晶态)保持平衡时的浓度[2-3]。现有测量蛋白质溶解度无论是在溶剂中加入冷冻干燥的蛋白质[2]还是用超滤浓缩蛋白质溶液的方法[4],都要求增加溶液中蛋白质浓度直至饱和,但此过程容易形成凝胶或过饱和而使溶解度测定不准确[5-6],且操作费时。为快速比较表达丰度低的蛋白突变体溶解度,还需发展直接快速且样品消耗少的蛋白质溶解度表征方法。
上世纪九十年代初提出共振光散射现象[7-8],当激发光位于或接近于分子吸收带时,电子因共振而强烈吸收光能并产生共振光散射(RLS),利用共振光散射可表征物质浓度和聚集状态的改变。借助有机染料、表面活性剂、纳米金等在生物大分子上组装后发生的共振光散射增强作用[7-9],共振光散射法可在低浓度范围内定量生物大分子,但未见共振光散射法直接表征生物大分子溶解度的报道。采用共振光散射法跟踪蛋白质随着浓度改变而发生的分散状态的变化,根据响应曲线上拐点预测蛋白质不同分散状态的最大浓度并定义相应状态下的溶解度,可建立方便快捷、试样用量少的蛋白质溶解度表征方法,以指导蛋白质突变体的溶解度改进。
本文选择牛血清白蛋白(BSA),验证不同pH、不同盐离子浓度对溶解度测定值的影响,并比较谷胱甘肽S-转移酶同工酶alpha、Mμ(GSTA、GSTM)溶解度考察通用性。应用RLS法表征重组表达的季也蒙毕赤酵母菌尿酸酶(R-MGU)及其突变体溶解度,表明突变体溶解度较野生型提高两倍。
1 材料和方法 1.1 材料和试剂季也蒙毕赤酵母菌尿酸酶(R-MGU),谷胱甘肽S-转移酶GSTA、GSTM纯酶均为实验组内表达[10-11]。牛血清白蛋白购于北京索莱宝科技有限公司。
HEPES用ddH2O溶解配成0.02 mol/L溶液并用10 mol/L NaOH调节溶液pH为6.5、7.0、7.4。在pH7.4 HEPES缓冲液中加NaCl配成含NaCl 0.05、0.10、0.15、0.02 mol/L的HEPES缓冲液。所有缓冲液经0.22 μm滤菌器滤菌后备用。
1.2 共振光散射测定体系荧光分光光度计(FL1107M010,Agilent),设狭缝5 nm,电压“中”,测定体积为200 μL。蛋白质按指定浓度稀释后,选择同步扫描模式,在300~700 nm扫描如下系列浓度蛋白质溶液的共振散射光谱图,取RLS特征峰对应的最大强度,做浓度响应曲线。每个浓度平行三次取平均值,取响应曲线上线性段回归分析并延长,两条延长线的交点定义为曲线拐点,对应的横坐标近似蛋白质聚集状态改变的浓度,由此来定义溶解度值。商品BSA用0.02 mol/L HEPES缓冲液配制浓度梯度(0.2~ 50.0 g/L);GSTA以PBS(0.1 mol/L,pH6.5)缓冲液配制浓度梯度(0.06~27.0 g/L),GSTM浓度梯度(0.06~20.0 g/L);R-MGU突变体按表达所得蛋白最高浓度,以Tris-HCl(0.02 mol/L,pH 7.6)缓冲液配制浓度梯度(0.06~0.4 g/L)。充分摇匀并在4 ℃放置1 h后测定。
1.3 MGU及其突变体的表达和纯化[10]转化的细胞扩增并诱导MGU以及其突变体表达后,在裂解缓冲液(Tris-HCl 0.02 mol/L,pH 7.6)中于4 ℃超声处理破碎细胞。在12 000 r/min和4 ℃下离心20 min以除去沉淀物后,取裂解上清液。用DEAE-52纤维素柱纯化两次后,经SDS-PAGE验证纯度。酶活性测定体系为1.0 mL pH 9.2的0.20 mol/L硼砂缓冲液,尿酸的终浓度为0.075 mmol/L,25 ℃加入尿酸酶摇匀后延迟10 s记录底物尿酸在293 nm吸光度的降低,尿酸的毫摩尔消光系数取11.5(mmol/L)-1·cm-1,计算尿酸酶活性,一单位的尿酸酶在该条件下在1 min内消耗了1 μmol/L的尿酸。用Bradford方法定量总蛋白,以牛血清白蛋白为参考[12],尿酸酶的比活性由在pH 9.2下的活性及其总蛋白的量计算[13]。
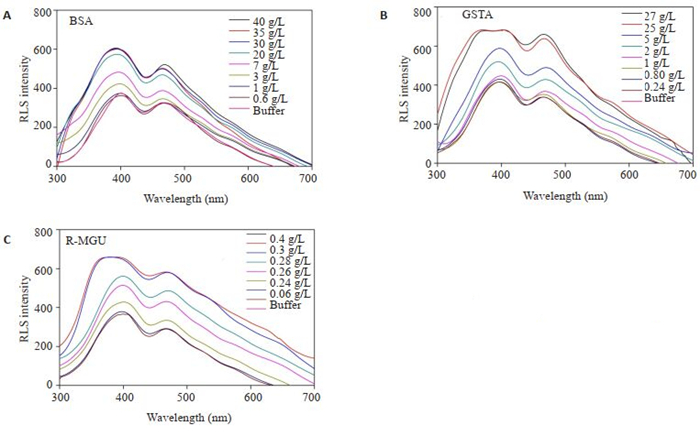
2 结果 2.1 蛋白溶液RLS扫描BSA、GST、MGU按指定蛋白浓度配成溶液,300~ 700 nm同步扫描获得对应共振散射光谱图(图 1)。每组蛋白均显示405、470 nm的两个特征峰。由于405 nm处特征峰在三组蛋白尤其是GSTA和MGU高浓度时响应不灵敏,而470 nm左右的特征峰在高浓度仍有响应。故选择470 nm左右特征峰的RLS信号最大强度作浓度响应曲线。
|
图 1 不同蛋白的RLS信号扫描 Fig.1 RLS signal scanning of different proteins |
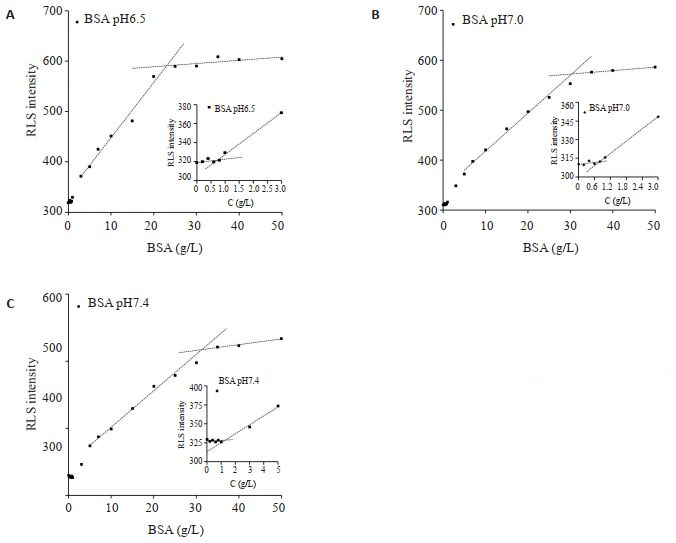
BSA等电点4.6[14],用pH 6.5、7.0、7.4的HEPES缓冲液配制BSA溶液作响应曲线,RLS响应曲线均显示两个信号拐点(图 2)。根据共振光散射增强原理,推测两个拐点分别对应单分子分散状态和多分子聚集状态的最大浓度,即两个聚集态的溶解度。两个拐点浓度随着pH增高逐渐增高(图 2),这与BSA溶液随着pH增高带电粒子增多导致水溶性增大相关[15]。pH7.4 HEPES缓冲液中两个拐点浓度分别对应~1.3 g/L、~33 g/L,后者与相同条件下商品https://www.yiqi.com/ product/detail 285772.html#m02溶解度(>40 g/L)接近(表 1)。
|
图 2 BSA在不同pH下的RLS信号响应 Fig.2 RLS response curve of BSA at different pH values |
| 表 1 不同蛋白的RLS响应曲线拐点浓度 Tab.1 Intersection points of RLS response curves of different proteins |
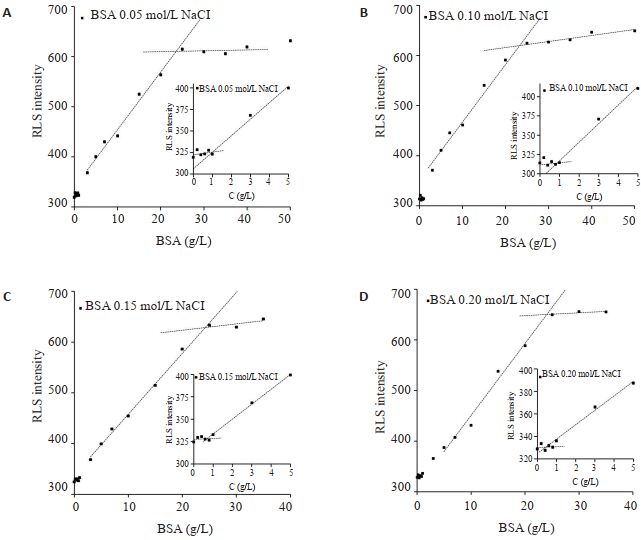
在pH7.4 HEPES缓冲液中加入NaCl至终浓度为0.05、0.10、0.15、0.02 mol/L。由图 3可见,随着NaCl浓度增加,响应曲线上低浓度拐点按1.0、0.9、0.7、0.5 g/L依次降低,而高浓度拐点蛋白浓度均约~24 g/L(表 1)。与不含NaCl的pH7.4 HEPES缓冲液比较,两个RLS信号拐点对应的浓度均有显著下降。
|
图 3 BSA在不同NaCl浓度的RLS响应 Fig.3 RLS response curve of BSA at different NaCl concentrations |
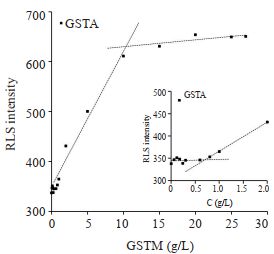
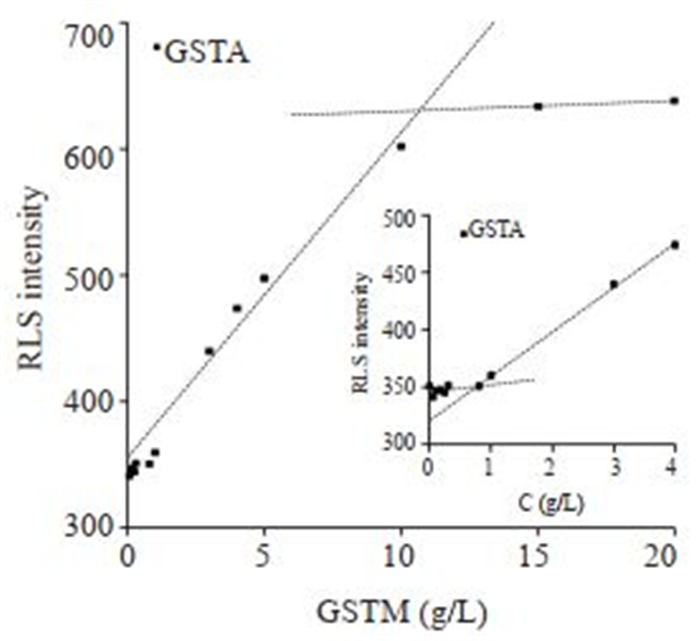
GSTA和GSTM为本实验室常规表达蛋白,已知溶解度中等。实验均发现两个RLS信号拐点(图 4、5)。GSTA和GSTM低浓度拐点均为~0.7 g/L左右,高浓度拐点分别为~10 g/L、~11 g/L(表 1)。
|
图 4 不同浓度GSTA的RLS跟踪 Fig.4 RLS response curve of GSTA at different concentrations |
|
图 5 不同浓度GSTM的RLS跟踪 Fig.5 RLS response curve of GSTM at different concentrations |
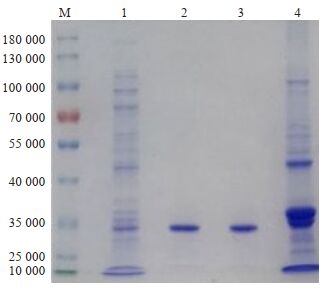
表达季也蒙毕赤酵母菌尿酸酶MGU,并以此模板设计突变体。其突变体重组表达及纯化后与R-MGU活性相当(表 2),SDSPAGE电泳显示污染的多肽可忽略不计(图 6),排除了杂肽对溶解度测定的干扰。
| 表 2 比较野生型尿酸酶及其突变体在pH9.2的活性及生理条件下的水溶性 Tab.2 Comparison of the activities of wild-type uricase and its mutant at pH9.2 and their solubility under physiological condition |
|
图 6 SDS-PAGE验证R-MGU突变体的表达及纯化 Fig.6 SDS-PAGE validation of expression and purification of R-MGU mutant. M: Marker; 1:Crude enzyme; 2: First-round purification by DEAE-52; 3: Second-round purification by DEAE-52; 4: Sediment after ultrasonic lysis. |
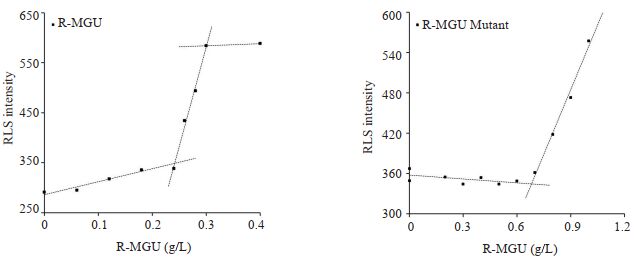
R-MGU的RLS曲线同样有两个拐点(图 7A),分别在0.24 g/L和0.30 g/L。突变体1的第一个RLS信号拐点对应的蛋白浓度约为0.70 g/L(图 7B),是R-MGU溶解度2倍且活性相当。由于该突变体表达丰度不高,产量受限,尚未得到第二个RLS信号拐点。但由图 7可以看出突变体第二个拐点对应的蛋白浓度应大于野生型的4倍。RLS方法初步证明获得溶解度提升的突变体1。
|
图 7 RLS法测定R-MGU及其突变体溶解度 Fig.7 Estimation of solubility of R-MGU and its mutant by RLS |
物质在介质中能以单分子、胶束、沉淀等不同形式存在[16],而通常溶解度的概念是指物质在给定介质中溶解达到平衡(溶液中溶质浓度和固体形态不发生改变)时溶质的物质的量浓度。但蛋白质溶解度测定的经典方法[2, 16-17],无论是平衡法还是动力学法都是基于物质沉淀的产生来定量溶液浓度即溶解度[16]。为了避免蛋白质形成凝胶或过饱和而使溶解度测定不准确,添加聚乙二醇等试剂促使蛋白质沉淀,根据紫外吸收量效关系可推算溶解度[2]。但这些方法无疑都存在操作复杂、费时、样品消耗量大且准确度有限等缺陷。理论上,蛋白质从溶解到沉淀产生,也同样经历了从单分子、胶束到沉淀等不同分散或聚集形式[16],对蛋白质系列浓度分散液进行系统的、详细的实验表征,建立质量-作用或多平衡模型,有望获得给定条件下的固有溶解度。
表征蛋白质集聚体的产生和存在状态可辅助表征其溶解度。由于不同聚集状态的粒径、布朗运动速率等的差异,导致对光的吸收或散射也存在差异,故常通过光吸收或光散射表征蛋白质的聚集状态。另外,蛋白质的不同存在形式与生理功能和疾病密切相关,蛋白质集聚体的形成往往伴随生物活性的降低甚至丧失[18-20];药用蛋白质制剂在制备、制剂等过程中存在不同的聚集状态,包括颗粒或集聚体的尺寸、结构、形态、相互作用和流变性等,对于蛋白质免疫原性、稳定性、优化制剂等至关重要[21-22]。因此,蛋白质集聚体表征具有重要意义。根据蛋白质颗粒大小(从几纳米低聚物到几百纳米聚集体),通常用光散射或结合尺寸排阻色谱法SEC及场流分离等技术对不同分散性粒子进行分级和量化[23-24]。光散射包括动态光散射DLS和静态光散射SLS通常可检测1 nm~2 μm的颗粒[25],然而从DLS得到的尺寸分布偏向于较大的颗粒(强度与直径的六次方有关),适宜检测少量的大颗粒,其对温度和溶剂粘度非常敏感。但这些表征蛋白质集聚体方法仪器昂贵、处理复杂,尤其不适于大量突变体溶解度快速比较。
共振光散射法利用在分子吸收带接近的激发光作用下,电子共振而产生的共振散射增强作用,可较为灵敏地跟踪物质聚集体的生成,蛋白消耗量少,且仪器和操作简单,有望用于突变体溶解度快速比较。本文采用共振光散射法直接跟踪蛋白质聚集状态改变,近似预测蛋白溶解度。在BSA、GST、MGU测定过程中发现,随着浓度的增大,共振散射信号响应曲线出现低浓度和高浓度两个拐点。根据蛋白质的分子结构特征分析[16],在蛋白质稳定的溶剂介质中,低浓度时可为单分子分散状态[21],RLS信号弱;随着浓度增高,蛋白质可为多分子聚集状态如胶束[21, 26],随集聚体生成和增加,共振散射增强,RLS信号迅速增大,直至饱和;因而两个拐点分别对应单分子分散溶解度和经典热力学饱和溶解度。蛋白质单分子分散溶解度为首次提出,对蛋白质单分子状态下的功能及活性表征更具有指导价值。在HEPES缓冲液缓冲范围内和BSA本身的等电点,选择pH 6.5-7.4测定,发现随着pH的增大,BSA带电粒子增多,溶解度增大,导致两个拐点浓度值增大;加入NaCl后BSA溶解度降低,两拐点浓度值均有下降。为减少对蛋白质本身空间结构的影响和蛋白质水化膜的破坏,选择不高于生理盐水的NaCl浓度测定,发现随着NaCl浓度增大,低浓度拐点逐渐下降,说明低浓度NaCl可促使BSA多分子聚集。在GSTA和GSTM观察到相似现象,但测定所得溶解度尤其高浓度拐点均低于BSA,且GSTA两个浓度拐点均略低于GSTM,实际制备所得裂解液上清中该酶丰度差异一致[27],根据二者的一级结构初步分析GSTA亲水性氨基酸占54%,GSTM亲水性氨基酸占58%,亲水差异较小,与RLS测定结果相符。后期结合聚集体生成过程理论建模与响应曲线拟合,并表征聚集体粒径,有望基于RLS直接测定蛋白在给定条件的固有溶解度。
尿酸酶是治疗难治性痛风的有效药物以及临床测定尿酸水平诊断高尿酸血症的重要试剂[28-30],但现有商品尿酸酶的最适pH均偏碱性[31-32];季也蒙毕赤酵母菌的最适pH接近中性,使其具有独特优势,但需分子工程提高其比活性和水溶性。重组表达的野生型季也蒙毕赤酵母菌尿酸酶[10],用所建立RLS方法直接表征溶解度获得两个拐点浓度均小于0.30 g/L,表明其溶解度远远低于所测其余蛋白,限制其应用。经RLS方法比较突变体溶解度,初步获得溶解度增倍的突变体1。证明该RLS方法可快速评估MGU及其突变体的溶解度。
综上,本文采用共振光散射法直接跟踪蛋白质随浓度的改变从分散到聚集体形成过程,近似预测相应存在形式的最大浓度,可获得单分子分散溶解度,及经典热力学溶解度。建立一种简便、快捷、蛋白用量少的溶解度近似表征新方法,可指导蛋白分子改造以提高溶解度,对表达丰度低的蛋白尤其重要。
| [1] |
倪海月, 任世学, 方桂珍, 等. 反气相色谱法与Hansen溶解度参数法测定聚乙烯醇溶解度参数及相关热力学性质[J]. 色谱, 2016, 34(9): 933-9. |
| [2] |
Kramer RM, Shende VR, Motl N, et al. Toward a molecular understanding of protein solubility: increased negative surface charge correlates with increased solubility[J]. Biophys J, 2012, 102(8): 1907-15. |
| [3] |
Herhut M, Brandenbusch C, Sadowski G. Modeling and prediction of protein solubility using the second osmotic virial coefficient[J]. Fluid Phase Equilibria, 2016, 422: 32-42. |
| [4] |
Goldring JP. Methods to concentrate proteins for protein isolation, proteomic, and peptidomic evaluation[J]. Methods Mol Biol, 2015, 1314: 5-18. DOI:10.1007/978-1-4939-2718-0_2 |
| [5] |
Kramer RM. Towards a molecular understanding of protein solubility [D]. Texas A & M University, 2011. https://search.proquest.com/docview/909545103
|
| [6] |
Hackl E, Darkwah J, Smith G, et al. Effect of arginine on the aggregation of protein in freeze-dried formulations containing sugars and polyol: II. BSA reconstitution and aggregation[J]. AAPS Pharm Sci Tech, 2018, 19(7): 2934-47. DOI:10.1208/s12249-018-1114-0 |
| [7] |
Pirdadeh-Beiranvand M, Afkhami A, Madrakian T. Ag nanoparticles for determination of bisphenol A by resonance light-scattering technique[J]. J Iran Chem Soc, 2018, 15(7): 1527-34. |
| [8] |
Liu SY, Tan Y. Detection of microalgae superoxide dismutase (SOD) using a GNRS-based resonance light scattering system[J]. Integr Biol (Camb), 2018, 10(3): 159-65. |
| [9] |
Fu F, Li LY, Luo QM, et al. Selective and sensitive detection of lysozyme based on plasmon resonance light-scattering of hydrolyzed peptidoglycan stabilized-gold nanoparticles[J]. Analyst, 2018, 143(5): 1133-40. |
| [10] |
饶菁菁, 景一娴, 邹明月, 等. 季也蒙毕赤酵母菌尿酸酶基因的克隆、重组表达及表征[J]. 中国生物工程杂志, 2017, 37(11): 74-82. |
| [11] |
许傍田, 赵宇, 龙友琦, 等. 两种依他尼酸衍生物对人类谷胱甘肽_S_转移酶Mu的抑制动力学研究[J]. 重庆医科大学学报, 2019. |
| [12] |
Bradford MM. A rapid and sensitive method for the quantitation of microgram quantities of protein utilizing the principle of proteindye binding[J]. Anal Biochem, 1976, 72: 248-54. |
| [13] |
Rao J, Liao J, Bu Y, et al. Ampholytic ion-exchange materials coated with small zwitterions for high-efficacy purification of ionizable soluble biomacromolecules[J]. Int J Biol Macromol, 2018, 120(Pt B): 2234-41. |
| [14] |
Zhao X, Xing T, Chen X, et al. Changes of molecular forces during thermo-gelling of protein iolated from pse-Like chicken breast by various isoelectric solubilization/precipitation extraction strategies[J]. Food Bioproc Tech, 2017, 10(7): 1240-7. DOI:10.1007/s11947-017-1893-4 |
| [15] |
Navarra G, Peres C, Contardi M, et al. Heat- and pH-induced BSA conformational changes, hydrogel formation and application as 3D cell scaffold[J]. Arch Biochem Biophys, 2016, 606: 134-42. |
| [16] |
胡程耀, 黄培. 固体溶解度测定方法的近期研究进展[J]. 药物分析杂志, 2010, 30(4): 761-6. |
| [17] |
Trevino SR, Scholtz JM, Pace CN. Measuring and increasing protein solubility[J]. J Pharm Sci, 2008, 97(10): 4155-66. |
| [18] |
Desai P. Therapeutic targets and delivery challenges for Alzheimer's disease[J]. World J Pharmacol, 2015, 4(3): 236-64. DOI:10.5497/wjp.v4.i3.236 |
| [19] |
Garciamanyes S, Giganti D, Badilla CL, et al. Single molecule force spectroscopy predicts a misfolded, domain-swapped conformation in human γD-crystallin[J]. J Biol Chem, 2016, 291(8): 4226-35. DOI:10.1074/jbc.M115.673871 |
| [20] |
Sangwan S, Zhao AN, Adams KL, et al. Atomic structure of a toxic, oligomeric segment of SOD1 linked to amyotrophic lateral sclerosis (ALS)[J]. Proc Natl Acad Sci USA, 2017, 114(33): 8770-5. |
| [21] |
Amin S, Barnett GV, Pathak JA, et al. Protein aggregation, particle formation, characterization & rheology[J]. Curr Opin Colloid Interface Sci, 2014, 19(5): 438-49. DOI:10.1016/j.cocis.2014.10.002 |
| [22] |
Gikanga B, Eisner DR, Ovadia R, et al. Processing impact on monoclonal antibody drug products: protein subvisible particulate formation induced by grinding stress[J]. PDA J Pharm Sci Technol, 2017, 71(3): 172-88. DOI:10.5731/pdajpst.2016.006726 |
| [23] |
Kahle J, Wätzig H. Interlaced Size Exclusion Chromatography for faster protein analysis[J]. Eur J Pharm Biopharm, 2018, 126: 101-3. |
| [24] |
Wills PR, Winzor DJ. Rigorous analysis of static light scattering measurements on buffered protein solutions[J]. Biophys Chem, 2017, 228: 108-13. |
| [25] |
Stetefeld J, McKenna SA, Patel TR. Dynamic light scattering: a practical guide and applications in biomedical sciences[J]. Biophys Rev, 2016, 8(4): 409-27. DOI:10.1007/s12551-016-0218-6 |
| [26] |
Ripple DC, Dimitrova MN. Protein particles: what we know and what we do not know[J]. J Pharm Sci, 2012, 101(10): 3568-79. DOI:10.1002/jps.23242 |
| [27] |
许榜田.谷胱甘肽-S-转硫酶Mu二价潜抑制剂设计、合成及表征[D].重庆: 重庆医科大学, 2014. http://www.wanfangdata.com.cn/details/detail.do?_type=degree&id=Y2690233
|
| [28] |
Huang Y, Chen YX, Yang XL, et al. Optimization of pH values to formulate the bireagent kit for serum uric acid assay[J]. Biotechnol Appl Biochem, 2015, 62(1): 137-44. DOI:10.1002/bab.1227 |
| [29] |
Yang XL, Yuan YH, Zhan CG, et al. Uricases as therapeutic agents to treat refractory gout: Current states and future directions[J]. Drug Dev Res, 2012, 73(2): 66-72. |
| [30] |
Sands E, Kivitz A, Dehaan W, et al. P109 Clinical development of a novel strategy to mitigate biologic immunogenicity: monthly dosing of a pegylated uricase with SVP-R enables sustained reduction of serum uric acid (SUA) levels by mitigating formation of anti-drug antibodies (ADAS)[J]. Ann Rheum Dis, 2018, 77(Suppl 1): A59-A60. DOI:10.1136/annrheumdis-2018-ewrr2018.124 |
| [31] |
Yang L, Zhou YL, Li Y, et al. Property and pharmacodynamics of uricase-catalase liposomes[J]. Chinese Pharmacological Bulletin, 2017, 33(9): 1211-4. |
| [32] |
Feng J, Wang L, Liu HB, et al. Crystal structure of Bacillusfastidious uricase reveals an unexpected folding of the C-Terminus residues crucial for thermostability under physiological conditions[J]. Appl Microbiol Biotechnol, 2015, 99(19): 7973-86. DOI:10.1007/s00253-015-6520-6 |
 2020, Vol. 40

