Renal transplantation (RT) is currently viewed as the last resort for treatment of end-stage renal disease (ESRD) with better effectiveness and lower costs than dialysis[1]. During the past decade, with the advent of powerful immunosuppressive drugs, the short-term survival rate of RT recipients has significantly improved[2]. Unfortunately, most immunosuppressive drugs have specific side effects that lead to an increased risk of infection and poor long-term survival rates[3]. Genetic variation and hormonal, pharmacogenetic, and environmental factors are all associated with an increased risk of graft failure in RT[4], but still, these factors do not entirely account for the response to transplantation.
Previous studies revealed that post-transplant complications were associated with the host immune function[5], and that gut microbiota could activate the host's innate and adaptive immune system by interacting with Toll-like receptors or the nucleotide-binding oligomerization domain-like receptors of the intestinal epithelial cells. Dysregulated immune responses also affect the microbiota in a bidirectional manner[6]. Based on these observations, we hypothesized that the gut microbiota plays a role in modulating the function of the transplanted kidneys.
It has been recognized that the interaction between gut microbiota and RT is not unidirectional, and immunosuppression and antimicrobial therapies can disrupt gut microbial structure and lead to dysbiosis[7]. Fricke et al reported major changes in microbiota composition as a result of RT[2], and Lee et al reported a significant increase in Proteobacteria after the transplantation[8]. More importantly, gut microbiota may also be associated with the outcome of RT. According to Ren et al, a decrease in gut microbial diversity may predict acute rejection of liver allografts in rats [9]. Postoperative complications are usually associated with gut dysbiosis, and gut microbiota can also influence the dosing of immunosuppressant medications[10].
Currently few studies have been reported to examine the complex interactions between gut microbiota and RT. In this present study, we aimed to analyze the changes in the composition and functions of gut microbiota in RT recipients to obtain a better understanding of the association between gut microbiota and RT.
PATIENTS AND METHODS Study cohortWith approval by the Ethical Committee of Nanfang Hospital affiliated to Southern Medical University, we retrospectively studied the data of 16 RT recipients (mean age 42.8 ± 11.5 years), 84 patients with chronic kidney disease (CKD) (mean age 55.9 ± 18.2 years) and 53 healthy volunteers (54.7±12.8 years) in our hospital. All the participants were fully informed of the details of the study and gave written informed consent to participate in the study. All the 84 CKD patients were in stage III-IV and eligible for RT, and they all underwent hemodialysis in our hospital. The clinical data of the patients were collected and biochemical or cytological tests of blood specimens were performed. The clinical markers related to the renal function, including blood urea nitrogen (BUN), serum creatinine (SCr), and serum uric acid (BUA), were used to discriminate the CKD and control cohorts. None of the participants received antibiotics within 3 months prior to the sampling; none of the RT recipients had diarrhea before collecting the fecal samples.
Gut microbial community profilingMicrobial DNA was extracted from the fecal samples using the standard methods[11]. The V3 region of 16S rRNA was amplified with polymerase chain reaction (PCR) and sequenced on an Ion Personal Genome Machine platform. The sequencing reads for each fecal sample were independently processed for quality control. High-quality reads were clustered to operational taxonomic units (closed-reference) and annotated with taxonomy information using the Quantitative Insights Into Microbial Ecology (QIIME) pipeline[12]. Finally, we generated a Kyoto Encyclopedia of Genes and Genomes (KEGG) orthology profile using Phylogenetic Investigation of Communities by Reconstruction of Unobserved States (PICRUSt)[13] for functional analysis.
Statistical analysisThe Chao1 index for each sample was measured using QIIME. Weighted UniFrac distance was run using the phylogenetic tree constructed with QIIME. Principal component analysis (PCA) and linear discriminant analysis effect size (LEfSe)[14] were utilized to compare the significant differences in taxa among the groups. Wilcoxon's rank sum test was used for comparisons. Permutational multivariate analysis of variance was performed using the vegan package, and the permutated P value was obtained under 10 000 permutations. Random Forest models were trained using the RandomForest package, and the performance of the predictive model was evaluated with the cross-validation error. Receiver operator characteristic (ROC) analysis was performed using the pROC package.
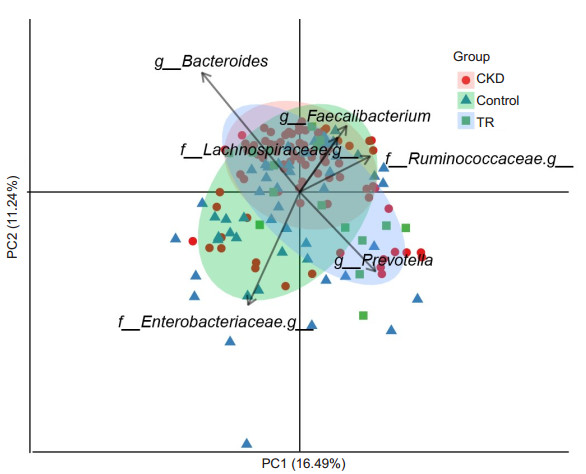
RESULTS Richness and diversity of gut microbiota in transplant recipientsIn this study, we generated 7 749 787 raw reads with a median read length of 175 base pairs. After quality trimming and chimera filtering, 6 974 809 high-quality sequences remained, with an average of 67 065 reads (range: 28 330 to 110 999) for each sample. When we randomly selected 20 000 reads 10 times from all the samples, the median average value of Good's coverage was nearly 98%, which was close to the plateau, indicating the sequencing depth was sufficient for characterizing the bacterial population in the fecal samples. In addition, we assessed the species richness Chao1 index in the 3 groups. As expected, RT recipients had the lowest microbial richness (Chao1 index of 249.6±118.7), followed by CKD (286.4 ± 89.3), and the highest microbial richness occurred in the controls (394.5±86.8, Fig. 1A). In contrast, the weighted UniFrac distance, which was the indicator of phylogenetic similarity, indicated that RT recipients had the largest inter-individual difference, followed by CKD and the controls (Fig. 1B). The intergroup difference between RT recipients and the controls was much higher than that between RT recipients and CKD patients, suggesting that the microbial characteristics of RT recipients were closer to those of CKD patients than to those of the controls. Consistent with the similarity between RT recipients and CKD patients, gut microbiota in RT recipients and CKD patients could be separated from the controls with PCA (P < 0.01, Fig. 2).

|
Fig.1 Gut microbial diversity in CKD patients, RT recipients, and healthy controls. A: Boxplot of α-diversity (Chao1 index) of the 3 groups; B: Boxplot of β-diversity (Unweighted UniFrac distance index) of the 3 groups. **P < 0.01 by Wilcoxon test. The box represents the interquartile ranges (IQRs) between the first and third quartiles, and the line inside the box represents the median |
|
Fig.2 Principal component analysis (PCA) of genus profile of gut microbiota in CKD patients, RT recipients, and healthy controls. The first 2 PCA axes are PC1 on the X-axis, indicating a variability of 16.49%; PC2 on the Y-axis indicates a variability of 11.24%. The red, blue, and green points represent samples from CKD patients, RT recipients, and healthy controls, respectively. The 5 dominant organisms that separate different groups are labeled. |
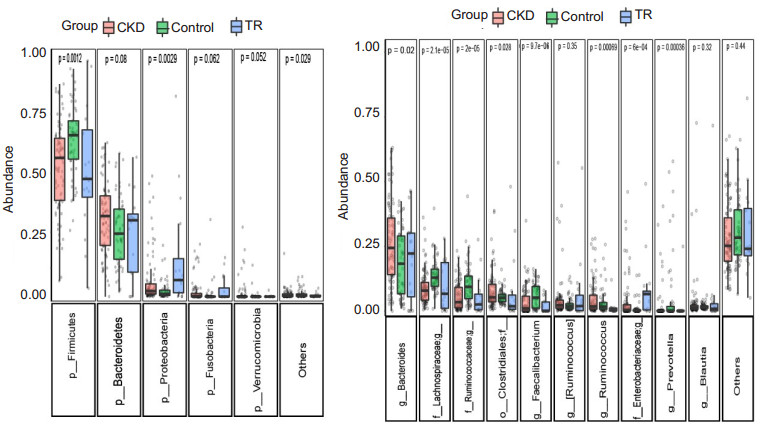
To determine how the gut microbial community shifts in RT recipients, we further compared the differences in microbial composition among the 3 groups. In general, the microbial community structure in RT recipients was similar to that in CKD patients, and compared with the controls, RT recipients and CKD patients had increased abundances of Proteobacteria and Bacteroidetes and a decreased abundance in Firmicutes (Fig. 3A); The abundance of Bacteroides and Enterobacteriaceae was significantly increased, while Lachnospira, Ruminococcaceae, and Faecalibacterium were decreased (Fig. 3B). We noted a much higher abundance of Proteobacteria and Enterobacteriaceae in RT recipients than in the CKD patients.
|
Fig.3 Boxplot shows gut microbiota composition at the phylum and genus level. Only the top 5 phyla and top 10 genera are shown for clarity (with P values by Kruskal-Wallis test). |
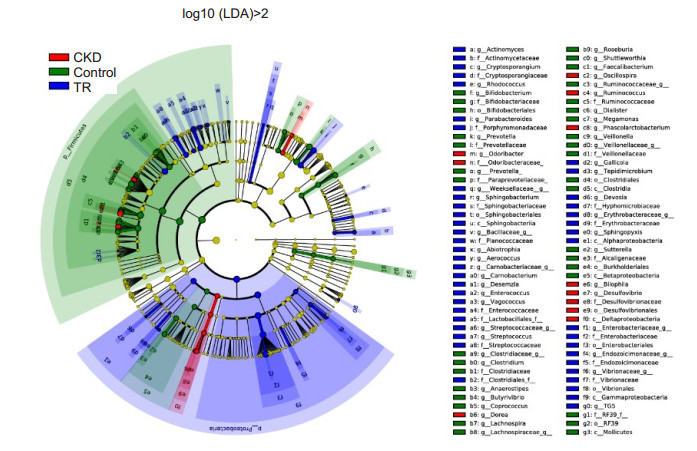
Investigation using LEfSe (Fig. 4) also identified the specific bacteria associated with each group. Enterobacteriales, Enterococcaceae, Porphyromonadaceae, Sphingobacteriaceae, Cryptosporangiaceae, Vibrionaceae, Streptococcaceae, Actinomycetaceae, Ruminococcus, Dorea, and Phascolarctobacterium were the dominant microbes in RT recipients. In contrast, Lachnospiraceae (Faecalibacterium, Roseburia, Lachnospira, Butyrivibrio, and Shuttleworthia), Bifidobacteriaceae, and Veillonellaceae (Megamonas, Veillonella, and Dialister) were enriched in the control group. Deltaproteobacteria and Odoribacteraceae were enriched in CKD patients.
|
Fig.4 Composition of fecal microbiota in CKD patients, RT recipients, and healthy controls. LEfSe method was applied to identify markers that were significantly associated with CKD patients (red), RT recipients (blue), and healthy controls (green). A cladogram based on LEfSe is also shown. |
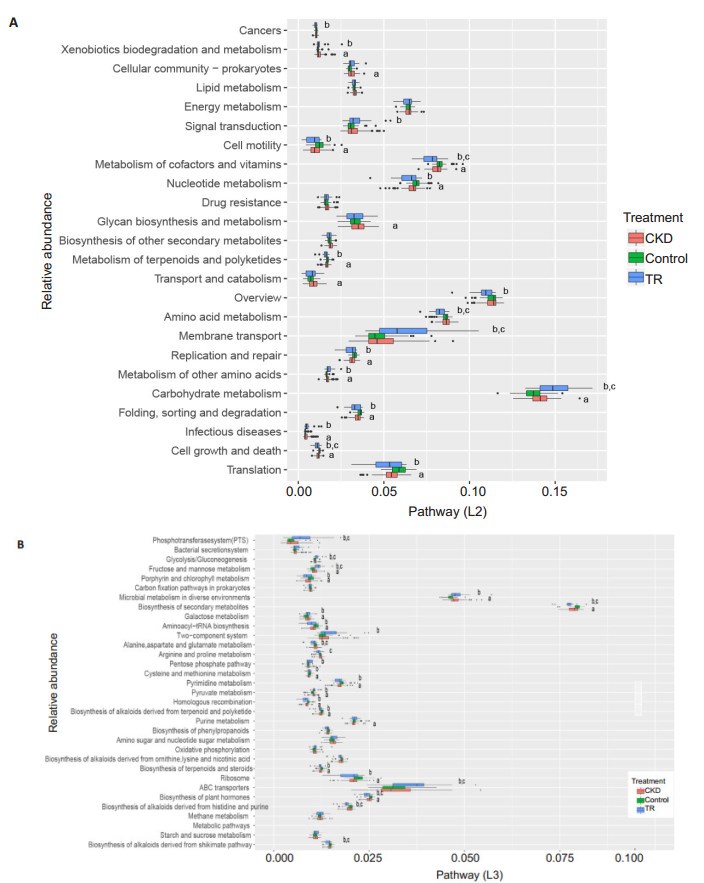
Next, we determined the predicted function of gut microbiota using PICRUSt software. Consistent with the similarity of microbial composition, the functional composition of gut microbiota was also highly similar in RT recipients and CKD patients. At the KEGG L2 level, the results showed a significant increase in the metabolism of carbohydrates, other amino acids, and xenobiotics, and a significant decrease in the metabolism of cofactors, vitamins, nucleotides, terpenoids, and polyketides, as well as in genetic information processing (translation, folding, sorting, degradation, replication, and repair) and cellular processes (cell growth, death, and motility) in RT recipients and CKD patients (Fig. 5). Notably, genes related to transport system members and carbohydrate metabolism showed a significantly greater increase in RT recipients than in CKD patients, whereas those associated with the metabolism of cofactors, vitamins, and amino acids showed a greater increase in the latter.
|
Fig.5 Composition of microbial functional pathways (L2, L3) in CKD patients, RT recipients, and control groups. aP < 0.05 (control vs CKD); bP < 0.05 (control vs RT recipients); cP < 0.05 (CKD vs RT recipients). Only the pathways with an average relative abundance greater than 1% in all samples are shown for clarity. |
We further identified significantly altered microbial functions at the KEGG L3 level. The results showed that the metabolism of fructose, mannose, galactose, and pyruvate was greater in RT recipients and CKD patients, while pyrimidine metabolism and genetic information processing (involving the ribosome, homologous recombination, and aminoacyl-tRNA) was significantly greater in the controls. Compared with the CKD patients, the RT recipients had a significantly greater abundance of phosphotransferase system (PTS) and ATP-binding cassette (ABC) transport system members, and enhanced glycolysis/gluconeogenesis and metabolism of fructose and mannose; the RT recipients also showed enhanced metabolism of amino acids (alanine, aspartate, glutamate, arginine, and proline), biosynthesis of alkaloids, and metabolism of plant hormones.
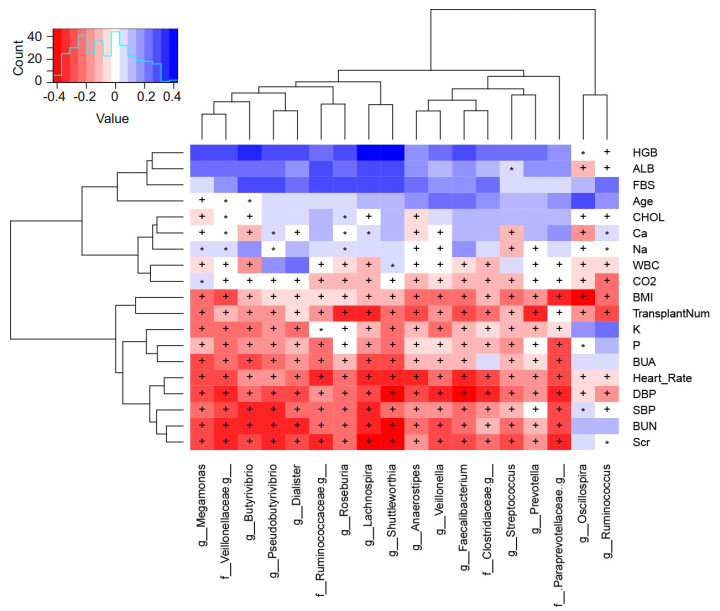
Correlations between clinical markers and microbiotaWe analyzed the dynamic changes in the microbial structure according to the serum marker levels, and the results are shown in a heatmap (Fig. 6). The presence of Lachnospiraceae (Pseudobutyrivibrio, Butyrivibrio, Roseburia, Lachnospira, Shuttleworthia, and Anaerostipes) and Veillonellaceae (Veillonella, Megamonas, Dialister, and Faecalibacterium) was negatively correlated with SCr, BUN, systolic blood pressure, diastolic blood pressure, and heart rate. RT showed a significant negative correlation with the presence of Lachnospira, Roseburia, and Prevotella. Meanwhile, body mass index was negatively correlated with the presence of Paraprevotellaceae and Oscillospira. Barrios et al[15]also reported that the presence of Ruminococcaceae, Lachnospiraceae, and Christensenellaceae was associated with lower levels of indoxyl sulfate, p-cresyl sulfate, and phenylacetylglutamine, and better renal function.
|
Fig.6 Correlation between microbes and clinical markers. Spearman's rank correlation coefficients and corresponding P values are shown. +P < 0.01; *P < 0.05. Only Spearman's rank correlation coefficients>0.3 are shown. HGB: Hemoglobin; ALB: Albumin; FBS: Fasting blood sugar; CHOL: Cholesterol; WBC: White blood cell count; BMI: Body mass index; BUA: Blood uric acid; DBP: Diastolic blood pressure; SBP: Systolic blood pressure; BUN: Blood urea nitrogen; SCr: Serum creatinine; TransplantNum: Number of renal transplants. |
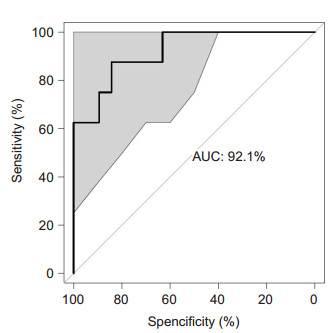
Finally, based on the distinct microbial structure in CKD patients and healthy controls, we utilized random forest models to distinguish CKD with a high accuracy, as indicated by an area under the ROC curve (AUC) of 92.1% (Fig. 7). Interestingly, we found that the most important factor in the classifier system was the presence of 4 genera (Shuttleworthia, Lachnospira, Pseudobutyrivibrio, and Roseburia) of Lachnospiraceae, consistent with our results of correlation analysis. We also applied this model to predict RT recipients. Only 2 patients were included in the control group, while all the others were included in the CKD group, indicating that although the clinical markers in RT recipients had significantly improved, the gut microbiota in RT recipients was still similar to that in CKD patients. In addition, the clinical markers in the 2 predicted subgroups showed no significant differences.
|
Fig.7 Classification of CKD using random forest method. The performance of the random forest model was assessed with the AUC of the ROC curve. The light gray area indicates the 95% confidence interval. |
We show that RT had an important effect on gut microbiota, with a significant increase in the inter-individual variance and a significant decrease in the Chao1 index. The overall microbial structure in RT recipients was closer to that in CKD patients than in the healthy controls, possibly because of the sampling during the first month after transplantation. In addition, we analyzed their correlations with the clinical markers to identify the key gut microbiota associated with RT.
We observed significant differences in the composition of gut microbiota among the 3 groups. There was a greater abundance of Bacteroides (Bacteroidetes) and Enterobacteriaceae (Proteobacteria) and a significantly lower abundance of Lachnospira, Ruminococcaceae, and Faecalibacterium (Firmicutes) in RT recipients and CKD patients. RT recipients were found to have a significantly greater abundance of Enterobacteriaceae (Proteobacteria) compared to CKD patients. Enterobacteriaceae are often increased in type 2 diabetes, obesity, and nonalcoholic fatty liver disease[16], as well as in organ transplantation[17]. An increase in Enterobacteriaceae is often thought to signal a proinflammatory state and is associated with poor health status [16], but the mechanism underlying the increase in Enterobacteriaceae in disease is not fully understood.
We found decreased the abundances of Lachnospira, Ruminococcaceae, and Faecalibacterium in CKD patients and RT recipients. Most of these organisms are anaerobic or facultative probiotics and produce short-chain fatty acids (SCFAs). Emerging evidence has suggested that SCFAs play an important role in the regulation of immunity, blood pressure, and glucose and lipid metabolism. SCFAs seemed to be the link that connects gut microbiota and host homeostasis[18]. The associations between SCFAs and renal injury were recently revealed, and SCFAs may interfere with progression of CKD in several ways, including controlling blood pressure by inducing renin secretion and the development of subtypes of renal cells [19]. Jiang et al found that butyrate-producing bacteria, including Roseburia, Faecalibacterium, Clostridium, Coprococcus and Prevotella, were reduced in an ESRD group[5]. Treatment with acetate-producing bacteria was reported to increase acetate levels and ameliorate acute renal injury [20], suggesting that SCFAs may act as new therapeutic targets for prevention of renal injury.
We also observed significant functional alterations among the 3 groups. Carbohydrate metabolism (i.e., fructose, mannose, galactose, and pyruvate) was increased while nucleotide metabolism (pyrimidine) and genetic information processing (involving the ribosome, homologous recombination, and aminoacyl-tRNA) were decreased in RT recipients and CKD patients. A special diet with limited protein intake is usually required for CKD patients, suggesting that carbohydrate is the primary source of energy for microbiota, leading to an increase in carbohydrate metabolism. Meanwhile, the decrease in nucleotide metabolism and genetic information processing indicated a decrease in the richness of gut microbiota, which is consistent with the lowered Chao1 index in CKD patients compared with the healthy controls.
RT recipients also showed significantly greater abundance of transport system members (including PTS and ABC transporters) and greater carbohydrate metabolism (fructose and mannose), but had enhanced amino acid metabolism (alanine, aspartate, glutamate, arginine and proline), biosynthesis of alkaloids, and metabolism of plant hormones than CKD patients. ABC transporters have diverse functions, including importing essential nutrients and exporting substrates out of the cell, and have been associated with multidrug resistance in bacterial cells[21]. A body of evidence has implicated the importance of P-glycoprotein, the first human ABC transporter identified, in modifying the clinical outcomes [22]. PTS is involved in the uptake and phosphorylation of a variety of carbohydrates and plays a role in regulating microbial gene expression through catabolite repression to allow the cells to preferentially import simple sugars over other carbohydrates. Consistent with the increase in PTS, the metabolism of fructose and mannose and glycolysis/gluconeogenesis were also increased in RT recipients. Conversely, the metabolism of cofactors and vitamins and amino acid metabolism were found to be lower in RT recipients compared with CKD patients and controls, and these changes may be associated with the use of immunosuppressive agents.
Finally, we established a predictive CKD model with a good discriminatory power for CKD and control groups. Interestingly, an important factor in the classifier system was the presence of several beneficial genera in the Lachnospiraceae (Shuttleworthia, Lachnospira, Pseudobutyrivibrio and Roseburia), which also showed negative correlations with the clinical conditions of the patients. This model did not perform well in stratifying RT recipients, possibly because of the small sample size or the complex microbial structure. Therefore, further studies of the association between gut microbiota and RT are needed. The insights gained in this study can be potentially used for developing robust diagnostic methods for CKD screening and even for prognostic evaluation of RT.
This study had several limitations. First, the sample size of RT recipients was relatively small. Second, the high inter-individual variation in RT recipients indicated that patients should serve as their own controls. Third, we only analyzed the fecal samples at a single time point after transplantation, which led to the difficulty in clarifying the temporal dynamics between gut microbiota and disease. It is well established that the composition of gut microbiota shifts during a disease process; thus, sampling at multiple time points may be necessary.
In summary, this is the first study to demonstrate the gut microbial composition and function in RT recipients. Our findings contribute to the understanding of the correlations between gut microbiota and RT recipients and might be useful in predicting the clinical responses of the recipients to transplantation and in designing targeted therapies to improve the outcomes of RT recipients.
| [1] | Laupacis A, Keown P, Pus N, et al. A study of the quality of life and cost-utility of renal transplantation[J]. Kidney Int, 1996, 50(1): 235-42. DOI: 10.1038/ki.1996.307. |
| [2] | Fricke WF, Maddox C, Song Y, et al. Human microbiota characterization in the course of renal transplantation[J]. Am J Transplant, 2014, 14(2): 416-27. DOI: 10.1111/ajt.12588. |
| [3] | Sayegh MH, Carpenter CB. Transplantation 50 years later-progress, challenges, and promises[J]. N Engl J Med, 2004, 351(26): 2761-6. DOI: 10.1056/NEJMon043418. |
| [4] | Zununi Vahed S, Samadi N, Mostafidi E, et al. Genetics and epigenetics of chronic allograft dysfunction in kidney transplants[J]. Iran J Kidney Dis, 2016, 10(1): 1-9. |
| [5] | Jiang S, Xie S, Lv D, et al. Alteration of the gut microbiota in Chinese population with chronic kidney disease[J]. Sci Rep, 2017, 7(1): 2870. DOI: 10.1038/s41598-017-02989-2. |
| [6] | Ahmad S, Bromberg JS. Current status of the microbiome in renal transplantation[J]. Curr Opin Nephrol Hypertens, 2016, 25(6): 570-6. DOI: 10.1097/MNH.0000000000000262. |
| [7] | Antunes LC, Han J, Ferreira RB, et al. Effect of antibiotic treatment on the intestinal metabolome[J]. Antimicrob Agents Chemother, 2011, 55(4): 1494-503. DOI: 10.1128/AAC.01664-10. |
| [8] | Lee JR, Muthukumar T, Dadhania D, et al. Gut microbial community structure and complications after kidney transplantation:a pilot study[J]. Transplantation, 2014, 98(7): 697-705. DOI: 10.1097/TP.0000000000000370. |
| [9] | Ren Z, Jiang J, Lu H, et al. Intestinal microbial variation may predict early acute rejection after liver transplantation in rats[J]. Transplantation, 2014, 98(8): 844-52. DOI: 10.1097/TP.0000000000000334. |
| [10] | Lee JR, Muthukumar T, Dadhania D, et al. Gut microbiota and tacrolimus dosing in kidney transplantation[J]. PLoS One, 2015, 10(3): e0122399. DOI: 10.1371/journal.pone.0122399. |
| [11] | Qin J, Li Y, Cai Z, et al. A metagenome-wide association study of gut microbiota in type 2 diabetes[J]. Nature, 2012, 490(7418): 55-60. DOI: 10.1038/nature11450. |
| [12] | Caporaso JG, Kuczynski J, Stombaugh J, et al. QⅡME allows analysis of high-throughput community sequencing data[J]. Nat Methods, 2010, 7(5): 335-6. DOI: 10.1038/nmeth.f.303. |
| [13] | Langille MG, Zaneveld J, Caporaso JG, et al. Predictive functional profiling of microbial communities using 16S rRNA marker gene sequences[J]. Nat Biotechnol, 2013, 31(9): 814-21. DOI: 10.1038/nbt.2676. |
| [14] | Segata N, Izard J, Waldron L, et al. Gut-microbiota-metabolite axis in early renal function decline[J]. PLoS One, 2015, 10(8): e0134311. DOI: 10.1371/journal.pone.0134311. |
| [15] | Rizzatti G, Lopetuso LR, Gibiino G, et al. Proteobacteria:a common factor in human diseases[J]. Biomed Res Int, 2017, 2017: 9351507. |
| [16] | Wang W, Xu S, Ren Z, et al. Gut microbiota and allogeneic transplantation[J]. J Transl Med, 2015, 13: 275. DOI: 10.1186/s12967-015-0640-8. |
| [17] | Huang W, Zhou L, Guo H, et al. The role of short-chain fatty acids in kidney injury induced by gut-derived inflammatory response[J]. Metabolism, 2017, 68: 20-30. DOI: 10.1016/j.metabol.2016.11.006. |
| [18] | Pluznick JL, Protzko RJ, Gevorgyan H, et al. Olfactory receptor responding to gut microbiota-derived signals plays a role in renin secretion and blood pressure regulation[J]. Proc Natl Acad Sci USA, 2013, 110(11): 4410-5. DOI: 10.1073/pnas.1215927110. |
| [19] | Andrade-Oliveira V, Amano MT, Correa-Costa M, et al. Gut bacteria products prevent AKI induced by ischemia-reperfusion[J]. J Am Soc Nephrol, 2015, 26(8): 1877-88. DOI: 10.1681/ASN.2014030288. |
| [20] | Beis K. Structural basis for the mechanism of ABC transporters[J]. Biochem Soc Trans, 2015, 43(5): 889-93. DOI: 10.1042/BST20150047. |
| [21] | Polgar O, Bates SE. ABC transporters in the balance:is there a role in multidrug resistance?[J]. Biochem Soc Trans, 2005, 33(Pt 1): 241-5. |
 2018, Vol. 38

