2. 中国人民解放军总医院放射科,北京 100853
2. Department of Radiology, General Hospital of PLA, Beijing 100853, China
动脉自旋标记(ASL)序列是一个非对比剂增强的脑灌注成像技术,可以用来活体定量测量脑部灌注状态,具有较好的重复性及再现性[1-4],已经广泛应用于脑梗死后脑灌注状态的评估[5-6],脑肿瘤的灌注评估[7-8],认知功能障碍疾病的脑灌注研究[9]等。既往临床常用的ASL为流动敏感替代反转恢复序列(FAIR)[10],存在的不足之处为扫描范围小,分辨率较差且2维扫描。3D假连续快速自旋回波动脉自旋标记(3D pc-ASL)序列是新近出现的可以行全脑三维容积灌注采集且具有高分辨率的非对比剂灌注成像技术,迅速在临床上出现了广泛的应用,如多发性硬化斑块灌注评估[11]及星形细胞瘤的灌注评估[12]等。与PET-CT比较研究也发,3D pc-ASL可以提供与其相一致的灌注测量[13]。
既往可重复性研究也主要集中在不同扫描时间间隔[2, 14-15]及不同扫描设备之间脑部CBF测量的可靠性[16]。也有文献证实3D pc-ASL在3.0T磁共振上具有可靠的全脑血流量(CBF)测量[17]。然而关于3D pc-ASL序列局部CBF测量的可重复性研究仍没有报道。因此,本研究采用基于脑结构的分割技术,自动提取皮层下灰质核团的脑CBF值,并采用组内相关系数等方法对3D pc-ASL脑灌注的可重复性进行评估。
1 对象和方法 1.1 研究对象招募健康志愿者8名(男:6名,女:2名),年龄21~ 33岁,平均年龄23.8岁。所有受试者均为右利手,均受过高等教育,既往体健。排除标准:颅脑外伤,脑部器质性病变,精神类疾病史,近期服用过精神类药物或激素。所有受试者均在同一时间扫描2次,时间间隔为1周。受试者在扫描前1 h内禁止剧烈运动和引用含咖啡因类饮料。
1.2 数据采集所有数据均采用GE DISCOVERY MR 750磁共振扫描仪进行成像,采集线圈采用8通道颅脑线圈。扫描序列包括常规T1,T2WI,DWI及T2-FLAIR成像;3D ASL采集参数为TR/TE=5128/15.9 ms,翻转角=111o,FOV=20 cm×20 cm,x,y矩阵=1024×8(螺旋采集),层厚=3.0 mm,标记时间(PLD)1.5 s。3D T1-FSPGR采集参数为TR/TE=8.6/3.5 ms,翻转角=12o,FOV=22 cm× 22 cm,矩阵=256×256,层厚=1.2 mm,采集次数=1。
1.3 数据处理本研究中的数据处理主要基于GE ADW4.5工作站、matlab(V7.6)、freesurfer(v5.1)和SPM8。
(1)将ASL数据根据公式1[18-23]:处理生成脑血流(cerebral blood flow, CBF)图像。
| $ \begin{array}{l} {\rm{f}} = \frac{{\lambda \;\;\;\;\;\;\;\;\left( {{s_{con}}{\rm{-}}{S_{{\rm{l}}be}}} \right)\left( {1-{e^{-\frac{{{t_{sat}}}}{{{T_{1g}}}}}}} \right)}}{{ - \frac{\tau }{{{T_{1b}}}}\;\;\;\;\;\;\;\;\;\;\;\;\;\;\;\;{S_{ref}}}}e\frac{w}{{{T_{1b}}}}\\ \;\;\;\;\;2a{T_{1b}}\left( {1 - e\;\;\;\;} \right) \end{array} $ | (1) |
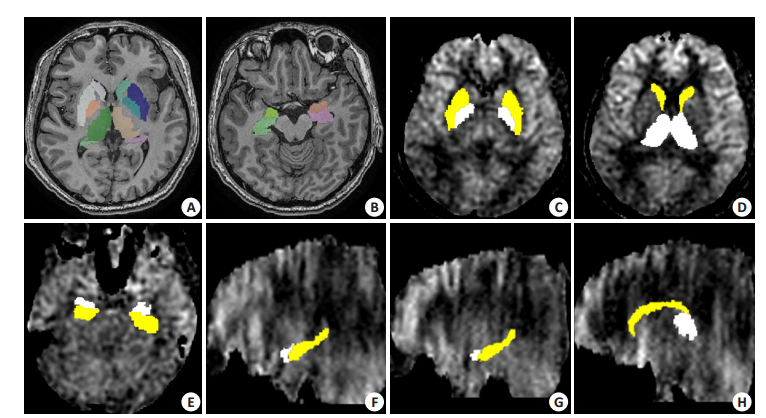
f,CBF;λ=0.9(脑-血分配系数);α=0.6(标记效率);T1b=1.6 s(血T1值);T1g=1.2 s(灰质T1值);τ=1.5 s(标记时间);Scon,Slbe,Sref,分别是标记前、标记后及参考图像的信号强度;tsat=2s(质子像饱和时间);w,标记时间;(2)对每个受试者3D结构像进行皮层下灰质核团分割,包括双侧壳核、苍白球、尾状核、丘脑、杏仁核及海马(图 1A,B);(3)将分割后的图像作为蒙片,基于CBF图提取皮层下灰质核团的CBF值(图 1C~H)。
|
图 1 层下灰质核团分割及脑血流值提取 Figure 1 Segmentation of the subcortical gray matter nucleus and calculation of the cerebral blood flow (CBF) value. A, B: Segmentation of the bilateral putamen, globus pallidus, caudate nucleus, thalamus, amygdala and hippocampus based on 3D structural images; C: Bilateral putamen and globus pallidus; D: Bilateral caudate nucleus and thalamus; E: Bilateral amygdala and hippocampus; F: Left amygdala and hippocampus; G: Right amygdala and hippocampus; H: Right caudate nucleus and thalamus. |
对两次扫描所获取的皮层下灰质核团的CBF值进行组内相关系数(ICC)分析及Bland-Altman图分析。ICC分析采用公式2[24-25]进行分析
| $ {\rm{ICC = }}\frac{{BMS-WMS}}{{BMS + \left( {k-s} \right)WMS}} $ | (2) |
BMS,受试者间平均方差;WMS,受试者内平均方差;k,每个受试者重复扫描次数。统计软件采用SPSS19.0。
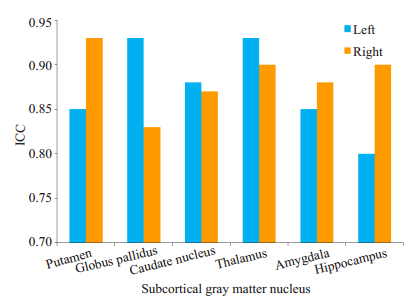
2 结果 2.1 皮层下灰质核团的组内相关系数分析基底节区核团ICC值为0.83~0.93,平均值为0.88± 0.04,右侧苍白球最低,ICC值为0.83,右侧壳核及右侧苍白球最高,ICC值为0.93。双侧丘脑ICC值较高,分别为0.93(左侧)及0.90(右侧)。双侧杏仁核的ICC值分别为0.85(左侧)及0.88(右侧),左侧海马ICC值为0.80,右侧为0.90(表 1,图 2)。
| 表 1 皮层下灰质核团的CBF值组内相关系数比较 Table 1 The comparison of intraclass correlation coefficient about the CBF value of subcortical gray matter nucleus |
|
图 2 皮层下灰质核团组内相关系数 Figure 2 Intraclass correlation coefficient of the subcortical gray nucleus. |
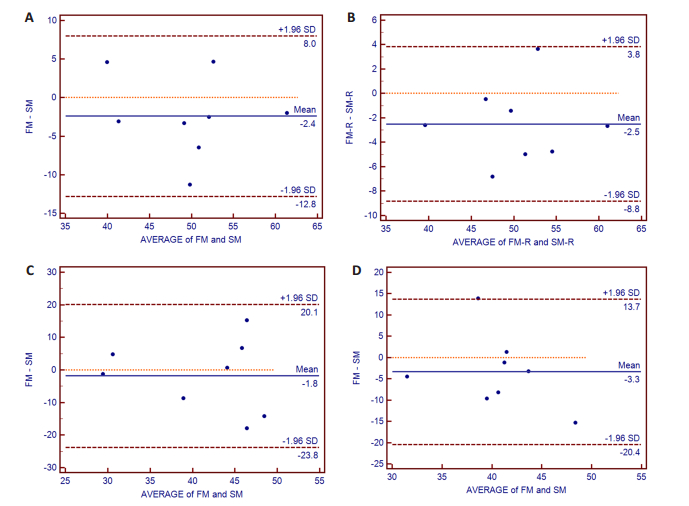
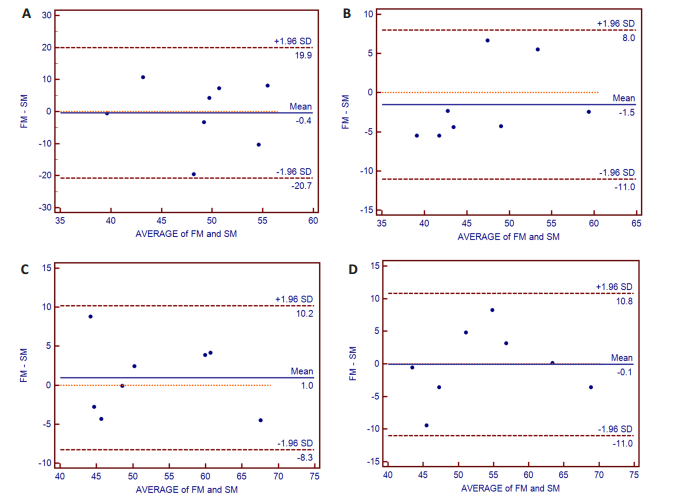
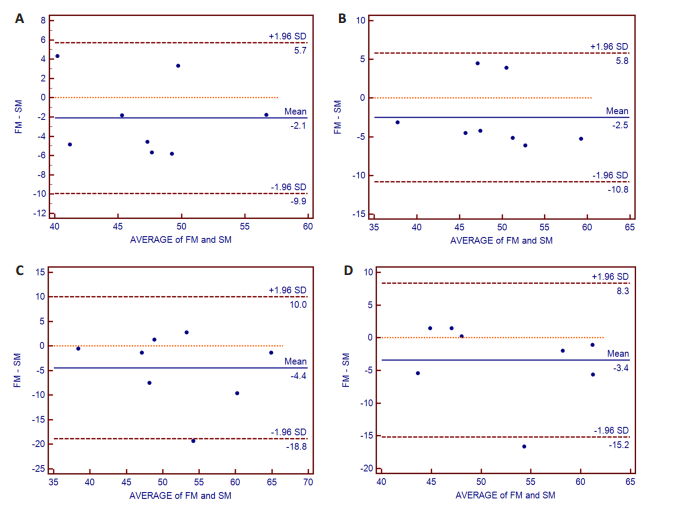
图 3提示双侧壳核及苍白球对应的点均在95%一致性界限内,图 4显示双侧尾状核及丘脑对应的点均位于95%一致性界限内,图 5提示双侧的杏仁核及海马对应的点均位于95%一致性界限内。
|
图 3 双侧壳核及苍白球Bland-Altman图 Figure 3 Bland-Altman plot analysis of bilateral putamen and globus pallidus. The points of the difference between both measurements were all located within 95% CI of limits of agreement. X-axis: Average of both measurements; Y-axis: Difference of both measurements; A: Left putamen; B: Right putamen; C: Left globus pallidus; D: Right globus pallidus; FM: First measurement; SM: Second measurement. |
|
图 4 双侧尾状核及丘脑Bland-Altman图 Figure 4 The Bland-Altman plot analysis of bilateral caudate nucleus and thalamus. The points of the difference between both measurements were all located in the lines of 95% CI of limits of agreement. X-axis, average of both measurements; Y-axis, the difference of both measurements; A: Left caudate nucleus; B: Right caudate nucleus; C: Left thalamus; D: Right thalamus; FM: First measurement; SM: Second measurement. |
|
图 5 双侧杏仁核及海马Bland-Altman图 Figure 5 The Bland-Altman plot analysis of bilateral amygdala and hippocampus. The points of the difference between both measurements were all located in the lines of 95% CI of limits of agreement. X-axis, average of both measurements; Y-axis, the difference of both measurements; A: Left amygdala; B: Right amygdala; C: Left hippocampus; D: Right hippocampus; FM: First measurement; SM: Second measurement. |
3D-ASL序列采用FSE采集数据,3维全脑容积扫描,属于全脑容积灌注成像,具有较强的临床适用价值[13],如脑肿瘤诊断[12],多发性硬化斑块评价[11]等。在临床实践中我们看到对于呈明显高灌注的病变,3D ASL显示的高灌注范围要大于动态对比剂增强的灌注。因此,在广泛的临床应用之前,需要对其可重复性进行研究。
皮层下灰质结构属于脑深部灰质核团,通常属于中继核团,在脑部的功能联通性中具有重要作用,组成了皮层下特殊的多种功能环路,和人的情绪,认知等密切相关。因此,本研究主要对皮层下结构进行3D-ASL的可重复性进行研究。
ICC分析证实,基底节区的核团、丘脑、杏仁核及海马均具有较高的可重复性,ICC值为0.80~0.93。根据Landis和Koch[26]的建议,ICC值0.8以上可以认为具有良好的可重复性。因此,可以认为基于3D-ASL的皮层下灰质结构的灌注测量是可靠。同时,Bland-Altman图形分析也证实所有受试者皮层下灰质结构对应的点均位于95%的一致性界限之内,进一步证实了3D-ASL的良好的可重复性。同时,根据Bland-Altman图,可以将两次的均值作为皮层下结构的最终的CBF值。
目前对于磁共振功能成像的测量临床上主要采用感兴趣区法(ROI),ROI可以分为局部ROI,整体ROI及容积ROI。在本研究中,主要采用的是容积ROI。首先对每个受试
本研究所采用的组内相关系数分析,由Bartko[27] 1966年首次用来进行信度评估,是目前较为通用的信度评估方法,既可以对分类资料进行评估,又可以对定量资料进行评估,同时兼顾了随机误差和系统误差对于实验结果的影响,因此结果是可靠的。之所以没有对前后两次数据进行配对t检验,是因为配对t检验是对两组数据差异的比较,对于随机误差并不明显,因此用配对t检验来进行一致性检验是不准确的。同时,本研究有对前后两次数据进行了Bland-Altman图形分析[28],Bland-Altman图形分析实质上是一种方差齐性检验,采用图形的方法显示两种测量结果的一致性界限,同时考虑到了系统误差和随机误差,因此,其结果是可靠的。
本实验的质量控制较为严格:(1)所有受试者均为具有较高文化程度,配合程度较佳;(2)在实验前1 h内要求所有受试者禁止剧烈活动及引用含有咖啡因类的饮料;(3)要求患者基本保持相同的心率及脉搏;(4)平躺扫描床上10 min开始扫描;(5)扫描时要求患者保持静息状态,闭眼,并保持身体不动,处于放松状态;(6)前后两次扫描时间均为同一时间段扫描。因此,本实验结果相对真实地反映了脑部结构的血流状态。
本研究的不足之处包括:(1)仅对PLD1.5s进行了可重复性研究,对于其他PLD时间来说可重复性尚需要进一步的评估;(2)没有进行任务态或病变的脑部3D ASL的评估,对于可重复性的差异是随机噪声产生的,还是生理性噪声产生,尚需进一步研究;(3)样本量偏小,未来需要加大样本量进行研究;(4)缺少病例组的对照研究,不同的疾病状态可能会影响到脑血流的流速,因此,在不同的疾病状态中的可重复性研究尚需进行。
总之,3D-ASL可以用来可靠地活体评估皮层下灰质结构的灌注状态。
| [1] | Detre JA, Leigh JS, Williams DS, et al. Perfusion imaging[J]. Magn Reson Med, 1992, 23(1): 37-45. DOI: 10.1002/(ISSN)1522-2594. |
| [2] | Parkes LM, Rashid W, Chard DT, et al. Normal cerebral perfusion measurements using arterial spin labeling: Reproducibility, stability, and age and gender effects[J]. Magn Reson Med, 2004, 51(4): 736-43. DOI: 10.1002/(ISSN)1522-2594. |
| [3] | Amann M, Achtnichts L, Hirsch JG, et al. 3D GRASE arterial spin labelling reveals an inverse correlation of cortical perfusion with the white matter lesion volume in MS[J]. Mult Scler, 2012, 18(11): 1570-6. DOI: 10.1177/1352458512441984. |
| [4] | Xing D, Zha Y, Yan L, et al. Feasibility of ASL spinal bone marrow perfusion imaging with optimized inversion time[J]. J Magn Reson Imaging, 2015, 42(5): 1314-20. DOI: 10.1002/jmri.v42.5. |
| [5] | Lehman LL, Danehy AR, Trenor CC, et al. Transient focal neurologic symptoms correspond to regional cerebral hypoperfusion by MRI: A stroke mimic in children[J]. AJNR Am J Neuroradiol, 2017, [Epub ahead of print]. http://www.ncbi.nlm.nih.gov/pubmed/28705823 |
| [6] | Shinohara Y, Kato A, Kuya K, et al. Perfusion Mr imaging using a 3D pulsed continuous arterial Spin-Labeling method for acute cerebral infarction classified as branch atheromatous disease involving the lenticulostriate artery territory[J]. AJNR Am J Neuroradiol, 2017, [Epub ahead of print]. http://europepmc.org/abstract/MED/28596191 |
| [7] | 赵倩倩, 杨秋霞, 许桂晓, 等. 全脑3D动脉自旋标记成像在颅脑肿瘤诊断中的应用价值[J]. 中华医学杂志, 2017, 97(23): 1801-4. DOI: 10.3760/cma.j.issn.0376-2491.2017.23.009. |
| [8] | Brendle C, Hempel JM, Schittenhelm J, et al. Glioma grading and determination of IDH mutation status and ATRX loss by DCE and ASL perfusion[J]. Clin Neuroradiol, 2017, [Epub ahead of print]. http://link.springer.com/10.1007/s00062-017-0590-z |
| [9] | Collij LE, Heeman F, Kuijer JP, et al. Application of machine learning to arterial spin labeling in mild cognitive impairment and alzheimer disease[J]. Radiology, 2016, 281(3): 865-75. DOI: 10.1148/radiol.2016152703. |
| [10] | Chen ZY, Li JF, Sun J, et al. Brain expansion in patients with type Ⅱ diabetes following insulin therapy: a preliminary study with longitudinal Voxel-Based morphometry[J]. J Neuroimaging, 2014, 24(5): 484-91. DOI: 10.1111/jon.2014.24.issue-5. |
| [11] | Chen ZY, Ma L. Hyperperfusion of multiple sclerosis plaques characterized by 3D FSE arterial spin labelling[J]. Chin Med Sci J, 2014, 29(3): 194-6. DOI: 10.1016/S1001-9294(14)60069-9. |
| [12] | Xiao HF, Chen ZY, Lou X, et al. Astrocytic tumour grading: a comparative study of three-dimensional pseudocontinuous arterial spin labelling, dynamic susceptibility contrast-enhanced perfusion weighted imaging, and diffusion-weighted imaging[J]. Eur Radiol, 2015, 25(12): 3423-30. DOI: 10.1007/s00330-015-3768-2. |
| [13] | 陈志晔, 关志伟, 于生元, 等. 三维伪连续动脉自旋标记灌注成像与正电子发射计算机断层显像在脑部病变诊断中的比较[J]. 中国医学科学院学报, 2014, 36(4): 377-84. |
| [14] | Yen YF, Field AS, Martin EM, et al. Test-retest reproducibility of quantitative CBF measurements using FAIR perfusion MRI and acetazolamide challenge[J]. Magn Reson Med, 2002, 47(5): 921-8. DOI: 10.1002/(ISSN)1522-2594. |
| [15] | Jiang L, Kim M, Chodkowski B, et al. Reliability and repro ducibility of perfusion MRI in cognitively normal subjects[J]. Magn Reson Imaging, 2010, 28(9): 1283-9. DOI: 10.1016/j.mri.2010.05.002. |
| [16] | Huang DD, Wu B, Shi KN, et al. Reliability of Three-Dimensional Pseudo-Continuous arterial spin labeling Mr imaging for measuring visual cortex perfusion on two 3T scanners[J]. PLoS One, 2013, 8(11): e79471. DOI: 10.1371/journal.pone.0079471. |
| [17] | Xu G, Rowley H, Wu G, et al. Reliability and precision of pseudo continuous arterial spin labeling perfusion MRI on 3.0 T and comparison with 15O-water PET in elderly subjects at risk for Alzheimer's disease[J]. NMR Biomed, 20210, 23(3): 286-93. |
| [18] | Jarnum H, Steffensen EG, Knutsson L, et al. Perfusion MRI of brain tumours: a comparative study of pseudo-continuous arterial spin labelling and dynamic susceptibility contrast imaging[J]. Neuroradiology, 2010, 52(4): 307-17. DOI: 10.1007/s00234-009-0616-6. |
| [19] | Alsop DC, Detre JA. Reduced transit-time sensitivity in noninvasive magnetic resonance imaging of human cerebral blood flow[J]. J Cereb Blood Flow Metab, 1996, 16(6): 1236-49. DOI: 10.1097/00004647-199611000-00019. |
| [20] | Wang JJ, Zhang Y, Wolf RL, et al. Amplitude-modulated continuous arterial spin-labeling 3.0 T perfusion Mr imaging with a single coil: Feasibility study[J]. Radiology, 2005, 235(1): 218-28. DOI: 10.1148/radiol.2351031663. |
| [21] | Garcia DM, Duhamel G, Alsop DC. Efficiency of inversion pulses for background suppressed arterial spin labeling[J]. Magn Reson Med, 2005, 54(2): 366-72. DOI: 10.1002/(ISSN)1522-2594. |
| [22] | Dai W, Garcia D, De Bazelaire C, et al. Continuous flow-driven inversion for arterial spin labeling using pulsed Radio frequency and gradient fields[J]. Magn Reson Med, 2008, 60(6): 1488-97. DOI: 10.1002/mrm.v60:6. |
| [23] | Herscovitch P, Raichle ME. What is the correct value for the brain-blood partition coefficient for water?[J]. J Cereb Blood Flow Metab, 1985, 5(1): 65-9. DOI: 10.1038/jcbfm.1985.9. |
| [24] | Mcgraw KO, Wong S. Forming inferences about some intraclass correlation coefficients[J]. Psychol Methods, 1996, 1(1): 30. DOI: 10.1037/1082-989X.1.1.30. |
| [25] | Shrout PE, Fleiss JL. Intraclass correlations: uses in assessing rater reliability[J]. Psychol Bull, 1979, 86(2): 420-8. DOI: 10.1037/0033-2909.86.2.420. |
| [26] | Landis JR, Koch GG. The measurement of observer agreement for categorical data[J]. Biometrics, 1977, 33(1): 159-74. DOI: 10.2307/2529310. |
| [27] | Bartko JJ. The intraclass correlation coefficient as a measure of reliability[J]. Psychol Rep, 1966, 19(1): 3-11. DOI: 10.2466/pr0.1966.19.1.3. |
| [28] | Bland JM, Altman DG. Statistical methods for assessing agreement between two methods of clinical measurement[J]. Lancet, 1986, 1(8476): 307-10. |
 2017, Vol. 37

