Journal of Southern Medical University ›› 2025, Vol. 45 ›› Issue (3): 443-452.doi: 10.12122/j.issn.1673-4254.2025.03.01
Ying ZHOU1( ), Danyang ZHANG2, Lifan WU3, Guishan WANG1, Jiedan MU1, Chengwen CUI1, Xiuxiu SHI1, Jige DONG4, Yu WANG2, Wangli XU2, Xiao LI1()
Received:2024-11-28
Online:2025-03-20
Published:2025-03-28
Contact:
Xiao LI
E-mail:zhouying1018atnm@sina.com;lixiaoPLA@163.com
Ying ZHOU, Danyang ZHANG, Lifan WU, Guishan WANG, Jiedan MU, Chengwen CUI, Xiuxiu SHI, Jige DONG, Yu WANG, Wangli XU, Xiao LI. Epidemiological survey of osteoporosis in Beijing over the past decade: a single-center analysis of dual-energy X-ray absorptiometry scans from 30 599 individuals[J]. Journal of Southern Medical University, 2025, 45(3): 443-452.
Add to citation manager EndNote|Ris|BibTeX
URL: https://www.j-smu.com/EN/10.12122/j.issn.1673-4254.2025.03.01
| Characteristic | Total (n=30 599) | Men (n=11 228) | Women (n=19 371) | P |
|---|---|---|---|---|
| Age [year, n (%)] | <0.001 | |||
| ≤19 | 83 (0.3%) | 48 (0.4%) | 35 (0.2%) | |
| 20-24 | 663 (2.2%) | 503 (4.5%) | 160 (0.8%) | |
| 25-29 | 851 (2.8%) | 546 (4.9%) | 305 (1.6%) | |
| 30-34 | 1001 (3.3%) | 553 (4.9%) | 448 (2.3%) | |
| 35-39 | 1112 (3.6%) | 522 (4.6%) | 590 (3.0%) | |
| 40-44 | 1524 (5.0%) | 619 (5.5%) | 905 (4.7%) | |
| 45-49 | 2,403 (7.9%) | 876 (7.8%) | 1527 (7.9%) | |
| 50-54 | 3828 (13.0%) | 1175 (10.0%) | 2653 (14.0%) | |
| 55-59 | 4157 (14.0%) | 1206 (11.0%) | 2951 (15.0%) | |
| 60-64 | 4319 (14.0%) | 1370 (12.0%) | 2949 (15.0%) | |
| 65-69 | 3680 (12.0%) | 1218 (11.0%) | 2462 (13.0%) | |
| 70-74 | 2768 (9.0%) | 951 (8.5%) | 1817 (9.4%) | |
| 75-79 | 2227 (7.3%) | 780 (6.9%) | 1447 (7.5%) | |
| ≥80 | 1983 (6.5%) | 861 (7.7%) | 1122 (5.8%) | |
| BMI# [kg/m2, n (%)] | <0.001 | |||
| <18.5 | 1073 (3.5%) | 272 (2.4%) | 801 (4.2%) | |
| 18.5-23.9 | 13 545 (45%) | 4244 (38%) | 9301 (48%) | |
| 24-27.9 | 11 539 (38%) | 4807 (43%) | 6732 (35%) | |
| ≥28 | 4174 (14%) | 1803 (16%) | 2371 (12%) | |
| Year of BMD measurement | <0.001 | |||
| 2013 | 2633 (8.6%) | 724 (6.4%) | 1909 (9.9%) | |
| 2014 | 4041 (13%) | 1307 (12%) | 2734 (14%) | |
| 2015 | 3018 (9.9%) | 1017 (9.1%) | 2001 (10%) | |
| 2016 | 3073 (10%) | 1145 (10%) | 1928 (10.0%) | |
| 2017 | 2817 (9.2%) | 1130 (10%) | 1687 (8.7%) | |
| 2018 | 2715 (8.9%) | 1000 (8.9%) | 1715 (8.9%) | |
| 2019 | 2503 (8.2%) | 944 (8.4%) | 1559 (8.0%) | |
| 2020 | 1102 (3.6%) | 410 (3.7%) | 692 (3.6%) | |
| 2021 | 3488 (11%) | 1432 (13%) | 2056 (11%) | |
| 2022 | 3048 (10.0%) | 1212 (11%) | 1836 (9.5%) | |
| 2023 | 2161 (7.1%) | 907 (8.1%) | 1254 (6.5%) |
Tab.1 Demographic characteristics of the participants
| Characteristic | Total (n=30 599) | Men (n=11 228) | Women (n=19 371) | P |
|---|---|---|---|---|
| Age [year, n (%)] | <0.001 | |||
| ≤19 | 83 (0.3%) | 48 (0.4%) | 35 (0.2%) | |
| 20-24 | 663 (2.2%) | 503 (4.5%) | 160 (0.8%) | |
| 25-29 | 851 (2.8%) | 546 (4.9%) | 305 (1.6%) | |
| 30-34 | 1001 (3.3%) | 553 (4.9%) | 448 (2.3%) | |
| 35-39 | 1112 (3.6%) | 522 (4.6%) | 590 (3.0%) | |
| 40-44 | 1524 (5.0%) | 619 (5.5%) | 905 (4.7%) | |
| 45-49 | 2,403 (7.9%) | 876 (7.8%) | 1527 (7.9%) | |
| 50-54 | 3828 (13.0%) | 1175 (10.0%) | 2653 (14.0%) | |
| 55-59 | 4157 (14.0%) | 1206 (11.0%) | 2951 (15.0%) | |
| 60-64 | 4319 (14.0%) | 1370 (12.0%) | 2949 (15.0%) | |
| 65-69 | 3680 (12.0%) | 1218 (11.0%) | 2462 (13.0%) | |
| 70-74 | 2768 (9.0%) | 951 (8.5%) | 1817 (9.4%) | |
| 75-79 | 2227 (7.3%) | 780 (6.9%) | 1447 (7.5%) | |
| ≥80 | 1983 (6.5%) | 861 (7.7%) | 1122 (5.8%) | |
| BMI# [kg/m2, n (%)] | <0.001 | |||
| <18.5 | 1073 (3.5%) | 272 (2.4%) | 801 (4.2%) | |
| 18.5-23.9 | 13 545 (45%) | 4244 (38%) | 9301 (48%) | |
| 24-27.9 | 11 539 (38%) | 4807 (43%) | 6732 (35%) | |
| ≥28 | 4174 (14%) | 1803 (16%) | 2371 (12%) | |
| Year of BMD measurement | <0.001 | |||
| 2013 | 2633 (8.6%) | 724 (6.4%) | 1909 (9.9%) | |
| 2014 | 4041 (13%) | 1307 (12%) | 2734 (14%) | |
| 2015 | 3018 (9.9%) | 1017 (9.1%) | 2001 (10%) | |
| 2016 | 3073 (10%) | 1145 (10%) | 1928 (10.0%) | |
| 2017 | 2817 (9.2%) | 1130 (10%) | 1687 (8.7%) | |
| 2018 | 2715 (8.9%) | 1000 (8.9%) | 1715 (8.9%) | |
| 2019 | 2503 (8.2%) | 944 (8.4%) | 1559 (8.0%) | |
| 2020 | 1102 (3.6%) | 410 (3.7%) | 692 (3.6%) | |
| 2021 | 3488 (11%) | 1432 (13%) | 2056 (11%) | |
| 2022 | 3048 (10.0%) | 1212 (11%) | 1836 (9.5%) | |
| 2023 | 2161 (7.1%) | 907 (8.1%) | 1254 (6.5%) |
| Age group (year) | BMI (kg/m2) | Lumbar spine 1-4 BMD (g/cm2) | Total femur BMD (g/cm2) | Femoral neck BMD (g/cm2) |
|---|---|---|---|---|
| ≤19 | 21.42±3.45 | 0.90±0.15 | 0.86±0.17 | 0.79±0.16 |
| 20-24 | 22.69±3.42 | 0.98±0.11 | 0.96±0.14 | 0.90±0.15 |
| 25-29 | 22.84±3.66 | 0.99±0.12 | 0.94±0.15 | 0.87±0.15 |
| 30-34 | 23.63±3.82 | 0.98±0.12 | 0.91±0.13 | 0.83±0.13 |
| 35-39 | 24.00±3.85 | 0.99±0.12 | 0.90±0.12 | 0.81±0.13 |
| 40-44 | 24.26±3.59 | 0.99±0.12 | 0.90±0.12 | 0.80±0.12 |
| 45-49 | 24.42±3.45 | 0.98±0.14 | 0.90±0.13 | 0.79±0.12 |
| 50-54 | 24.47±3.41 | 0.95±0.14 | 0.87±0.13 | 0.76±0.12 |
| 55-59 | 24.60±3.38 | 0.90±0.15 | 0.84±0.13 | 0.73±0.12 |
| 60-64 | 24.55±3.31 | 0.89±0.16 | 0.82±0.13 | 0.70±0.12 |
| 65-69 | 24.73±3.34 | 0.88±0.18 | 0.80±0.14 | 0.69±0.13 |
| 70-74 | 24.52±3.45 | 0.88±0.19 | 0.78±0.14 | 0.66±0.12 |
| 75-79 | 24.00±3.42 | 0.88±0.19 | 0.75±0.14 | 0.63±0.13 |
| ≥80 | 23.50±3.36 | 0.91±0.21 | 0.74±0.15 | 0.62±0.13 |
Tab.2 BMD values and BMI across the age groups (Mean±SD)
| Age group (year) | BMI (kg/m2) | Lumbar spine 1-4 BMD (g/cm2) | Total femur BMD (g/cm2) | Femoral neck BMD (g/cm2) |
|---|---|---|---|---|
| ≤19 | 21.42±3.45 | 0.90±0.15 | 0.86±0.17 | 0.79±0.16 |
| 20-24 | 22.69±3.42 | 0.98±0.11 | 0.96±0.14 | 0.90±0.15 |
| 25-29 | 22.84±3.66 | 0.99±0.12 | 0.94±0.15 | 0.87±0.15 |
| 30-34 | 23.63±3.82 | 0.98±0.12 | 0.91±0.13 | 0.83±0.13 |
| 35-39 | 24.00±3.85 | 0.99±0.12 | 0.90±0.12 | 0.81±0.13 |
| 40-44 | 24.26±3.59 | 0.99±0.12 | 0.90±0.12 | 0.80±0.12 |
| 45-49 | 24.42±3.45 | 0.98±0.14 | 0.90±0.13 | 0.79±0.12 |
| 50-54 | 24.47±3.41 | 0.95±0.14 | 0.87±0.13 | 0.76±0.12 |
| 55-59 | 24.60±3.38 | 0.90±0.15 | 0.84±0.13 | 0.73±0.12 |
| 60-64 | 24.55±3.31 | 0.89±0.16 | 0.82±0.13 | 0.70±0.12 |
| 65-69 | 24.73±3.34 | 0.88±0.18 | 0.80±0.14 | 0.69±0.13 |
| 70-74 | 24.52±3.45 | 0.88±0.19 | 0.78±0.14 | 0.66±0.12 |
| 75-79 | 24.00±3.42 | 0.88±0.19 | 0.75±0.14 | 0.63±0.13 |
| ≥80 | 23.50±3.36 | 0.91±0.21 | 0.74±0.15 | 0.62±0.13 |
| Age group (year) | BMI (kg/m2) | Lumbar spine 1-4 BMD (g/cm2) | Total femur BMD (g/cm2) | Femoral neck BMD (g/cm2) |
|---|---|---|---|---|
| ≤19 | 21.72±3.62 | 0.89±0.16 | 0.88±0.20 | 0.80±0.19 |
| 20-24 | 23.21±3.28 | 0.98±0.12 | 0.99±0.13 | 0.94±0.14 |
| 25-29 | 23.80±3.38 | 1.00±0.12 | 0.98±0.15 | 0.91±0.15 |
| 30-34 | 24.96±3.50 | 0.99±0.12 | 0.95±0.12 | 0.87±0.12 |
| 35-39 | 25.57±3.76 | 0.99±0.13 | 0.94±0.13 | 0.86±0.13 |
| 40-44 | 25.64±3.42 | 0.98±0.14 | 0.93±0.13 | 0.83±0.13 |
| 45-49 | 25.85±3.42 | 0.97±0.14 | 0.92±0.13 | 0.82±0.12 |
| 50-54 | 25.51±3.43 | 0.98±0.15 | 0.91±0.13 | 0.80±0.12 |
| 55-59 | 25.41±3.26 | 0.97±0.15 | 0.91±0.13 | 0.79±0.12 |
| 60-64 | 25.03±3.13 | 0.98±0.16 | 0.90±0.13 | 0.78±0.12 |
| 65-69 | 24.97±3.08 | 1.00±0.17 | 0.90±0.13 | 0.77±0.12 |
| 70-74 | 24.61±3.12 | 1.00±0.18 | 0.88±0.13 | 0.74±0.12 |
| 75-79 | 23.80±3.14 | 1.01±0.18 | 0.86±0.13 | 0.72±0.13 |
| ≥80 | 23.53±3.14 | 1.03±0.20 | 0.83±0.14 | 0.70±0.12 |
Tab.3 BMD values and BMI across the age groups in men (Mean±SD)
| Age group (year) | BMI (kg/m2) | Lumbar spine 1-4 BMD (g/cm2) | Total femur BMD (g/cm2) | Femoral neck BMD (g/cm2) |
|---|---|---|---|---|
| ≤19 | 21.72±3.62 | 0.89±0.16 | 0.88±0.20 | 0.80±0.19 |
| 20-24 | 23.21±3.28 | 0.98±0.12 | 0.99±0.13 | 0.94±0.14 |
| 25-29 | 23.80±3.38 | 1.00±0.12 | 0.98±0.15 | 0.91±0.15 |
| 30-34 | 24.96±3.50 | 0.99±0.12 | 0.95±0.12 | 0.87±0.12 |
| 35-39 | 25.57±3.76 | 0.99±0.13 | 0.94±0.13 | 0.86±0.13 |
| 40-44 | 25.64±3.42 | 0.98±0.14 | 0.93±0.13 | 0.83±0.13 |
| 45-49 | 25.85±3.42 | 0.97±0.14 | 0.92±0.13 | 0.82±0.12 |
| 50-54 | 25.51±3.43 | 0.98±0.15 | 0.91±0.13 | 0.80±0.12 |
| 55-59 | 25.41±3.26 | 0.97±0.15 | 0.91±0.13 | 0.79±0.12 |
| 60-64 | 25.03±3.13 | 0.98±0.16 | 0.90±0.13 | 0.78±0.12 |
| 65-69 | 24.97±3.08 | 1.00±0.17 | 0.90±0.13 | 0.77±0.12 |
| 70-74 | 24.61±3.12 | 1.00±0.18 | 0.88±0.13 | 0.74±0.12 |
| 75-79 | 23.80±3.14 | 1.01±0.18 | 0.86±0.13 | 0.72±0.13 |
| ≥80 | 23.53±3.14 | 1.03±0.20 | 0.83±0.14 | 0.70±0.12 |
| Age group (year) | BMI (kg/m2) | Lumbar spine 1-4 BMD (g/cm2) | Total femur BMD (g/cm2) | Femoral neck BMD (g/cm2) |
|---|---|---|---|---|
| ≤19 | 21.02±3.21 | 0.92±0.13 | 0.84±0.13 | 0.78±0.12 |
| 20-24 | 21.04±3.35 | 0.96±0.11 | 0.87±0.11 | 0.79±0.11 |
| 25-29 | 21.13±3.52 | 0.97±0.11 | 0.86±0.11 | 0.78±0.10 |
| 30-34 | 22.00±3.57 | 0.98±0.12 | 0.86±0.12 | 0.77±0.12 |
| 35-39 | 22.61±3.36 | 0.99±0.12 | 0.87±0.11 | 0.77±0.10 |
| 40-44 | 23.31±3.39 | 0.99±0.12 | 0.88±0.11 | 0.78±0.11 |
| 45-49 | 23.60±3.20 | 0.98±0.13 | 0.88±0.12 | 0.77±0.12 |
| 50-54 | 24.01±3.30 | 0.94±0.14 | 0.86±0.12 | 0.75±0.11 |
| 55-59 | 24.27±3.37 | 0.87±0.14 | 0.81±0.12 | 0.70±0.11 |
| 60-64 | 24.33±3.36 | 0.84±0.13 | 0.78±0.11 | 0.67±0.10 |
| 65-69 | 24.61±3.46 | 0.82±0.15 | 0.75±0.12 | 0.64±0.10 |
| 70-74 | 24.48±3.60 | 0.82±0.15 | 0.73±0.12 | 0.61±0.10 |
| 75-79 | 24.11±3.56 | 0.81±0.15 | 0.70±0.12 | 0.58±0.10 |
| ≥80 | 23.48±3.51 | 0.83±0.16 | 0.66±0.12 | 0.56±0.10 |
Tab.4 BMD values and BMI across the age groups in women
| Age group (year) | BMI (kg/m2) | Lumbar spine 1-4 BMD (g/cm2) | Total femur BMD (g/cm2) | Femoral neck BMD (g/cm2) |
|---|---|---|---|---|
| ≤19 | 21.02±3.21 | 0.92±0.13 | 0.84±0.13 | 0.78±0.12 |
| 20-24 | 21.04±3.35 | 0.96±0.11 | 0.87±0.11 | 0.79±0.11 |
| 25-29 | 21.13±3.52 | 0.97±0.11 | 0.86±0.11 | 0.78±0.10 |
| 30-34 | 22.00±3.57 | 0.98±0.12 | 0.86±0.12 | 0.77±0.12 |
| 35-39 | 22.61±3.36 | 0.99±0.12 | 0.87±0.11 | 0.77±0.10 |
| 40-44 | 23.31±3.39 | 0.99±0.12 | 0.88±0.11 | 0.78±0.11 |
| 45-49 | 23.60±3.20 | 0.98±0.13 | 0.88±0.12 | 0.77±0.12 |
| 50-54 | 24.01±3.30 | 0.94±0.14 | 0.86±0.12 | 0.75±0.11 |
| 55-59 | 24.27±3.37 | 0.87±0.14 | 0.81±0.12 | 0.70±0.11 |
| 60-64 | 24.33±3.36 | 0.84±0.13 | 0.78±0.11 | 0.67±0.10 |
| 65-69 | 24.61±3.46 | 0.82±0.15 | 0.75±0.12 | 0.64±0.10 |
| 70-74 | 24.48±3.60 | 0.82±0.15 | 0.73±0.12 | 0.61±0.10 |
| 75-79 | 24.11±3.56 | 0.81±0.15 | 0.70±0.12 | 0.58±0.10 |
| ≥80 | 23.48±3.51 | 0.83±0.16 | 0.66±0.12 | 0.56±0.10 |
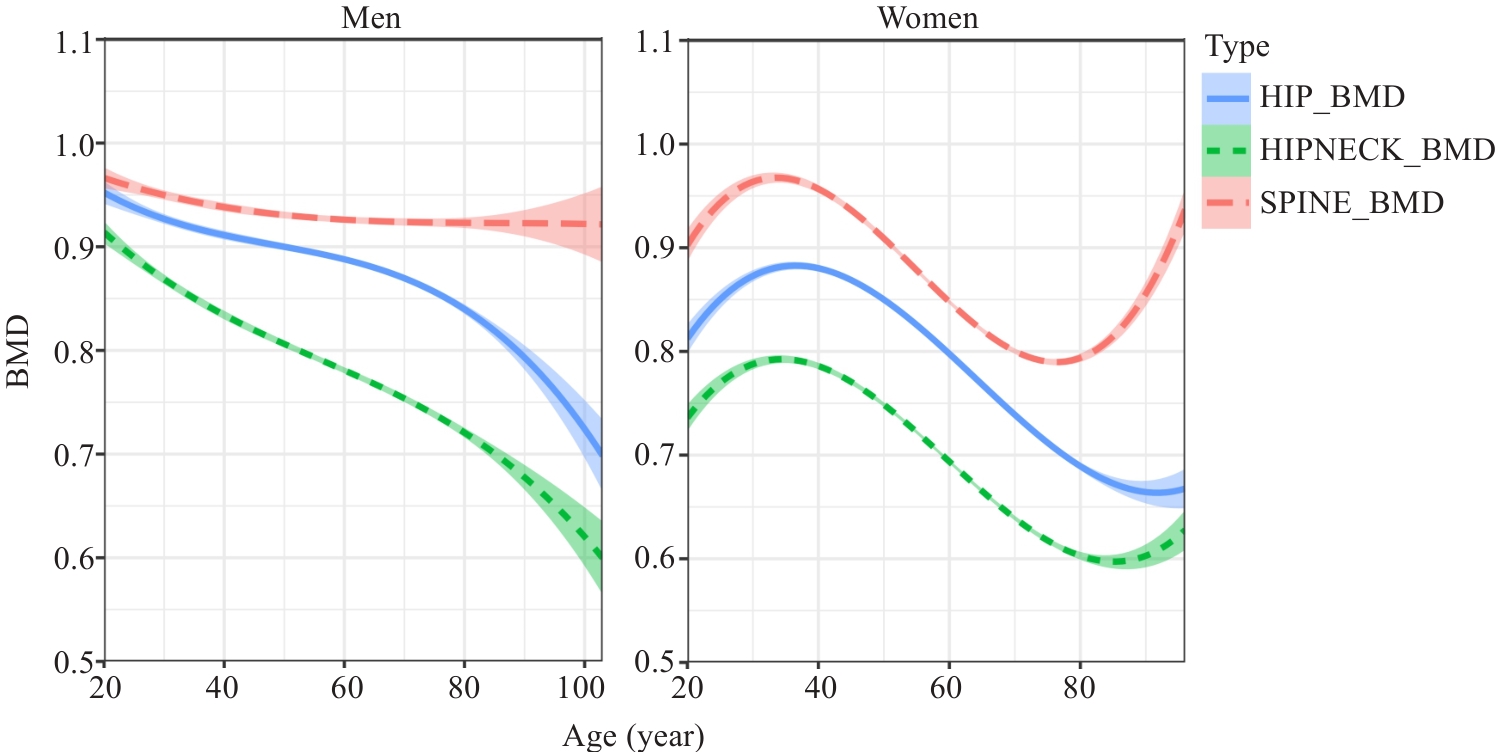
Fig.1 Cubic regression curves of BMD variation with age groups.
| BMI (kg/m2) | Lumbar spine 1-4 BMD (g/cm2) | Total femur BMD (g/cm2) | Femoral neck BMD (g/cm2) |
|---|---|---|---|
| Men | |||
| <18.5 | 0.76±0.13 | 0.87±0.16 | 0.67±0.13 |
| 18.5-23.9 | 0.87±0.13 | 0.96±0.15 | 0.77±0.14 |
| 24-27.9 | 0.92±0.13 | 1.01±0.15 | 0.81±0.13 |
| ≥28 | 0.97±0.13 | 1.05±0.16 | 0.85±0.13 |
| Women | |||
| <18.5 | 0.69±0.14 | 0.79±0.16 | 0.61±0.13 |
| 18.5-23.9 | 0.77±0.13 | 0.86±0.15 | 0.67±0.12 |
| 24-27.9 | 0.81±0.13 | 0.90±0.15 | 0.70±0.12 |
| ≥28 | 0.85±0.13 | 0.94±0.15 | 0.73±0.13 |
Tab.5 BMD values across the BMI groups in men and women
| BMI (kg/m2) | Lumbar spine 1-4 BMD (g/cm2) | Total femur BMD (g/cm2) | Femoral neck BMD (g/cm2) |
|---|---|---|---|
| Men | |||
| <18.5 | 0.76±0.13 | 0.87±0.16 | 0.67±0.13 |
| 18.5-23.9 | 0.87±0.13 | 0.96±0.15 | 0.77±0.14 |
| 24-27.9 | 0.92±0.13 | 1.01±0.15 | 0.81±0.13 |
| ≥28 | 0.97±0.13 | 1.05±0.16 | 0.85±0.13 |
| Women | |||
| <18.5 | 0.69±0.14 | 0.79±0.16 | 0.61±0.13 |
| 18.5-23.9 | 0.77±0.13 | 0.86±0.15 | 0.67±0.12 |
| 24-27.9 | 0.81±0.13 | 0.90±0.15 | 0.70±0.12 |
| ≥28 | 0.85±0.13 | 0.94±0.15 | 0.73±0.13 |
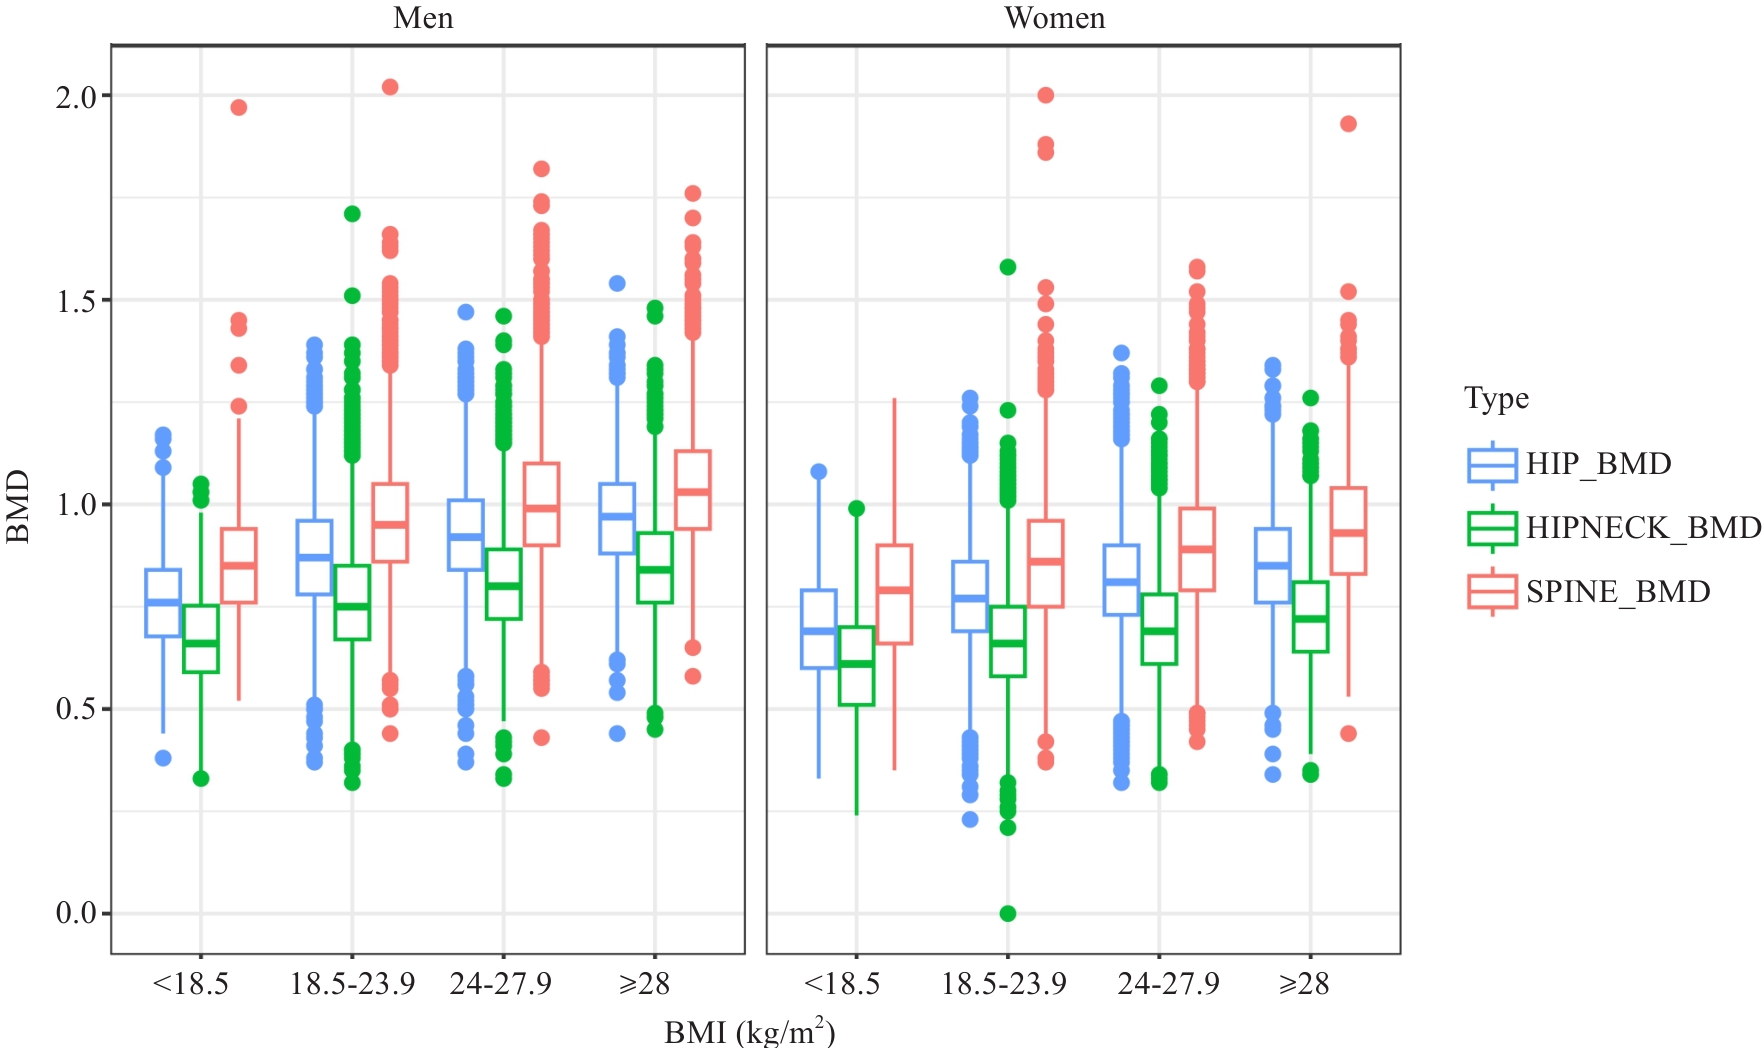
Fig. 2 Cubic regression curves of BMD variation with BMI groups.
| Variables | Total femur | Femoral neck | Lumbar spine 1-4 | ||||||
|---|---|---|---|---|---|---|---|---|---|
| β | SE | P | β | SE | P | β | SE | P | |
| Women | |||||||||
| Age groups (year) | |||||||||
| 20-24 | 0.025 | 0.021 | 0.238 | 0.014 | 0.019 | 0.487 | 0.026 | 0.025 | 0.295 |
| 25-29 | 0.001 | 0.020 | 0.955 | -0.016 | 0.019 | 0.405 | 0.014 | 0.024 | 0.557 |
| 30-34 | -0.026 | 0.020 | 0.183 | -0.038 | 0.018 | 0.040 | 0.000 | 0.024 | 0.991 |
| 35-39 | -0.038 | 0.020 | 0.051 | -0.054 | 0.018 | 0.003 | -0.017 | 0.024 | 0.459 |
| 40-44 | -0.045 | 0.020 | 0.022 | -0.065 | 0.018 | <0.001 | -0.041 | 0.024 | 0.078 |
| 45-49 | -0.054 | 0.020 | 0.006 | -0.071 | 0.018 | <0.001 | -0.057 | 0.024 | 0.015 |
| 50-54 | -0.078 | 0.020 | <0.001 | -0.096 | 0.019 | <0.001 | -0.097 | 0.024 | <0.001 |
| 55-59 | -0.128 | 0.020 | <0.001 | -0.140 | 0.019 | <0.001 | -0.159 | 0.024 | <0.001 |
| 60-64 | -0.176 | 0.020 | <0.001 | -0.186 | 0.019 | <0.001 | -0.214 | 0.025 | <0.001 |
| 65-69 | -0.224 | 0.021 | <0.001 | -0.228 | 0.019 | <0.001 | -0.257 | 0.025 | <0.001 |
| 70-74 | -0.264 | 0.021 | <0.001 | -0.265 | 0.020 | <0.001 | -0.280 | 0.026 | <0.001 |
| 75-79 | -0.305 | 0.022 | <0.001 | -0.304 | 0.020 | <0.001 | -0.307 | 0.026 | <0.001 |
| ≥80 | -0.347 | 0.022 | <0.001 | -0.337 | 0.021 | <0.001 | -0.309 | 0.027 | <0.001 |
| BMI (kg/m2) | |||||||||
| 18.5-23.9 | 0.046 | 0.004 | <0.001 | 0.038 | 0.004 | <0.001 | 0.035 | 0.005 | <0.001 |
| 24-27.9 | 0.070 | 0.006 | <0.001 | 0.061 | 0.005 | <0.001 | 0.043 | 0.007 | <0.001 |
| ≥28 | 0.071 | 0.008 | <0.001 | 0.064 | 0.007 | <0.001 | 0.039 | 0.010 | <0.001 |
| Age×BMI | 0.000 | 0.000 | <0.001 | 0.000 | 0.000 | <0.001 | 0.000 | 0.000 | <0.001 |
| Menopause | -0.051 | 0.003 | <0.001 | -0.044 | 0.003 | <0.001 | -0.082 | 0.004 | <0.001 |
| Men | |||||||||
| Age groups (year) | |||||||||
| 20-24 | 0.082 | 0.019 | <0.001 | 0.108 | 0.019 | <0.001 | 0.061 | 0.023 | 0.008 |
| 25-29 | 0.054 | 0.019 | 0.005 | 0.070 | 0.019 | <0.001 | 0.053 | 0.023 | 0.020 |
| 30-34 | -0.005 | 0.019 | 0.816 | 0.005 | 0.019 | 0.799 | 0.000 | 0.023 | 0.996 |
| 35-39 | -0.035 | 0.020 | 0.074 | -0.029 | 0.019 | 0.129 | -0.030 | 0.023 | 0.201 |
| 40-44 | -0.074 | 0.020 | <0.001 | -0.071 | 0.019 | <0.001 | -0.068 | 0.024 | 0.004 |
| 45-49 | -0.104 | 0.020 | <0.001 | -0.102 | 0.020 | <0.001 | -0.105 | 0.024 | <0.001 |
| 50-54 | -0.126 | 0.021 | <0.001 | -0.125 | 0.020 | <0.001 | -0.125 | 0.025 | <0.001 |
| 55-59 | -0.149 | 0.021 | <0.001 | -0.153 | 0.021 | <0.001 | -0.160 | 0.025 | <0.001 |
| 60-64 | -0.169 | 0.022 | <0.001 | -0.169 | 0.021 | <0.001 | -0.163 | 0.026 | <0.001 |
| 65-69 | -0.191 | 0.023 | <0.001 | -0.191 | 0.022 | <0.001 | -0.173 | 0.027 | <0.001 |
| 70-74 | -0.222 | 0.023 | <0.001 | -0.233 | 0.023 | <0.001 | -0.190 | 0.028 | <0.001 |
| 75-79 | -0.249 | 0.024 | <0.001 | -0.257 | 0.023 | <0.001 | -0.196 | 0.029 | <0.001 |
| ≥80 | -0.292 | 0.025 | <0.001 | -0.293 | 0.024 | <0.001 | -0.205 | 0.030 | <0.001 |
| BMI (kg/m2) | |||||||||
| 18.5-23.9 | 0.070 | 0.009 | <0.001 | 0.063 | 0.008 | <0.001 | 0.039 | 0.010 | <0.001 |
| 24-27.9 | 0.098 | 0.010 | <0.001 | 0.090 | 0.010 | <0.001 | 0.047 | 0.012 | <0.001 |
| ≥28 | 0.092 | 0.013 | <0.001 | 0.088 | 0.012 | <0.001 | 0.037 | 0.015 | 0.015 |
| Age×BMI | 0.000 | 0.000 | <0.001 | 0.000 | 0.000 | <0.001 | 0.000 | 0.000 | <0.001 |
Tab.6 Multivariate regression analyses of associations between BMD values and demographic variables
| Variables | Total femur | Femoral neck | Lumbar spine 1-4 | ||||||
|---|---|---|---|---|---|---|---|---|---|
| β | SE | P | β | SE | P | β | SE | P | |
| Women | |||||||||
| Age groups (year) | |||||||||
| 20-24 | 0.025 | 0.021 | 0.238 | 0.014 | 0.019 | 0.487 | 0.026 | 0.025 | 0.295 |
| 25-29 | 0.001 | 0.020 | 0.955 | -0.016 | 0.019 | 0.405 | 0.014 | 0.024 | 0.557 |
| 30-34 | -0.026 | 0.020 | 0.183 | -0.038 | 0.018 | 0.040 | 0.000 | 0.024 | 0.991 |
| 35-39 | -0.038 | 0.020 | 0.051 | -0.054 | 0.018 | 0.003 | -0.017 | 0.024 | 0.459 |
| 40-44 | -0.045 | 0.020 | 0.022 | -0.065 | 0.018 | <0.001 | -0.041 | 0.024 | 0.078 |
| 45-49 | -0.054 | 0.020 | 0.006 | -0.071 | 0.018 | <0.001 | -0.057 | 0.024 | 0.015 |
| 50-54 | -0.078 | 0.020 | <0.001 | -0.096 | 0.019 | <0.001 | -0.097 | 0.024 | <0.001 |
| 55-59 | -0.128 | 0.020 | <0.001 | -0.140 | 0.019 | <0.001 | -0.159 | 0.024 | <0.001 |
| 60-64 | -0.176 | 0.020 | <0.001 | -0.186 | 0.019 | <0.001 | -0.214 | 0.025 | <0.001 |
| 65-69 | -0.224 | 0.021 | <0.001 | -0.228 | 0.019 | <0.001 | -0.257 | 0.025 | <0.001 |
| 70-74 | -0.264 | 0.021 | <0.001 | -0.265 | 0.020 | <0.001 | -0.280 | 0.026 | <0.001 |
| 75-79 | -0.305 | 0.022 | <0.001 | -0.304 | 0.020 | <0.001 | -0.307 | 0.026 | <0.001 |
| ≥80 | -0.347 | 0.022 | <0.001 | -0.337 | 0.021 | <0.001 | -0.309 | 0.027 | <0.001 |
| BMI (kg/m2) | |||||||||
| 18.5-23.9 | 0.046 | 0.004 | <0.001 | 0.038 | 0.004 | <0.001 | 0.035 | 0.005 | <0.001 |
| 24-27.9 | 0.070 | 0.006 | <0.001 | 0.061 | 0.005 | <0.001 | 0.043 | 0.007 | <0.001 |
| ≥28 | 0.071 | 0.008 | <0.001 | 0.064 | 0.007 | <0.001 | 0.039 | 0.010 | <0.001 |
| Age×BMI | 0.000 | 0.000 | <0.001 | 0.000 | 0.000 | <0.001 | 0.000 | 0.000 | <0.001 |
| Menopause | -0.051 | 0.003 | <0.001 | -0.044 | 0.003 | <0.001 | -0.082 | 0.004 | <0.001 |
| Men | |||||||||
| Age groups (year) | |||||||||
| 20-24 | 0.082 | 0.019 | <0.001 | 0.108 | 0.019 | <0.001 | 0.061 | 0.023 | 0.008 |
| 25-29 | 0.054 | 0.019 | 0.005 | 0.070 | 0.019 | <0.001 | 0.053 | 0.023 | 0.020 |
| 30-34 | -0.005 | 0.019 | 0.816 | 0.005 | 0.019 | 0.799 | 0.000 | 0.023 | 0.996 |
| 35-39 | -0.035 | 0.020 | 0.074 | -0.029 | 0.019 | 0.129 | -0.030 | 0.023 | 0.201 |
| 40-44 | -0.074 | 0.020 | <0.001 | -0.071 | 0.019 | <0.001 | -0.068 | 0.024 | 0.004 |
| 45-49 | -0.104 | 0.020 | <0.001 | -0.102 | 0.020 | <0.001 | -0.105 | 0.024 | <0.001 |
| 50-54 | -0.126 | 0.021 | <0.001 | -0.125 | 0.020 | <0.001 | -0.125 | 0.025 | <0.001 |
| 55-59 | -0.149 | 0.021 | <0.001 | -0.153 | 0.021 | <0.001 | -0.160 | 0.025 | <0.001 |
| 60-64 | -0.169 | 0.022 | <0.001 | -0.169 | 0.021 | <0.001 | -0.163 | 0.026 | <0.001 |
| 65-69 | -0.191 | 0.023 | <0.001 | -0.191 | 0.022 | <0.001 | -0.173 | 0.027 | <0.001 |
| 70-74 | -0.222 | 0.023 | <0.001 | -0.233 | 0.023 | <0.001 | -0.190 | 0.028 | <0.001 |
| 75-79 | -0.249 | 0.024 | <0.001 | -0.257 | 0.023 | <0.001 | -0.196 | 0.029 | <0.001 |
| ≥80 | -0.292 | 0.025 | <0.001 | -0.293 | 0.024 | <0.001 | -0.205 | 0.030 | <0.001 |
| BMI (kg/m2) | |||||||||
| 18.5-23.9 | 0.070 | 0.009 | <0.001 | 0.063 | 0.008 | <0.001 | 0.039 | 0.010 | <0.001 |
| 24-27.9 | 0.098 | 0.010 | <0.001 | 0.090 | 0.010 | <0.001 | 0.047 | 0.012 | <0.001 |
| ≥28 | 0.092 | 0.013 | <0.001 | 0.088 | 0.012 | <0.001 | 0.037 | 0.015 | 0.015 |
| Age×BMI | 0.000 | 0.000 | <0.001 | 0.000 | 0.000 | <0.001 | 0.000 | 0.000 | <0.001 |
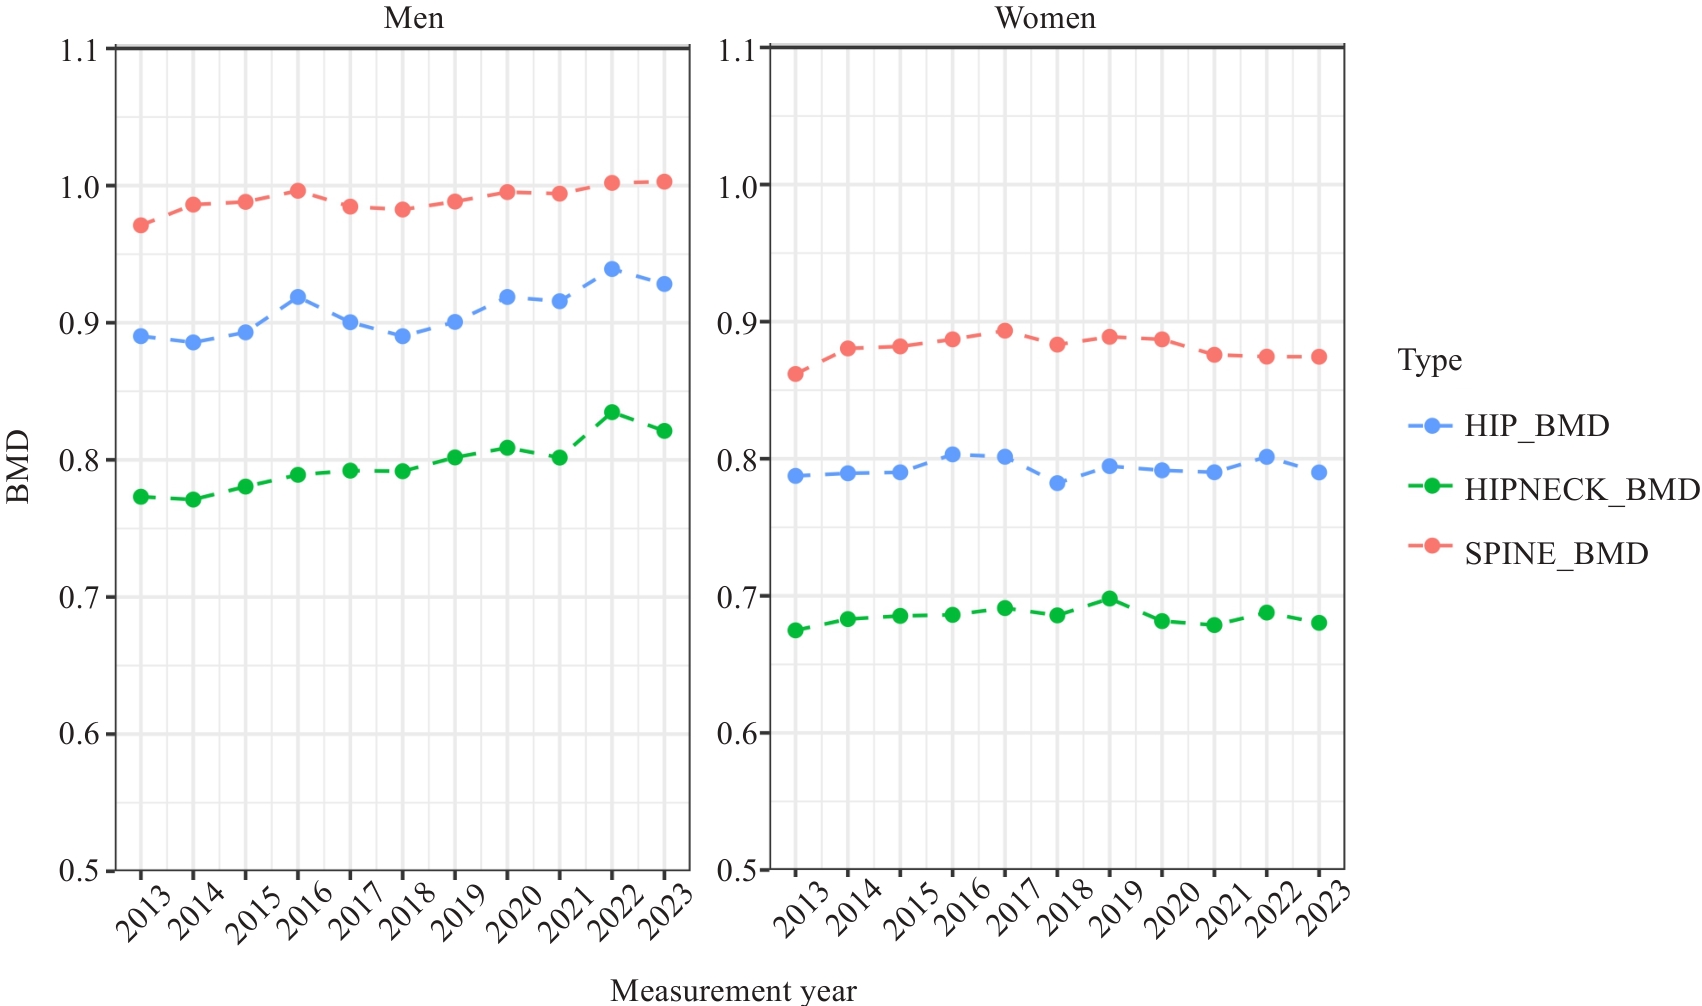
Fig.3 BMD values across the year of measurements.
| BMD | 2013 | 2014 | 2015 | 2016 | 2017 | 2018 | 2019 | 2020 | 2021 | 2022 | 2023 |
|---|---|---|---|---|---|---|---|---|---|---|---|
| n | 2633 | 4041 | 3018 | 3073 | 2817 | 2715 | 2503 | 1102 | 3488 | 3048 | 2161 |
Lumbar spine 1-4 BMD(g/cm2) | 0.89±0.16 | 0.92±0.16 | 0.92±0.16 | 0.93±0.16 | 0.93±0.16 | 0.92±0.17 | 0.93±0.17 | 0.93±0.16 | 0.93±0.17 | 0.93±0.17 | 0.93±0.17 |
Total femur BMD(g/cm2) | 0.82±0.14 | 0.82±0.14 | 0.83±0.14 | 0.85±0.15 | 0.84±0.15 | 0.82±0.15 | 0.83±0.15 | 0.84±0.15 | 0.84±0.15 | 0.86±0.15 | 0.85±0.15 |
Femoral neck BMD(g/cm2) | 0.70±0.13 | 0.71±0.13 | 0.72±0.14 | 0.73±0.14 | 0.73±0.14 | 0.73±0.14 | 0.74±0.14 | 0.73±0.15 | 0.73±0.15 | 0.75±0.16 | 0.74±0.15 |
Tab.7 BMD values across the year of measurement (Mean±SD)
| BMD | 2013 | 2014 | 2015 | 2016 | 2017 | 2018 | 2019 | 2020 | 2021 | 2022 | 2023 |
|---|---|---|---|---|---|---|---|---|---|---|---|
| n | 2633 | 4041 | 3018 | 3073 | 2817 | 2715 | 2503 | 1102 | 3488 | 3048 | 2161 |
Lumbar spine 1-4 BMD(g/cm2) | 0.89±0.16 | 0.92±0.16 | 0.92±0.16 | 0.93±0.16 | 0.93±0.16 | 0.92±0.17 | 0.93±0.17 | 0.93±0.16 | 0.93±0.17 | 0.93±0.17 | 0.93±0.17 |
Total femur BMD(g/cm2) | 0.82±0.14 | 0.82±0.14 | 0.83±0.14 | 0.85±0.15 | 0.84±0.15 | 0.82±0.15 | 0.83±0.15 | 0.84±0.15 | 0.84±0.15 | 0.86±0.15 | 0.85±0.15 |
Femoral neck BMD(g/cm2) | 0.70±0.13 | 0.71±0.13 | 0.72±0.14 | 0.73±0.14 | 0.73±0.14 | 0.73±0.14 | 0.74±0.14 | 0.73±0.15 | 0.73±0.15 | 0.75±0.16 | 0.74±0.15 |
| Variables | Lumbar spine 1-4 | Femoral neck | Total femur | |||
|---|---|---|---|---|---|---|
| Age group (year) | BMD value | Age group (year) | BMD value | Age group (year) | BMD value | |
| Men | 25-29 | 1.00±0.12 | 20-24 | 0.94±0.14 | 20-24 | 0.99±0.13 |
| Women | 40-44 | 0.99±0.12 | 40-44 | 0.79±0.11 | 20-24 | 0.88±0.11 |
| P | 0.022 | <0.001 | <0.001 | |||
Tab.8 The peak BMD values among all the age groups
| Variables | Lumbar spine 1-4 | Femoral neck | Total femur | |||
|---|---|---|---|---|---|---|
| Age group (year) | BMD value | Age group (year) | BMD value | Age group (year) | BMD value | |
| Men | 25-29 | 1.00±0.12 | 20-24 | 0.94±0.14 | 20-24 | 0.99±0.13 |
| Women | 40-44 | 0.99±0.12 | 40-44 | 0.79±0.11 | 20-24 | 0.88±0.11 |
| P | 0.022 | <0.001 | <0.001 | |||
Year of Measure-ment | Prevalence of osteoporosis | Prevalence of osteopenia | ||||||||||
|---|---|---|---|---|---|---|---|---|---|---|---|---|
| Men | Women | All | Men | Women | All | |||||||
| n | % | n | % | n | % | n | % | n | % | n | % | |
| 2013 | 138 | 19.38% | 709 | 37.47% | 847 | 32.53% | 545 | 76.54% | 1570 | 82.98% | 2115 | 81.22% |
| 2014 | 222 | 17.24% | 886 | 32.83% | 1108 | 27.79% | 941 | 73.06% | 2158 | 79.96% | 3099 | 77.73% |
| 2015 | 159 | 15.88% | 640 | 32.54% | 799 | 26.92% | 717 | 71.63% | 1563 | 79.46% | 2280 | 76.82% |
| 2016 | 162 | 14.25% | 603 | 31.52% | 765 | 25.08% | 798 | 70.18% | 1520 | 79.46% | 2318 | 76.00% |
| 2017 | 172 | 15.33% | 523 | 31.19% | 695 | 24.83% | 792 | 70.59% | 1300 | 77.52% | 2092 | 74.74% |
| 2018 | 161 | 16.16% | 560 | 32.88% | 721 | 26.71% | 715 | 71.79% | 1358 | 79.74% | 2073 | 76.81% |
| 2019 | 156 | 16.58% | 481 | 30.93% | 637 | 25.52% | 642 | 68.23% | 1198 | 77.04% | 1840 | 73.72% |
| 2020 | 70 | 17.11% | 210 | 30.48% | 280 | 25.50% | 271 | 66.26% | 549 | 79.68% | 820 | 74.68% |
| 2021 | 209 | 14.76% | 701 | 34.50% | 910 | 26.39% | 980 | 69.21% | 1643 | 80.86% | 2623 | 76.07% |
| 2022 | 149 | 12.42% | 638 | 34.86% | 787 | 25.97% | 755 | 62.92% | 1445 | 78.96% | 2200 | 72.61% |
| 2023 | 119 | 13.16% | 443 | 35.50% | 562 | 26.12% | 583 | 64.49% | 1006 | 80.61% | 1589 | 73.84% |
Tab.9 Prevalence of osteoporosis and osteopenia across the year of measurement
Year of Measure-ment | Prevalence of osteoporosis | Prevalence of osteopenia | ||||||||||
|---|---|---|---|---|---|---|---|---|---|---|---|---|
| Men | Women | All | Men | Women | All | |||||||
| n | % | n | % | n | % | n | % | n | % | n | % | |
| 2013 | 138 | 19.38% | 709 | 37.47% | 847 | 32.53% | 545 | 76.54% | 1570 | 82.98% | 2115 | 81.22% |
| 2014 | 222 | 17.24% | 886 | 32.83% | 1108 | 27.79% | 941 | 73.06% | 2158 | 79.96% | 3099 | 77.73% |
| 2015 | 159 | 15.88% | 640 | 32.54% | 799 | 26.92% | 717 | 71.63% | 1563 | 79.46% | 2280 | 76.82% |
| 2016 | 162 | 14.25% | 603 | 31.52% | 765 | 25.08% | 798 | 70.18% | 1520 | 79.46% | 2318 | 76.00% |
| 2017 | 172 | 15.33% | 523 | 31.19% | 695 | 24.83% | 792 | 70.59% | 1300 | 77.52% | 2092 | 74.74% |
| 2018 | 161 | 16.16% | 560 | 32.88% | 721 | 26.71% | 715 | 71.79% | 1358 | 79.74% | 2073 | 76.81% |
| 2019 | 156 | 16.58% | 481 | 30.93% | 637 | 25.52% | 642 | 68.23% | 1198 | 77.04% | 1840 | 73.72% |
| 2020 | 70 | 17.11% | 210 | 30.48% | 280 | 25.50% | 271 | 66.26% | 549 | 79.68% | 820 | 74.68% |
| 2021 | 209 | 14.76% | 701 | 34.50% | 910 | 26.39% | 980 | 69.21% | 1643 | 80.86% | 2623 | 76.07% |
| 2022 | 149 | 12.42% | 638 | 34.86% | 787 | 25.97% | 755 | 62.92% | 1445 | 78.96% | 2200 | 72.61% |
| 2023 | 119 | 13.16% | 443 | 35.50% | 562 | 26.12% | 583 | 64.49% | 1006 | 80.61% | 1589 | 73.84% |
| 1 | Alejandro P, Constantinescu F. A review of osteoporosis in the older adult[J]. Rheum Dis Clin N Am, 2018, 44(3): 437-51. |
| 2 | Willers C, Norton N, Harvey NC, et al. Osteoporosis in Europe: a compendium of country-specific reports[J]. Arch Osteoporos, 2022, 17(1): 23. |
| 3 | Chen ZN, Wen Y, Qiu ML, et al. The pattern and trends of disease burden due to low bone mineral density from 1990 to 2019 in China: findings from the Global Burden of Disease Study 2019[J]. Arch Osteoporos, 2022, 17(1): 39. |
| 4 | Dong YM, Kang HL, Peng RP, et al. Global, regional, and national burden of low bone mineral density from 1990 to 2019: results from the global burden of disease study 2019[J]. Front Endocrinol, 2022, 13: 870905. |
| 5 | Fuggle NR, Beaudart C, Bruyère O, et al. Evidence-Based Guideline for the management of osteoporosis in men[J]. Nat Rev Rheumatol, 2024, 20(4): 241-51. |
| 6 | Ensrud KE, Crandall CJ. Osteoporosis[J]. Ann Intern Med, 2024, 177(1): ITC1-ITC16. |
| 7 | Wáng YXJ. Estimation of osteoporosis prevalence among a population is reasonable only after the concerned reference bone mineral density database and cutpoint T-score have been validated[J]. Osteoporos Int, 2023, 34(2): 417-8. |
| 8 | 王 亮, 马远征, 张 妍, 等. 北京地区9103例体检人群骨密度流行病学调查研究[J]. 中国骨质疏松杂志, 2014, 20(8): 952-5. |
| 9 | 罗 薇, 刘 珍, 刘海丹, 等. 北京地区3859名体检人群骨密度调查及骨量异常患病率分析[J]. 中国骨质疏松杂志, 2020, 26(5): 719-22. |
| 10 | 张娅惠, 薛秋艳, 谷 洁, 等. 北京海淀部分人群骨质疏松流行病学及相关危险因素研究[J]. 现代生物医学进展, 2020, 20(13): 2545-50. |
| 11 | 刘 宁, 张国强, 兰雅智. 北京某社区60岁以上老年人群骨质疏松症发病特点及影响因素分析[J]. 中国骨与关节损伤杂志, 2022, 37(12): 1327-30. |
| 12 | Cui P, Wang W, Wang Z, et al. The association between body mass index and bone mineral density in older adults: a cross-sectional study of community population in Beijing[J]. BMC Musculoskelet Disord, 2024, 25(1): 655. |
| 13 | 姚立彬, 张林华, 李百战, 等. 邢台山区老年人骨质疏松症流行病学调查及危险因素分析[J]. 解放军预防医学杂志, 2020, 38(2): 58-60. |
| 14 | Canbek U, Rosberg DBH, Rosberg HE, et al. The effect of age, BMI, and bone mineral density on the various lumbar vertebral measurements in females[J]. Surg Radiol Anat, 2021, 43(1): 101-8. |
| 15 | Zeng Q, Li N, Wang QQ, et al. The prevalence of osteoporosis in China, a nationwide, multicenter DXA survey[J]. J Bone Miner Res, 2019, 34(10): 1789-97. |
| 16 | Cherukuri L, Kinninger A, Birudaraju D, et al. Effect of body mass index on bone mineral density is age-specific[J]. Nutr Metab Cardiovasc Dis, 2021, 31(6): 1767-73. |
| 17 | Eghbali P, Becce F, Goetti P, et al. Age- and sex-specific normative values of bone mineral density in the adult glenoid[J]. J Orthop Res, 2023, 41(2): 263-70. |
| 18 | 中华人民共和国国家卫生健康委员会医政司. 肥胖症中国诊疗指南(2024年版) [J/OL]. 协和医学杂志, 1-60[2025-01-09]. |
| 19 | 中华医学会骨质疏松和骨矿盐疾病分会. 原发性骨质疏松症诊疗指南(2022)[J]. 中华骨质疏松和骨矿盐疾病杂志, 2022, 15(6): 573-611. |
| 20 | Tang YC, Peng B, Liu JM, et al. Systemic immune-inflammation index and bone mineral density in postmenopausal women: a cross-sectional study of the national health and nutrition examination survey (NHANES) 2007-2018[J]. Front Immunol, 2022, 13: 975400. |
| 21 | Kojima A, Kamiya K, Kajita E, et al. Association between dairy product intake and risk of osteoporotic fractures in postmenopausal Japanese women: secondary analysis of 15-year follow-up data from the Japanese population-based osteoporosis (JPOS) cohort study[J]. J Nutr Health Aging, 2023, 27(3): 228-37. |
| 22 | Wang LH, Yu W, Yin XJ, et al. Prevalence of osteoporosis and fracture in China: the China osteoporosis prevalence study[J]. JAMA Netw Open, 2021, 4(8): e2121106. |
| 23 | Schultz K, Wolf JM. Emerging technologies in osteoporosis diagnosis[J]. J Hand Surg Am, 2019, 44(3): 240-3. |
| 24 | Ichchou L, Allali F, Rostom S, et al. Relationship between spine osteoarthritis, bone mineral density and bone turn over markers in post menopausal women[J]. BMC Womens Health, 2010, 10: 25. |
| 25 | Yoshimura N, Iidaka T, Horii C, et al. Trends in osteoporosis prevalence over a 10-year period in Japan: the ROAD study 2005-2015[J]. J Bone Miner Metab, 2022, 40(5): 829-38. |
| 26 | Rathnayake H, Lekamwasam S, Wickramatilake C, et al. Trabecular bone score and bone mineral density reference data for women aged 20-70 years and the effect of local reference data on the prevalence of postmenopausal osteoporosis: a cross-sectional study from Sri Lanka [J]. Arch Osteoporos, 2019, 14(1): 91. |
| 27 | Wáng YXJ, Chan WP, Yu W, et al. Quantitative CT lumbar spine BMD cutpoint value for classifying osteoporosis among older Chinese men can be the same as that of older Chinese women, both much lower than the value for Caucasians[J]. Skeletal Radiol, 2025, 54(2): 193-8. |
| 28 | Lloyd JT, Alley DE, Hawkes WG, et al. Body mass index is positively associated with bone mineral density in US older adults[J]. Arch Osteoporos, 2014, 9: 175. |
| 29 | Glinkowski WM, Narloch J. Bone Density at the Entry Point Correlates With the Trabecular Bone of the Thoracolumbar Vertebral Bodies-Quantitative Computed Tomography Study[J]. Clin Densitom, 2019, 22(3): 367-73. |
| 30 | Ng AC, Joseph Melton L 3rd, Atkinson EJ, et al. Relationship of adiposity to bone volumetric density and microstructure in men and women across the adult lifespan[J]. Bone, 2013, 55(1): 119-25. |
| 31 | Wang LJ, You XL, Zhang LL, et al. Mechanical regulation of bone remodeling[J]. Bone Res, 2022, 10(1): 16. |
| 32 | Farley A, Gnyubkin V, Vanden-Bossche A, et al. Unloading-induced cortical bone loss is exacerbated by low-dose irradiation during a simulated deep space exploration mission[J]. Calcif Tissue Int, 2020, 107(2): 170-9. |
| 33 | Agostini F, de Sire A, Sveva V, et al. Rehabilitative good clinical practice in the treatment of osteoporosis: a comprehensive review of clinical evidences[J]. Disabil Rehabil, 2024: 1-15. |
| 34 | Izquierdo M, de Souto Barreto P, Arai H, et al. Global consensus on optimal exercise recommendations for enhancing healthy longevity in older adults (ICFSR)[J]. J Nutr Health Aging, 2025, 29(1): 100401. |
| 35 | Chen P, Li ZZ, Hu YH. Prevalence of osteoporosis in China: a meta-analysis and systematic review[J]. BMC Public Health, 2016, 16(1): 1039. |
| 36 | Qian Y, Mao JC. The association between night shift work and osteoporosis risk in adults: a cross-sectional analysis using NHANES[J]. Heliyon, 2024, 10(6): e28240. |
| 37 | Rubæk M, Hitz MF, Holmberg T, et al. Effectiveness of patient education for patients with osteoporosis: a systematic review[J]. Osteoporos Int, 2022, 33(5): 959-77. |
| 38 | Hejazi K, Askari R, Hofmeister M. Effects of physical exercise on bone mineral density in older postmenopausal women: a systematic review and meta-analysis of randomized controlled trials[J]. Arch Osteoporos, 2022, 17(1): 102. |
| 39 | 黄宏兴, 晁爱军, 程 群.中国健康促进基金会医疗机构骨质疏松专科建设专家共识委员会.医疗机构骨质疏松专科建设专家共识[J].中国骨质疏松杂志, 2024, 30(6): 781-9. |
| 40 | 刘功稳, 朱柯雨, 陆政峰.骨质疏松症和骨质疏松性骨折防治的现状及挑战[J]. 中华骨质疏松和骨矿盐疾病杂志, 2024, 17(5): 409-18. |
| [1] | Zhenxiang DONG, Yihao GUO, Qiang LIU, Yizhe ZHANG, Qianyi QIU, Xiaodong ZHANG, Yanqiu FENG. A single repetition time quantitative magnetic susceptibility imaging method for the lumbar spine using bipolar readout gradient [J]. Journal of Southern Medical University, 2025, 45(6): 1336-1342. |
| [2] | Yuancheng CHEN, Wen WU, Ling XU, Haiou DENG, Ruixue WANG, Qianwen HUANG, Liping XUAN, Xueying CHEN, Ximei ZHI. Changes in circulating levels of calcium and bone metabolism biochemical markers in patients receiving denosumab treatment [J]. Journal of Southern Medical University, 2025, 45(4): 760-764. |
| [3] | LUO Caizhu, CHEN Jinxiang, ZHANG Qun, YU Xuezhao, ZHANG Shuqin. A polylactic acid/hydroxyapatite/scholzite composite scaffold for promoting healing of osteoporotic bone defects in rats [J]. Journal of Southern Medical University, 2024, 44(2): 370-380. |
| [4] | CHEN Zifeng, LI Shengfa, ZHANG Youming, YANG Wanwen, WANG Ting. Lipocalin 2 induces self- limited inhibition of osteoblast differentiation of mesenchymal stem cells [J]. Journal of Southern Medical University, 2023, 43(8): 1339-1344. |
| [5] | WU Xiuhua, FAN Yingjing, YE Yongnong, LI Ping, ZHU Qing'an, CHEN Zesen, LI Bo, WANG Wen, ZHENG Lei. A transcriptomic study of osteoporosis induced by ketogenic diet in mice [J]. Journal of Southern Medical University, 2023, 43(8): 1440-1446. |
| [6] | ZHANG Jiahao, YANG Ruonan, HE Shuning, YUAN Ping. Spatial clustering analysis of scarlet fever incidence in China from 2016 to 2020 [J]. Journal of Southern Medical University, 2023, 43(4): 644-648. |
| [7] | RUAN Hongliang, SHE Dongmei, SUN Shaoqiu. Liuwei Dihuang Pills alleviates postmenopausal osteoporosis and fatigue in rats by inhibiting the epigenetic regulatory molecule BRD4 pathway [J]. Journal of Southern Medical University, 2023, 43(12): 1998-2005. |
| [8] | JIN Xiaoli, XU Jia, CHEN Xuanwei, CHEN Jin, HUANG Hui, ZHANG Ting, REN Jun, XU Jian. Oridonin suppresses the effect of thioacetamide for promoting osteoclast differentiation of RAW264.7 cells and inhibiting osteoblast differentiation of bone mesenchymal stem cells [J]. Journal of Southern Medical University, 2023, 43(11): 1892-1900. |
| [9] | HOU Tian, QIN Yazhi, ZHANG Yan, WEN Guochen, QI Mengchun, DONG Wei. Teriparatide regulates osteoblast differentiation in high-glucose microenvironment through the cAMP/PKA/CREB signaling pathway [J]. Journal of Southern Medical University, 2023, 43(1): 39-45. |
| [10] | FENG Yuanyi, YANG Dongmei, ZHI Ximei, DENG Haiou, ZHANG Weijie, WANG Ruixue, WU Wen. Role of interaction between reactive oxygen species and ferroptosis pathway in methylglyoxal-induced injury in mouse embryonic osteoblasts [J]. Journal of Southern Medical University, 2022, 42(1): 108-115. |
| [11] | CHENG Dongliang, FENG Hongmei, WEN Ge, LIU Jiangpin, HONG Julu, GAO Mingyong. Value of a nomogram model based on IDEAL-IQ for predicting early bone mass loss [J]. Journal of Southern Medical University, 2021, 41(11): 1707-1711. |
| [12] |
.
Kcnq1ot1 promotes osteogenic differentiation and suppresses osteoclast differentiation
[J]. Journal of Southern Medical University, 2021, 41(1): 31-38.
|
| [13] | . Prolonged continuous infusion of teriparatide promotes bone metabolism in normal but not in castrated mice [J]. Journal of Southern Medical University, 2019, 39(09): 1045-. |
| [14] | . Risedronate inhibits rat bone marrow adipogenesis and reduces RANKL expression in adipocytes [J]. Journal of Southern Medical University, 2019, 39(08): 987-. |
| [15] | . Estradiol significantly increases the expression of antioxidant enzymes in osteoporotic rats and osteoblasts in vitro [J]. Journal of Southern Medical University, 2018, 38(04): 402-. |
| Viewed | ||||||
|
Full text |
|
|||||
|
Abstract |
|
|||||